báo cáo khoa học: "Blue shift of CdSe/ZnS nanocrystal-labels upon DNA-hybridization" ppt
Bạn đang xem bản rút gọn của tài liệu. Xem và tải ngay bản đầy đủ của tài liệu tại đây (1.62 MB, 6 trang )
BioMed Central
Page 1 of 6
(page number not for citation purposes)
Journal of Nanobiotechnology
Open Access
Research
Blue shift of CdSe/ZnS nanocrystal-labels upon DNA-hybridization
Jürgen Riegler
†1,3
, Franck Ditengou
†2
, Klaus Palme
2
and Thomas Nann*
3
Address:
1
Fraunhofer Institute for Interfacial Engineering and Biotechnology, Nobelstrasse 12, 70569 Stuttgart, Germany,
2
Institute of Biology II/
Botany, Faculty of Biology, Albert-Ludwig University Freiburg, Schänzlestr. 1, 79104 Freiburg, Germany and
3
School of Chemical Sciences and
Pharmacy, University of East Anglia, Norwich Research Park, Norwich NR4 7TJ, UK
Email: Jürgen Riegler - ; Franck Ditengou - ;
Klaus Palme - ; Thomas Nann* -
* Corresponding author †Equal contributors
Abstract
Luminescence color multiplexing is one of the most intriguing benefits, which might occur by using
semiconductor Quantum Dots (QDs) as labels for biomolecules. It was found, that the
luminescence of QDs can be quenched, and replaced by a luminescence peak at approximately 460
nm on hybridization with certain regions of Arabidopsis thaliana tissue. This effect is site selective,
and it is unclear whether it occurs due to an energy transfer process, or due to quenching and
scattering of the excitation light. The article describes methods for phase-transfer of differently
coloured, hydrophobically ligated QDs, coupling of DNA strands to the QD's surface, and
hybridization of the labelled DNA to different cell types of Arabidopsis thaliana. The reason for the
luminescence blue-shift was studied systematically, and narrowed down to the above mentioned
causes.
Background
Fluorescence is a widely used tool in biology to study the
complexity and dynamics of biological processes. Com-
pared to conventional organic dye molecules, fluorescent
semiconductor nanocrystals (QDs) have several promis-
ing advantages. They can be excited by a broad range of
wavelengths from UV up to their individual absorption
edge, and they have narrow, tuneable emission spectra,
which can be well resolved over the same spectral range.
Moreover, in contrast to most organic fluorophores they
are highly resistant to chemical and metabolic degrada-
tion and have a higher photobleaching threshold [1-5].
The challenges for using QDs in biological studies include
designing hydrophilic QDs with surface chemistry well
adapted to different biological applications. Surface mod-
ified QDs should be luminescent with optical properties
not differing from the unmodified QDs [6-10].
Here we report the preparation of water-soluble CdSe/ZnS
QDs, which have been surface modified for versatile and
selective coupling of biological probes and subsequent
specific labeling of cells. Because of the wide emission
range, narrow spectral linewidth, brightness, and the
adjustable, size dependent emission wavelengths of these
QDs, they are expected to be a good choice for multiplex-
imaging. Theoretically our CdSe/ZnS QDs should allow
labeling of several different probes and imaging of up to
eight different biological molecules in the visible range of
the spectrum [11,12]. We demonstrate that synthetic oli-
gonucleotides can be efficiently covalently linked to these
QDs. We further show that they can be used for subse-
quent analysis of expressed genes by in situ hybridisation
experiments. The technique was successfully applied to
detect transcripts in the plant Arabidopsis thaliana, a fully
sequenced model organism [13].
Published: 19 May 2008
Journal of Nanobiotechnology 2008, 6:7 doi:10.1186/1477-3155-6-7
Received: 6 December 2007
Accepted: 19 May 2008
This article is available from: />© 2008 Riegler et al; licensee BioMed Central Ltd.
This is an Open Access article distributed under the terms of the Creative Commons Attribution License ( />),
which permits unrestricted use, distribution, and reproduction in any medium, provided the original work is properly cited.
Journal of Nanobiotechnology 2008, 6:7 />Page 2 of 6
(page number not for citation purposes)
Materials and methods
Preparation of QDs
CdSe/ZnS core/shell QDs were prepared according to a
method published previously [14]. Briefly, cadmium stea-
rate and trioctylphosohine-selenid (TOP-Se) were reacted
at temperatures above 200°C by fast injection of TOP-Se
into a mixture of trioctylphosphine-oxide (TOPO) and
cadmium stearate. The CdSe-cores were passivated and
annealed by growing a shell of two additional monolayers
of ZnS on their surface. Diethylzinc and hexamethyldisi-
lathian were reacted for 12 hours with the CdSe-cores at
160°C in the presence of TOPO and TOP, again. The core/
shell particles obtained were repeatedly washed with
methanol, and re-dispersed in chloroform. Finally the
particles were stored in 50 ml chloroform as stock solu-
tion.
Phase transfer and conjugation of DNA
Phase transfer of the CdSe-QDs to water phase and conju-
gation to oligonucleotides was carried out by double lig-
and exchange by modifying the procedure of Mirkin et al.
[15]. In a first step the TOPO on the surface of the particles
was exchanged with mercaptopropionic acid (MPA). 10
ml (0.1 molar) of a solution of MPA in dimethylforma-
mide (DMF) were added to solid QDs, precipitated out of
5 ml of each stock solution by addition of 10 ml methanol
and subsequent centrifugation. To complete the ligand
exchange, the QD solutions were incubated for 12 hours
at 80°C. To precipitate MPA-QDs, 100 μg of dimethyl-
aminopyridine (DMAP) were added to each sample, fol-
lowed by centrifugation at 10,000 g. The supernatants
with unincorporated MPA and DMPA were discarded and
the pellets containing QDs were dispersed in 1 ml of spe-
cific thionylated oligonucleotides in water. The slightly
colored solutions were incubated for additional 24 hours
at room temperature to partially exchange MPA against
the thionylated oligonucleotides. Finally the QD-oligonu-
cleotide conjugates were yielded by adding 3 M NaCl and
dialysis the solution against water for 72 hours while the
receiver was three times renewed. Five different antisense
specific QD-oligonucleotide conjugates were prepared
with emission-wavelengths at 543 nm (At5g05600-
5'gcatgcatgaaggcaaatcatcctttgaaaattcaaaatataaatgattgtacaca
tatacaagtcagacgtaatatc3'), 563 nm (At1g73590-
5'agaaagattagaggctctaggggttaagcacaaggagggggacataa3'),
598 nm (At5g47910-
5'cagagatctatacaaataaacacccgtaaggttactgtattagttgatagagaaa
aaataaccgctctc3'), 610 nm (At5g50960
5'cgtcgacttgagacttctcgaagggaatttttcgtttatatgtgaaactctctgcttat
ggcggcg'), and 653 nm (At2g24200-5'
ctgcacgactaaaacaaagtaccactttattcaacttttgacgattttacttttcat-
aac) respectively. Same oligonucleotides labeled with flu-
orescein (Genedetect-New Zealand) were used as
controls.
In situ hybridization
Arabidopsis thaliana floral meristems of 24 days old plants
were fixed with 4% paraformaldehyde in PBS (pH 7.3)
and embedded in paraffin. 7 μm tissue sections mounted
on SuperFrost
®
slides (Carl Roth, Germany) were used for
in situ hybridization. In situ hybridization was performed
as follows. SuperFrost
®
slides holding sectioned paraffin
embedded Arabidopsis thaliana inflorescence were de-
waxed by placing them in 3 changes of histoclear (PLANO
GmbH) for 3 minutes each, followed by 2 changes of
histoclear/ethanol (2:1 and then 1:2) followed by 3
changes of 100% ethanol for 3 minutes each. Tissues were
re-hydrated in 95%, 70%, 50% and 30% ethanol, for 2
minutes each. Slides were incubated in 0.2 M HCl for 20
min at room temperature. Slides were washed 2 × 5 min
in PBS and tissue were then permeabilized for 20 min at
37°C with TE buffer (20 mM Tris-HCl pH 7.5, 2 mM
CaCl
2
) containing 20 μg/ml of RNAse free Proteinase K
(Roche Diagnostics, Basel, Switzerland). The enzymatic
reaction was stopped by incubating slides in 0.2 mg/ml
glycine. After two rinses in PBS, tissues were carefully over-
laid with prehybridization buffer [50% formamide deion-
ised, 2× SSC (from 20× SSC, sodium chloride and 300
mM trisodium citrate, pH 7.0), 10 mg/ml yeast tRNA, 2%
dextransulfate, 10 mg/ml Poly A, 10 mg/ml ssDNA, 100
mM DTT, 50× Denhardts] and incubated in a humid
sealed chamber at 37°C for 2 hours. After 5 minute rinse
in 2× SSC, slides were overlaid with prehybridization
buffer supplemented with labelled oligonucleotides (25
ng/ml; 1/400 dilution) and incubated overnight at 37°C.
Post hybridization washes were done as follows. A quick
wash in 1× SSC (10 mM DTT) at RT, 2 × 15 min in 1× SSC
(10 mM DTT) at 55°C, 2 × 15 min in 0.5× SSC (10 mM
DTT) at 55°C and 1× in 0.5× SSC (10 mM DTT) at RT. For
sample processing the In SituPro robot (Intavis AG) was
used.
Microscopy
Plant sections were imaged using a laser scanning micro-
scope (LSM) (Zeiss LSM 510 META). QD-labeled oligonu-
cleotides were excited with a laser beam in the UV range
(405 nm excitation wavelength) and the full visible emis-
sion spectrum was recorded. This allowed to precisely dif-
ferentiate expected emission wavelength from
background emission. This method also allowed detec-
tion of any shift in QD emission wave length.
Spectroscopy
Photoluminescence (PL) and absorption spectra were
recorded on a J&M TIDAS diode array spectrometer using
standard quartz cuvettes. QD spectra were recorded in
aqueous buffer solution.
Journal of Nanobiotechnology 2008, 6:7 />Page 3 of 6
(page number not for citation purposes)
Results and Discussion
Generalized approach for QD labeling of oligonucleotides
We and others have already reported the chemical synthe-
sis of CdSe/ZnS core/shell QDs and their optical proper-
ties [14,16]. Here we have surface modified these QDs,
and developed protocols for covalent coupling of these
particles to oligonucleotides. Figure 1(A) shows schemat-
ically the steps occurring during the exchange process on
the QD-surface. The QDs were first transferred to the
water-phase, then surface-ligands (TOPO) were com-
pletely exchanged against MPA. In a second step the MPA
was partially exchanged against the thionylated oligonu-
cleotide, similar to a previously published procedure [15].
Figure 1(B) shows the emission spectra of TOPO capped
QDs and of the corresponding oligonucelotide-deriva-
tized QDs respectively. The maximum of emission was
slightly shifted to the red by about 5 nm from 593 nm to
598 nm during the ligand exchange process. This emis-
sion wavelength shift was observed in all exchange reac-
tions. In accordance with the literature, the red shift was
taken as a hint for the successful ligand exchange [15].
Our QD-oligonucleotide conjugates were colloidally sta-
A) Scheme of the derivatization of the QDs by double ligand exchangeFigure 1
A) Scheme of the derivatization of the QDs by double ligand exchange. Surface TOPO is replaced with MPA fol-
lowed by the partial replacement of the MPA with thionylated oligonucleotides. B) Luminescence spectra of TOPO-QDs (solid
line) and their corresponding oligonucleotide derivatives respectively (dashed line). Original emission-wavelength is slightly
shifted to the red by TOPO replacement. C) TEM-picture of QD-oligonucleotide derivatives. There are no agglomerates
observed after surface modification.
Journal of Nanobiotechnology 2008, 6:7 />Page 4 of 6
(page number not for citation purposes)
ble in water for three weeks at room temperature, before
they started to agglomerate and precipitate. This was prob-
ably due to desorption of the ligands, changes of surface
properties and alteration of charge density and quality.
Figure 1(C) shows a transmission electron microscope
(TEM) micrograph of oligonucleotide modified QDs
directly after ligand exchange. This picture clearly shows
the absence of larger agglomerates and thus proves the
excellent dispersibility of the conjugates.
In situ hybridization using QD-oligonucleotide conjugates
In a first experiment, we used QD-oligonucleotide conju-
gates with an emission-wavelength of 563 nm for in situ
detection of AtPIN1 (At1g73590) mRNA. We used laser
scanning confocal microscopy to monitor the signals in
fixed floral tissue sections. Figure 2(C) shows a tangential
section through an Arabidopsis flower meristem. The
bright green fluorescence corresponds to QD-oligonucle-
otide specific signals, while the red fluorescence visible at
the lower border region corresponds to auto-fluorescence
typically seen in these cells. Figure 2A) and 2B) show the
separated channels. Specific signals are very strong indi-
cating a good signal to noise ratio and specific binding of
the QD-oligonucleotide to the target mRNA and no
apparent binding of the probe to other cellular compo-
nents. Compared to the signals visible in epidermal and
meristematic cells using the same oligonucleotide labeled
with fluorescein, the apparent large size of the QD-oligo-
nucleotide does not modify the hybridization kinetics of
the oligonucleotide with its complementary mRNA. (Fig-
ure 2D–F). mRNA patterns for both probes are well in
agreement with previously reported AtPIN1 mRNA in situ
localization signals [17]. In order to confirm the specifi-
city of the QD-oligonucleotide signal we further per-
formed control experiments using oligonucleotides in
sense orientation which should give no signal. As
expected we did not observe any specific signal for both
fluorescein and QD labeled oligonucleotides. This clearly
shows that our QD-oligonucleotides are usful for biologi-
cal applications and able to specifically hybridize to their
target sequences. QD-oligonucelotides were stable and
could be used repeatedly many times demonstrating the
specificity of the chemical and physical properties of the
QD-oligonucleotides and the robustness our in situ assay
conditions (data not shown).
Generalized approach for multiparametric labeling
Simultaneous detection of several different biomolecules
in the cellular context is essential for addressing many bio-
logical questions. In order to establish multiparametric
analysis of mRNAs, five different oligonucleotides were
covalently linked to QDs with distinguishable emission
wavelengths. The spectral properties of these QD-oligonu-
cleotide conjugates were as expected.
These QD-oligonucleotides were used for in situ hybridi-
zation to detect individual mRNAs in separate in situ
hybridizations as well as by combining all five QD-oligo-
nucleotides in a single in situ hybridization experiment.
Whereas in situ hybridization of each single QD-oligonu-
cleotide resulted in specific signals there was only a blue
emission observed after hybridization of a 1:1:1:1:1 mix-
ture of all five QD-oligonucleotides (Figure 3A).
This blue emission does not correspond to any known
fluorophore present in the experimental setup. Figure 3b
shows the corresponding spectral analysis. After blue-
shifting, the luminescence maximum was found at about
460 nm independent of the initial luminescence of the
QD-label (not shown in Figure 3). It was observed, that
the initial luminescence of the QDs decreased, while the
luminescence peak at around 460 nm increased. In other
words: the luminescence did not shift gradually to the
blue, but "leaped" to the blue. The shapes of the lumines-
cence spectra around 460 nm are similar to those of the
original QDs.
Figure 4 displays TEM micrographs of QD-oligonucle-
otide conjugates before (A) and after (B) hybridization.
The sizes of QDs in both pictures were to be found at
about 3 nm, indicating, that the observed blue shift was
not caused by the reduction in size of the QDs.
A-C) AtPIN1 anti sense oligonucleotide linked to QDFigure 2
A-C) AtPIN1 anti sense oligonucleotide linked to
QD. Specific signal observed in epidermal and meristematic
cells. A) and B) display separated channels. D-F) AtPIN1 anti
sense oligonucleotide linked to fluorescein. Fluorescence is
observed in epidermal and meristematic cells. D) and E)
depict separated channels. AtPIN1 expression for both
probes is in agreement with previously reported AtPIN1
mRNA in situ localization signals [16].
Journal of Nanobiotechnology 2008, 6:7 />Page 5 of 6
(page number not for citation purposes)
The "blue shift" was directly related to the hybridization
process. Figure 3(A) also shows some aggregated (non-
hybiridized) QDs (red), which kept their original lumi-
nescence properties (spectrum depicted in 3 (B)). Further-
more the blue-shift was related to the biological sample
and the region within the sample. Figure 5A to 5C depict
non shifted luminescence of different QD-labels after spe-
cific hybridization to flower (A,C) and leaf tissue (B). Fig-
ure 5(D) shows the blue-shifted emission of the QD-label
found after hybridization in pollen. Remarkably, the
luminescence of non specifically bound QD-oligonucle-
otide conjugates on the surface of the pollen (figure 5D)
was not affected.
The observations reported above rule out the obvious
explanation for blue-shift of QD-emission, namely photo
corrosion. Therefore the blue shift seems to be caused by
an energy-transfer process that is related to hybridization
or by selective quenching of the QD luminescence and
light scattering [18]. So far, it was not possible to explain
this phenomenon fully. Nevertheless, it is an interesting
observation which may pave the way for potential QD-
based in-vivo sensors.
In this paper we report the specific labeling and imaging
of Arabidopsis tissue sections by the use of distinguisha-
ble QD-oligonucleotide conjugates. After hybridization,
regions within the Arabidopsis flower like pistil, leaves or
pollen could be depicted respectively on a cellular level by
LSM. Surprisingly, a strong blue-shift together with a
reduction of luminescence intensity of the initial QD-flu-
orescence was observed. This remarkable blue-shift does
not originate from the oxidative corrosion of QDs as it
appears only after hybridization of coupled QDs. Finally,
the origin of the blue shift could not be clarified within
the presented work. Most likely, the blue-shift is caused by
selective luminescence quenching and light scattering at
hybridized QDs. The discussed blue-shift was not
observed with organic fluorophores. Even though this
TEM-micrograph of QD-oligonucleotides before (A) and after (B) hybridization process respectivelyFigure 4
TEM-micrograph of QD-oligonucleotides before (A)
and after (B) hybridization process respectively. Both
pictures are showing non-agglomerated QDs with a diameter
of around 3 nm. Samples were prepared by immersion and
subsequent drying of carbon-film covered copper grinds in
aqueous dispersions of sample A and B.
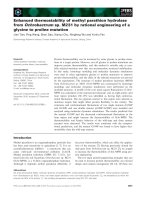
A) LSM-picture of selectively labeled Arabidopsis tissueFigure 3
A) LSM-picture of selectively labeled Arabidopsis tissue. The tissue was hybridized with five different QD-oligonucle-
otides of distinguishable emission wavelength. The emission of QD-labels was shifted to the strong blue. This shift appears only
after hybridization. Unreacted, agglomerated QD-oligonucleotides show their initial emission behavior (red area on the right
border of the picture). B) Spectral analysis of picture A. The wavelength of all hybridized QD-oligonucleotides was shifted to
460 nm. The emission of some non hybridized QD-oligonucleotides could be found at 598 nm.
Publish with BioMed Central and every
scientist can read your work free of charge
"BioMed Central will be the most significant development for
disseminating the results of biomedical research in our lifetime."
Sir Paul Nurse, Cancer Research UK
Your research papers will be:
available free of charge to the entire biomedical community
peer reviewed and published immediately upon acceptance
cited in PubMed and archived on PubMed Central
yours — you keep the copyright
Submit your manuscript here:
/>BioMedcentral
Journal of Nanobiotechnology 2008, 6:7 />Page 6 of 6
(page number not for citation purposes)
effect is not fully understood yet, it might be potentially
interesting for in-vivo molecular imaging, because of its
sensitivity against the biological microenvironment.
Authors' contributions
JR and FD contributed equally to this work. JR prepared
and derivatized the Quantum Dots, FD carried out the
biological experiments. KP and TN conceived of the study,
and participated in its design and coordination. All
authors read and approved the final manuscript.
Acknowledgements
The work was supported by grants from the Alexander von
Humbold Foundation, the FCI, the Landestiftung ("Neue
informatische, bildgebende und mikrotechnische
Werkzeuge zur hochauflösenden Exploration komplexer
biologischer Strukturen") and the European Union
(STREP project LSHB-CT-2006-037639). We also thank
Dr Roland Nitschke at the Freiburg University Life Imag-
ing Centre for advice.
References
1. Bruchez M, Moronne M, Gin P, Weiss S, Alivisatos AP: Semiconduc-
tor nanocrystals as fluorescent biological labels. Science 1998,
281:2013-2016.
2. Warren CWC, Nie S: Quantum dot bioconjugates for ultrasen-
sitive nonisotopic detection. Science 1998, 281:2016-2018.
3. Sun B, Xie W, Yi G, Chen D, Cheng Y, Zhou J: Microminiaturized
immunoassays using quantum dots as fluorescent label by
laser confocal scanning fluorescence detection. J Immunol
Methods 2001, 249:85-89.
4. Jaiswal JK, Mattoussi H, Mauro JM, Simon SM: Long-term multiple
color imaging of live cells using quantum dot bioconjugates.
Nature Biotechnol 2003, 21:47-51.
5. Riegler J, Nick P, Kielmann U, Nann T: Visualizing the Self-Assem-
bly of Tubulin with Luminescent Nanorods. J Nanosci Nanotech
2003, 3:380-385.
6. Goldman ER, Anderson GP, Tran PR, Mattoussi H, Charles PT, Mauro
JM: Conjugation of Luminescent Quantum Dots with Anti-
bodies Using an Engineered Adaptor Protein to Provide
New Reagents for Fluoroimmunoassay. Anal Chem 2002,
74:841-847.
7. Tomaselli M, Yarger J, Bruchez M, Havlin RH, DeGraw D, Pines A,
Alivisatos AP: NMR study of InP quantum dots: Surface struc-
ture and size effects. J Chem Phys 1999, 110:8861-8864.
8. Hanaki K, Momo A, Oku T, Komoto A, Maenosono S, Yamaguchi Y,
Yamamoto K: Semiconductor quantum dot/albumin complex
is a long-life and highly photostable endosome marker. Bio-
chem Biophys Res Commun 2003, 302:496-501.
9. Seydel C: Quantum Dots Get Wet. Science 2003, 300:80-81.
10. Dubertret B, Skourides P, Norris DJ, Noireaus V, Brivanlou AH,
Libchaber A: In vivo imaging of quantum dots encapsulated in
phospholipid micelles. Science 2002, 298:1759-1762.
11. Riegler J, Nann T: Application of luminescent nanocrystals as
labels for biological molecules.
Anal Bioanal Chem 2004,
379:913-919.
12. Rosenthal SJ: Bar-coding biomolecules with fluorescent nanoc-
rystals. Nature Biotechnol 2001, 19:621-622.
13. The Arabidopsis Genome Initaitve: Analysis of the genome
sequence of the flowering plant Arabidopsis thaliana. Nature
2000, 408:796-815.
14. Nann T, Riegler J: Monodisperse CdSe Nanorods at Low Tem-
peratures. Chem Eur J 2002, 8:4791-4795.
15. Mitchell GP, Mirkin CA, Letsinger RL: Programmed Assembly of
DNA Functionalized Quantum Dots. J Am Chem Soc 1999,
121:8122-8123.
16. Hines MA, Guyot-Sionnest P: Synthesis and Characterization of
Strongly Luminescing ZnS-Capped CdSe Nanocrystals. J Phys
Chem 1996, 100:468-471.
17. Reinhardt D, Pescue ER, Stieger P, Mandel T, Baltensperger K, Ben-
nett M, Traas J, Friml J, Kuhlemeier C: Regulation of phyllotaxis
by polar auxin transport. Nature 2003, 426:255-260.
18. Gryczynski Z, Lukomska J, Lakowicz JR, Matveeva EG, Gryczynski I:
Depolarized light scattering from silver nanoparticles. Chem
Phys Lett 2006, 421:189-192.
Several LSM-pictures of Arabidopsis tissues, which were hybridized with distinguishable QD-oligonucleotidesFigure 5
Several LSM-pictures of Arabidopsis tissues, which
were hybridized with distinguishable QD-oligonucle-
otides. In blossom (A, C), and leaf (B) specific hybridization
and labeling took place while in the case of pollen (D) the
QD-emission was strongly shifted after hybridization. The
luminescence of unspecific bounded QD-oligonucleotides on
the surface of the pollen was not shifted.