báo cáo khoa học: "Long-term exposure of CdTe quantum dots on PC12 cellular activity and the determination of optimum non-toxic concentrations for biological use" docx
Bạn đang xem bản rút gọn của tài liệu. Xem và tải ngay bản đầy đủ của tài liệu tại đây (2.78 MB, 16 trang )
RESEA R C H Open Access
Long-term exposure of CdTe quantum dots on
PC12 cellular activity and the determination
of optimum non-toxic concentrations for
biological use
Babu R Prasad
1†
, Natalia Nikolskaya
1
, David Connolly
1
, Terry J Smith
1
, Stephen J Byrne
2*†
, Valérie A Gérard
2
,
Yurii K Gun’ko
2
, Yury Rochev
1*
Abstract
Background: The unique and tuneable photonic properties of Quantum Dots (QDs) have made them potentially
useful tools for imaging biological entities. However, QDs though attract ive diagnostic and therapeutic tools, have
a major disadvantage due to their inherent cytotoxic nature. The cellular interaction, uptake and resultant toxic
influence of CdTe QDs (gelatinised and non-gelatinised Thioglycolic acid (TGA) capped) have been investigated
with pheochromocytoma 12 (PC12) cells. In conjunction to their analysis by confocal microscopy, the QD - cell
interplay was explored as the QD concentrations were varied over extended (up to 72 hours) co-incubation times.
Coupled to this investigation, cell viability, DNA quantification and cell proliferation assays were also performed to
compare and contrast the various factors leading to cell stress and ultimately death.
Results: Thioglycolic acid (TGA) stabilised CdTe QDs (gel and non - gel) were co-incubated with PC12 cells and
investigated as to how their presence influenced cell behaviour and function. Cell morphology was analysed as the
QD concentrations were varied over co-incubations up to 72 hours. The QDs were found to be excellent
fluorophores, illuminating the cytoplasm of the cells and no deleterious effects were witnessed at concentrations
of ~10
-9
M. Three assays were utilised to probe how individual cell functions (viability, DNA quantification and
proliferation) were affected by the presence of the QDs at various concentrations and incubation times. Cell
response was found to not only be concentration dependant but also influenced by the surface environment of
the QDs. Gelatine capping on the surface acts as a ba rrier towards the leaking of toxic atoms, thus reducing the
negative impact of the QDs.
Conclusion: This study has shown that under the correct conditions, QDs can be routinely used for the imaging of
PC12 cells with minimal adverse effects. We have found that PC12 cells are highly susceptible to an increased
concentration range of the QDs, while the gelatine coating acts as a barrier towards enhanced toxicity at higher
QD concentrations.
Background
Semiconductor nanoparticles or Quantum Dots (QDs)
have been widely touted as new replacements for tradi-
tional dyes for the imaging of living cells and tissues.
Due to their extremely small size QDs can, via specific
and non-specific pathways penetrate and label both the
exterior and interior of numerous cell types [1-7]. They
are highly resistant to photobl eaching [2,8-10] and their
broad absorption ranges all ow for their excitation and
multiplexed detection across a wide spectrum of wave-
lengths [11-14].
Minute changes in the radius of QDs manifests as visi-
ble colour changes of the QDs in solution. This property
may lead to their potential use as simultaneous multiple
* Correspondence: ;
† Contributed equally
1
National Centre for Biomedical Engineering Science, National University of
Ireland, Galway, Ireland
2
CRANN and The School of Chemistry, Trinity College Dublin, Dublin 2,
Ireland
Prasad et al. Journal of Nanobiotechnology 2010, 8:7
/>© 2010 Prasad et al; lice nsee BioMe d Central Ltd. This is an Open Access article distributed under the terms of the Creative Commons
Attribution License ( which permits unrestricted use, distribution, and reproduction in
any medium, provided the original work is properly cited.
colour labels [15-17] The difference in size can also
affect their uptake may lead to alterations in cellular
activity and cytotoxicity [18,19].
Our studies are focussed on the analysis of PC12 cells
which have the ability to be differentiated into neurons
upon treatment with nerve growth factors (NGF). The
application of QDs to neuroscience specific fields is cur-
rently emerging [20-25] and various groups have investi-
gated the specific labelling of neurons with QDs. Nerve
growth factors were QD tagged by Vu et al [26], QD
micelles were up taken by rat hippocampal neurons as
shown by Fan et al [27], while various antibody and
peptide labelled QDs have also been explored
[6,20,28-32]. However, a dvances in molecular medicine
require the safe detection of individual biomolecules,
cell components and other biological entities. One sig-
nificant pro blem with QDs is their heavy metal compo-
sition [33-35], which has given genuine cause for
concern due to their potential cytotoxicity [33,35,36]. In
an effort to combat this problem, much research has
been conducted into the mechanisms that result in QDs
actingastoxicagentsonceexposedtoacellularenvir-
onment [37-43] and ways of reducing their toxicological
impact via non-toxic coatings [44].
While QDs ha ve been investigated with a large variety
of cell lines and types; more recently, in search of new
neurotherapeutic and neuroprosthetic strategies, QDs
have been explored to manipulate and create active cel-
lular interfaces with nerve cells [19,20]. However, the
application of such entities to neuron cell imaging is
limited and while QDs have been used for cell labelling
experi ments, little work has been undertaken into mea-
suring the ranges of neuron cell response over long time
scales upon their perturbation by the QDs.
The purpose of the study was to explore the potential
for labelling of undifferentiated Pheochromocytoma 12
(PC12) cells with gelatinised and non-gelatinised TGA
capped CdTe QDs. We have studied serial co-incubations
of 24, 48 and 72 hours and analysed the effect of three fac-
tors namely concentration, co-incubation time and surface
modification in parallel to three assays measuring cell via-
bility, proliferati on and DNA quantification. Altho ugh
shorter incubation periods have been used by some groups
to investigate the toxicity [42,45], long term exposure is
more reliabl e. There are a numb er of studies which have
investigated the toxicity of QDs for 24 hour co-incuba-
tions and demonstrated that increasing concentrations
increase cell toxicity significantly [23,45-48].
Results and Discussion
Optical characteristics
The two types of QDs utilised (gel and non-gel) were
synthesised using a modification of a previously pub-
lished procedure [49]. This synthetic route allows for
the production of highly luminescent and crystalline
CdTe QDs. Briefly, H
2
Te gas was bubbled through an
basic aqueous solution containing Cd(ClO
4
)
2
6H
2
O, thio-
glycolic acid (TGA) stabiliser and dissolved gelatine
where appropriate. The resultant non-lum inescent mix-
ture was heated under reflux. The crude solutions were
purified via size selective precipitation and individual
fractions were characterised by UV-vis absorption and
photoluminescence (PL) emiss ion spectroscopy (l
ex
425
nm). Prior to initiating cell cultur ing experiments, th e
QDs were further purified using sephadex (G25). This
enabled us to remove any residual un-reacted moieties
that may have been present from the original crude
solution. Two differently sized b atches of QDs (for both
gel and non-gel QDs) were synthesised to allow us to
investigate if the additional parameter of QD size had
any impact on cell r esponse. Figure 1 shows the typical
absorption and emission profiles indicative of aqueous
CdTe QDs. As there are no differences in the spectral
characteristics of gel and non-gel QDs, one spectrum
indicative of each size is shown for clarity.
ThespectrashowninFigure1highlightthewell
resolved emission and absorption characteristics of the
QDs. Narrow emission spectra (<40 nm full with half
maxi mum [FWHM]) indicate <5% particle size distribu-
tions throughout. Gelatine was introduced during the
synthesis of the QDs and its presence while altering QD
growth rates and QYs [44], does not significantly alter
the size distribution of the QDs and acts primarily as a
co-capping agent.
Quantum yields (QYs) for the solutions (measured
against Rhodamine 6G) were ~25% f or the non-gel and
~35% for the gel QDs. As the presence of uncapped sur-
face atoms provides alternate pathways for the non-
radiative recombination of photons, the difference in
QYs indicate the highly effective capping qualities of the
gelatine.
To examine the quantity of gela tine on the QD sur-
face we analysed the QDs using thermogravimetric ana-
lysis(TGA).Thisprocessinvolvesburningthesample
to be examined and measuring the weight loss against
temperature (Figure 2).
For TGA experiments, each sample was first dried and
subsequently weighed. The sample was then heated
(from 30 to 900°C at a rate of 10°C/min) and as each
component was burned off, the weight changes were
recorded. For both types of QDs several steps can be
seen. The initial drop in weight is due to the removal of
water molecules. Following on, we can now see the
weigh t loss due to the removal of the organic molecules
from the QD surface. We can see a clear difference in
the profiles of the two QD types. The gel QDs show an
additional weight loss (~10%) at ~500°C compared to
the non-gel QDs thus indicating the presence of excess
Prasad et al. Journal of Nanobiotechnology 2010, 8:7
/>Page 2 of 16
organi c groups that we are attributing the gelatine coat-
ing. We have also analysed the behaviour of gelatine
under the same conditions as an additional guide.
High resolution transmission electron microscope
(HRTEM) images were taken to examine the structure
and morphology of the two differently sized t ypes of
QDs (Figure 3).
HRTEM images of the different sized QDs show the
highly crystalline nature of both the gel and non-gel QDs
(Figure 3). Lattice spacings are in agreement with those
expected for the (111) plane of cubic zinc blend CdTe
[50].Wehavepreviouslyshownthatalthoughthepre-
sence of gelatine during the synthesis of the QDs can
influence the rate of QD growth and QY [44], it does not
Figure 1 Absorptio n and e mission spectra. UV-vis absorption and fluorescence emission spectra (l
em
450 nm) of the differently sized
(~2.5 nm - solid line & ~4.5 nm - dashed line) QDs synthesised and co-incubated with the PC12 cells.
Figure 2 Thermogravimetric analysis. Graph showing the percentage weight loss for the QD and gelatine samples upon heating to 900°C.
Prasad et al. Journal of Nanobiotechnology 2010, 8:7
/>Page 3 of 16
seem to alter the physical structure of the QDs. Conse-
quently, as can be seen from the resulting QY’s, the gela-
tine must act solely as a co-capping agent for the
protection of the QD surface and the reduction of non-
radiative transitions. The incorporation of gelatine during
the QD synthesis result s in small er QDs being produced
under the same conditions compared to non-gel QDs but
doesnotseemtoalterorinfluence the size distribution
with the particle ensemble. Following size selective purifi-
cation, size distributions for spe ctroscopically similar gel
and non gel samples were comparable with the only
noticeable difference being their respective QYs.
The influence of this additional exterior coating upon
uptake and any induced toxicity were some of the prop-
erties we wished to explore with the PC12 cells.
We have also conducted a number of experiments in
an effort to empirically relate the actual mass (mg of
QDs per ml) of the QDs used in solution to their deter-
mined concentration [17]. (note: QDs treated as indivi-
dual molecules for the purpose of concentration
determination). Several different batches of gel and non-
gel QDs were dried under rotary eva poration. A m ea-
suredamountoftheresultingQDpowderwasthen
weighed and dissolved in exactly 1 ml of purified wate r.
The molar concentration was then determined for each
individual batch [17]. Figure 4 illustrates the relationship
between QD weight and molar concentration (M) for
our QDs used.
As expected there is a linear relation ship between
measur ed QD concentration and powdered weight. This
Figure 3 HRTEM QD characterisation. HRTEM images of (A) non-gel (~2.5 nm) and (B) gel (~4.5 nm) capped CdTe QDs. (Inserts are blown up
images of highlight QDs).
Figure 4 QD weight versus concentration profile. Graphs illustrating the relationship between measured QD concentration and QD
powdered weight (A) and QD powdered weight/size (B).
Prasad et al. Journal of Nanobiotechnology 2010, 8:7
/>Page 4 of 16
allows us to postulate as to the concentration (mg/ml)
of QDs that we have used throug hout our experimental
analysis. We have also included a plot of concentration
against weight/size, to give a fuller empirical relationship
for the system under investigation. It must be noted that
as the QDs are dried from solution (although fully puri-
fied), there i s the possibility that QD degradation may
occur which increases the experimental error with
regards to concentration, but overall it does giv e us a
good general indication.
To investigate any possi ble degradation of the QDs
without the presence of the PC12 cells, we carried out a
number of experiments to analyse the effect of co-incu-
bating the QDs with only the cell culture medium
(Figure 5 and 6).
Figures 5 and 6 show the evolution of th e UV-vis
absorption and PL emission (l
ex
480 nm) spectra of
non-gel and gel QDs respectively in cell culture med-
ium over time. The unusual shape of the UV spectra is
due to the interference caused by the culture medium.
This was used as a background throughout but its
effect could not be completely removed. For the gel
QDs at 0 hours, the UV spectrum is as expected but
as the incubation times increased, the effect of the
medium became apparent. Most importantly however,
the UV spectra of both QD types remain consistent
and do not drop even after 72 h ours. This indicates
that the core structures of the QDs remain intact and
that no significant degradation to the QDs themselves
is occurring. If degradation were occurring, the base-
line would rise as the QD begin to precipitate from
solution and the absorbance and structure of the spec-
trum would decrease significantly. This core stability is
further corroborated by the PL spectra which show an
initial drop after 48 hours, but stability thereafter. This
quenching of the emission properties of the QDs is
common when recorded in the presence of biological
media.
Previously, we have investigate d the effect of QD and
protein charge on QD spectra and cellular interactive
characteristics [51]. As the medium contains serum,
these spectral changes can be attributed to the interac-
tion of the various proteins present with the QD surface.
These interactions do not lead to the degradation of the
QDs, but do provide alternate pathways for radiative
recombination, thus resulting in lower fluorescence
intensities. If the QDs begin to degrade following cellu-
lar uptake, resulting in leeching of the core atoms; it
must be attributable to the harsh intracellular conditions
that the QDs face within the cytoplasm.
Our next aim was to analyse the effect of the QDs on
cell behaviour and morphology also to then investigate
any alterations to cell proliferation, viability and DNA
quantification using pre-determined assays over
extended co-incubation times.
1. Uptake of QDs and their effect on cell morphology
Stock gel and non-gel QD solutions (10
-4
M) [17] were
diluted to a range of concent rations (10
(-7)-(-9)
M) and
Figure 5 QD interactions with cell culture medium. Evolution of UV-vis absorption and PL emission spectra (l
exc
480 nm) of non-gel QDs in
cell culture medium over time.
Prasad et al. Journal of Nanobiotechnology 2010, 8:7
/>Page 5 of 16
incubated with the cells as described in the experimental
section. Confocal images were taken to visually inspect
QD uptake, localisation and cell morphology following
incubation (Figures 7, 8, 9).
Figure 7, panels A and B show PC12 cells following 72
hours of co-incubation with 10
-7
Mand10
-9
M concen-
trations of QDs respectively. In panel A, the cells were
seen to be rounded and floating in the nutrient rich
medium. This cont rasts the m orphology of the cells in
panel B and the control cells (panel C), which were
attached to the culture plate and polygonal in shape. It
can be noted that as QD concentrations were reduced,
the effect on the cell morphology w as eliminated and
the cells were morphologically identical to the control
cells (Figure 7, panels B and C). Although some earlier
studies [23,48] hav e shown similar concentration depen-
dence, there is no study investigating the effect on cell
morphology at the extended time periods of 48 and 72
hours [45]. G reen fluorescence in the PC12 cells is due
to QDs localisation in the cytoplasm.
Figure 8 s hows the f luorescent image (panel A) and
overlaid corresponding differential interference contrast
(DIC) image (panel B) of the PC12 cells treated with a
10
-9
M concentration of QDs following 72 hours of co-
incubation. The QDs are found to be located within the
cytoplasm of PC12 cells.
Figure 6 QD interactions wit h cell culture medium. Evolution of UV-vis absorption and PL emission spectra (l
exc
480 nm) of gel QDs in cell
culture medium over time.
Figure 7 Confocal image. Fluorescent confocal image and corresponding differential interference contrast (DIC) images of PC12 c ells
exposed to a 10
-7
M concentration of QDs (A), 10
-9
M concentration of QDs (B) and a control sample with no QDs (C) following 72 hours of
co-incubation. Scale bar = 50 μm.
Prasad et al. Journal of Nanobiotechnology 2010, 8:7
/>Page 6 of 16
To enhance visualization, the nucleus and cellular
membrane have been actin stained with blue and red
colour respectively (Figure 9). The QDs (green lumines-
cence) are visualized predominantly in the cytoplasm
and their presence even after a 72 hour co-incubation in
this region, does not seem to significantly perturb the
cells. The cell morphology does not change when evalu-
ated against the controls.
These initial observations illustrate the effect of chan-
ging QD concen tration on cell survival and morphology
and to further investigate cell behaviour, several assays
were used to study the effect on cell proliferation,
growth and metabolic activity.
2. Effect of QDs on cellular activity
The consequence of co-incubating classical molecules
on the cell viability can be reliably predicted using single
assays [52], however, the dynamics of nanomaterial s are
not as comprehensively understo od and hence drawing
conclusions from single cell viability assays can be mis-
leading. As such additional assays are required to give a
more comprehensive analysis when determining nano-
particle toxicity for risk assessment [52].
Consequently, alamarBlue (metabolic activity), Pico-
Green (total DNA quantification) and ELISA BrdU (col-
orimetric assay f or quantification of proliferating DNA)
assays were run to analyse the effect of different QD
concentrations, type and size f ollowing 24, 48 and 72
hour co-incubations with the PC12 cells.
The red/orange labels serve to differentiate the various
QDsbysize[~2.5nm(orange)and~4.5nm(red)]and
were used to investigate if the measured cell r esponses
were in any way size dependant. The gel/non-gel label
refers to the presence of gelatine during the synthesis of
theQDandthesedifferentQDswereanalysedto
Figure 8 Confocal Image. Fluorescent confocal imageofPC12cellsexposedtoa10
-9
M concentration of QDs (A) and corresponding
differential interference contrast (DIC) image (B) with A overlaid following 72 hours of co-incubation [scale bar = 20 μm].
Figure 9 Confoc al images. Fluorescent confocal images to illustrate the morphology of the actin stained PC12 cells with no QDs (A) as a
control and PC12 cells exposed to the QDs (B) [conc. 10
-9
M] following 72 hours of co-incubation. [Scale bar = 20 μm].
Prasad et al. Journal of Nanobiotechnology 2010, 8:7
/>Page 7 of 16
investigate the influence that gelatine imparts on the
QD induced cell toxicity.
The changes in luminescence intensity measured i n
response to the introduction of QDs to the cell cultures
throughout all of our experiments can b e solely attribu-
ted to direct interactions of the staining dyes upon
entering the cells. Energy transfer to the dyes can be
ruled out via a number of routes. Firstly, the dyes and
QDs enter different regions of the cells and as such can-
not interact directly on the scale required for FRET or
other energy transf er phenomena. Secondly, the inten-
sity (arbitrary units) of the dye emission is of the order
of ~10
3
while the QDs display ~10
2
.Thus,anyenergy
transferred to the dye would be of an order of magni-
tude lower and would have a minimal effect on the
emission intensity. Negative and backgrou nd controls in
our experiments also substantiate this fact.
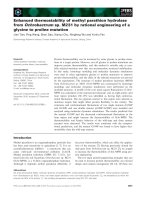
2.1 AlamarBlue Assay
Viability of the PC12 cells, for different concentrations,
sizes and types of QDs was investiga ted with an alamar-
Blue assay and the results graphed in Figure 10. This is
a non-destructive assay and allows for the cells to be
further utilised following analysis.
The graph shown in Figure 10 illustrates the alamar-
Blue response (percentage of reduced alamarBlue) for
the PC12 cells following 24, 48 and 72 hour co-incuba-
tions with the QDs.
As seen in Figure 10, at 10
-7
M QD concentrations
the toxicity is extremely high at all incubation times,
and approached the levels of negative controls after only
48 hours. We can see the influence of the gelatine coat-
ing up to 24 hours as cell viability responses are signifi-
cantly higher for the gel QDs compared to their non-gel
counterparts. Notably, all responses are lower than t he
controls indicating that at this concentration the pre-
sence of any foreign entities generate a detrimental
environment for the cells and result in high levels of cell
death.
At 10
-8
M QD concentrations, we can now see a shift
with respect to viability response. Initially after 24
hours, responses are comparable (note: orange non-gel
QDs do show a slightly decreased response) between
QD types and also to con trols. This indica tes that over
this short incubation period, the cells are not signifi-
cantly perturbed by the QDs at this concentration.
At 48 and 72 hours, the cell responses now mimic
those seen for 10
-7
M concentrations and have dropped
in comparison to controls; however, signific ant differ-
ences are noted between the two QD types. Responses
for the gel QDs are considerably higher than those of
Figure 10 AlamarBlue histograms. AlamarBlue assay at 24, 48 and 72 hours showing the viability of PC 12 cells after treatment with varying
concentrations [10[[(-7)-(-9)] M] of the gel and non-gel QDs. From left to right, controls [positive, negative, background] are also shown.
§denotes examples of statistical significance due to effect of gelatine, * denotes examples of statistical significance due to effect of
concentration using a one- way ANOVA (p < 0.05) by Tukey’s mean comparison.
Prasad et al. Journal of Nanobiotechnology 2010, 8:7
/>Page 8 of 16
the non-gel QDs and of note; the red QDs (whether gel
or non-gel) are seemingly less toxic than the smaller
orange QDs. This may be att ributed to the fact that
smaller QDs have been shown to penetrate further into
cells than their larger counterparts. As nuclear pores are
very small [ 45], nuclear staining of small “green” QDs
and cytoplasmic localisation of larger “red” has demon-
strated the size dependan t nature of QD uptake [53].
Consequently, the smaller QDs may initiate deleterious
cell reactions at far quicker rates than the larger ones.
Analysis of these responses at 48 and 72 hours rein-
force the importance of the QD surface environment
and the protective nature of the gelatine at this concen-
tration. While the surface gelatine coating helps to
reduce the t oxicological impact of the QDs at 10
-8
M
concentrations, at 10
-9
Mweseetheleastamountof
differences between QD types. Unlike previous concen-
trations, where alamarBlue responses decrease when
comparing gel and non-gel QDs up to 72 hour s, there is
a certain amount of consistency when analysing the co-
incubated QDs at 10
-9
M concentrations. There are no
significant changes in cell response, across the total
incubation period. We can also see that final 72 hour
cell responses are actually comparable to those recorded
for gel QDs at 10
-8
M. Throughout; all QDs types elicit
responses below the levels of negative controls, however
responses for gel Q Ds are far higher than non-gel QDs,
indicating that even though their presence results in a
certain level of toxicity, they are far less detrimental
than their non-gel counterparts. As QDs are essentially
a combination of toxic materials, their negative impact
on cell health is to be expected, however as cell
response seems to level off we can postulate as to the
reasons for the induced QD toxicity.
The PC12s themselves can react to the presence of a
foreign object, which may be the reason that ov erall QD
cell responses are lower than the controls even after
only 24 hours at low (10
-9
M) concentrations. From our
data it is also notable that at 10
-9
M QD concentrations,
the protective effect of gelatine coating was not obvious,
with the sole exception of orange QDs at 24 hours.
Thus, it can be argued that increases i n cell viability at
lower QD concentrations make it difficult for the pro-
tective effect of gelatine to be seen. CdTe QDs exert
cytotoxicity characterised by decreases in the metabolic
activity. The most common pathways involved in the
toxicity of QDs are related to Reactive Oxygen Species
(ROS). These free radicals act by activating different
apoptotic pathways such as caspase-9-, caspase-3 and
JNK [54]. Some studies have shown involvement of
MAPK pathways via over-expression of TNF-a CxCl8
[55] or AP-1 and PTK pathways mediated by MMP2
and 9 over-expression [56]. Although there are differ ent
pathways involved, there is no obvious predilection for
particular pathways in a particular cell line. A recent
study with PC-12 cells has also shown involvement of
reactive oxygen species (ROS) [45], where the authors
have shown interactions of QDs with sub-cellular com-
ponents and the detrimental effect of uncappe d versus
capped QDs [40]. This may indicate that the concentra-
tion of the leached atoms or reactive oxygen species
even from non-gel Q Ds is so low at 10
-9
M as to mini-
mally impact the cells beyond the to xicity induced by
their very presence.
Throughout the assay, we can see a progressive
increase in cell viability for gel compared to non-gel
QDs, indicating that the gelatine must act as an effective
barrie r towards these processes occurring. While it does
not prevent the resulting negative impact on the cells,
the gelatine seems to effectively slow down the adverse
effects of the QDs on cell viability, allowing for longer
cell survival, thus enhancing imaging and analysis over
elongated co-incubation times.
These results have been focussed on cell respiratory
responses. Our next objective was to find out if the impact
of the QDs remains the same for other cellular activities.
2.2 PicoGreen Assay
PicoGreen kit Quant-iT™ dsDNA High-Sen sitivity Assay
Kit (Invitrogen) was used to quantify the amount of
double stranded (ds) DNA in ng/μl.
ThegraphshowninFigure11illustratesthetotal
amount of DNA present (ng/μl) in live P C12 cells after
24, 48 and 72 hours of co-incubation with both the gel
and non-gel QDs . This assay allows us to directly relate
the impact of the QDs on the overall cell population.
At 10
-7
M QD concentrations, the histograms for the
two QD types trend somew hat similarly to those seen
for alamarBlue. Once again, respon ses never reach that
of the control samples indicating the negative effect that
the QDs have on this system. However, higher responses
are once again recorde d for the gel QDs after 24 hours
and unlike the alamarBlue assay, the gel QDs show sig-
nificantly higher results after 48 hours compared to the
non-gel QDs. As before after 72 ho urs, both QD types
elicit response similar to negative controls.
These data indicate that this assay seems to be more
robust than the alamarBlue. This is an extremely sensi-
tive assay to DNA concentrations and unlike the
responses seen previously; there is an apparent shift in
cell survival to longer co-incubation times. For exampl e,
responses for gel and non-gel QDs were comparable
after only 48 hours with alamarBlue, while for Pico-
Green this now occurs at 72 hours and this apparent
shift continues as the concentrations are reduced.
As the QD concentrations are reduced to 10
-8
M, we
can see that after 24 hours DNA responses are
approaching comparability with positive controls. Small
differences once again favouring the gel QDs can be
Prasad et al. Journal of Nanobiotechnology 2010, 8:7
/>Page 9 of 16
seen and these continue up to 48 hours. Notably, as
recorded before, the orange non-gel QDs begin to show
the lowest response indicating their increased impact on
cell survival.
Only at 72 hours do we see responses drop below
positive controls and signi ficant differences can be seen
between the two QD types with once again the gel QDs
producing higher responses. Thus, comparing the two
assays at this 10
-8
MQDconcentration,theshiftto
longer co-incubation times is clear indicating of
increased cell s urvival rates and their ability to replicate
for longer even in the presence of these toxic entities.
Similarly to the alam arBlue, there is a sense of co nsis-
tency throughout the PicoGreen assay over all time
points at 10
-9
M QD concentrations. DNA responses
are comparable to positive controls and do not drop sig-
nificantly even after 72 hours of co-incubation. This
highlights the robustness of this cellular process to toxic
influences at this concentration and also emphasizes the
hormetic effect [2,57].
These results further corroborate those from the ala-
marBlueassayverifyingthatthenatureoftheQDsur-
face (gel or non-gel) greatly influences their behaviour
and the resulting viability of the cells.
The QD surface must be protected from the harsh
intracellular environment if the cells are going to survive
long enough to enable useful information about their
behav iour and response to be gathered. The presen ce of
gelatine on the QD surface clearly helps to reduce the
impact of low intra-cellular pH ranges and the interac-
tions of the various proteins present from breaking
down the surface structure and releasing the “naked”
toxic core atoms. Overall however the gelatine helps to
nullifythetoxiceffectsinducedbytheQDs;however
the localisation of the QDs and their f inal destination
must also play a role as there are variations in the
impact that the different QD sizes and types have on
each distinct cell response. This is quite significant and
will require further investigation to fully determine and
understand how changes in QD type, structure, s urface
functionality and concentration may impinge on the var-
ious cellular processes that occur during co-incubation.
2.3 Proliferation ELISA BrdU
A Colorimetric Immunoassay was measured for the
quantification of cell proliferation. This was based on
the measurement of BrdU incorporation during DNA
synthesis for the PC12 cells treated with different con-
centrations of gel and non-gel QDs. This cell
Figure 11 PicoGreen histograms. PicoGreen assay at 24, 48 and 72 hours illustrating the amount of DNA (ng/μl) measured from PC12 neurons
following co-incubation with varying concentrations 10
-7-(-9)
M of the gel and non-gel QDs. From left to right, controls [positive, negative,
background] are also shown. §denotes examples of statistical significance due to effect of gelatine, * denotes examples of statistical significance
due to effect of concentration using a one- way ANOVA (p < 0.05) by Tukey’s mean comparison.
Prasad et al. Journal of Nanobiotechnology 2010, 8:7
/>Page 10 of 16
proliferation allows us to extrapolate the healthy nature
of the cells following co-incubation times of up to 72
hours. This assay is somewhat different from those pre-
viously examined as those cellular processes may still
occur in cells that are not proliferating.
Figure 12 illustrates t he measured response for cell
proliferation upon co-incubation with the QDs after 24,
48 and 72 hours. Notably, negative and background con-
trol responses are significantly higher than those seen
for alamarBlue and PicoGreen.
Initially after 24 hours at 10
-7
M QD concentrations,
we can see a distinction between the less toxic gel and
non-gel QDs however this levels off approaching nega-
tive controls at 48 and 72 hours. As the concentration
drops to 10
-8
M, we can once again see the significant
influence of the gelatine capping. At 24 and 48 hours
the non-gel QDs are substantially more toxic approach-
ing negative controls, while gel QDs maintain parity
with positive controls. Little distinction is recorded at
72 hours illustrating the negative impact that prolonged
co-incubation with the QDs has on cell proliferation at
this concentration.
Similarly to previous assays, l ittle distinction can be
made between QD types as the concentration is reduced
to 10
-9
M. After 24 hours, all QDs elicit responses in
line with positive controls whil e after 48 and 72 hours,
the red gel QDs once again showed the least detrimental
effect on cell responses. Overall we can see a general
trend towards a drop in cell proliferation with incuba-
tion time and the drop in responses for positive controls
highlights the delicate nature of maintaining cell prolif-
eration over extended co-incubation times. This also
illustrates the extremely sensitive nature of this assay to
external perturbation. Even though cell activity
decreased during this assay application the results do
show a similarity to th ose previously determined, albeit
on a reduced scale.
Conclusion
In conclusion, we have co-incubated and analysed PC12
cells over extended incubation times (up to 72 hours)
with both gelatinised (gel) and non-gelatinised (non-gel)
thioglycolic acid capped CdTe QDs. We have visually
inspected QD localisation, cell morphology and beha-
viour at a range of QD concentrations (10
-7
-10
-9
M).
ThepresenceoftheQDsat10
-7
M resulted in the
death of all c ells while at concentrations of 10
-9
M, the
QDs were up taken primarily in the cytoplasm of the
PC12s and did not initiate any detrimental effects.
The presence of gelatine on the QD surface was inves-
tigated by thermogravimetric analysis (TGA) which
shows an additional 10% weight loss for the gel com-
pared to non-gel QDs. Experiments c onducted on the
possible degradation of theQDsinthecellculture
Figure 12 ELISA BrdU histograms. ELISA BrdU assay at 24, 48 and 72 hours illustrating (by intensity of absorption at 450 nm) the amount of
cell proliferation following co-incubation with varying concentrations 10
-7-(-9)
M of the gel and non-gel QDs. From left to right, controls [positive,
negative, background] are also shown. §denotes examples of statistical significance due to effect of gelatine, * denotes examples of statistical
significance due to effect of concentration using a one- way ANOVA (p < 0.05) by Tukey’s mean comparison.
Prasad et al. Journal of Nanobiotechnology 2010, 8:7
/>Page 11 of 16
medium with serum have shown that quenching of the
QD emission properties does occur due to protein-QD
surface interactions. This d oes not induce a breakdown
of the QD cores however, and i ndicates that any possi-
ble leeching of toxic core atoms must be induced by the
internalisation of the QDs into the PC12 cells. We have
also conducted experiments to enable us to e mpirically
relate measured QD concentration to the actual weighed
quantity of QDs present in mg/ml.
Utilising alamarBlue (cell viability) and Picogreen
(DNA quantification) and ELISA BrdU (quantification of
cell proliferation) assays we have measured and analysed
cell response to co-incubations up to 72 hours with
both gel and non-gel QDs. We have noted that through-
out all our experiments, cell response varied in propor-
tion to QD size, composition and concentration.
QD size significantly impacted measured responses.
For the alamarBlue and PicoGreen assays at 10
-7
&
-8
M
QD concentrations, the orange non-gel QDs consistently
produced lower ce ll responses. This indicates that the
increased cellular penetration of these smaller QDs
resulted in enhanced adverse effects compared to their
larger red counterparts. Notably, these effects were sig-
nificantly nullified by the gelatine coating with similarly
sized gel QDs producing higher response throughout.
Increased QD concentrations also lead to a decrease
in all measured cell responses. Notably however, it is
evident at all time points that the gelatine coating has a
protective effect as cell viability and survival rates are
significantly higher for gel compared to non-gel QDs.
Elongat ion of co-incub ation times (up to 72 hours) also
highlighted the importance and the significance of the
gelatine for QD surface protection. The assays have
shown that the gel QDs were consistently less toxic
than their non-coated counterparts at concentrations up
to 10
-9
M. The presence of gelatine enables enhanced
cell survival and proliferation at 10
-8
M compared to
non-gel QDs, while its influence is negated at 10
-9
M
concentrations over the longer co-incubation times.
Thus, the 10
-8
M QD concentration appears to act as a
threshold for the initiation of deleterious effects. At 10
-9
M concentrations, there appears to be a transition
between the influences of QD surface s tructure (gel or
non-gel) and QD concentration. The protective nature
of the gelatine is countered by the drop in QD concen-
tration and little variance was noted between the two
QD types indic ating that at this concentration the cells
were unperturbed by the presence of either QD type.
Materials and methods
Chemicals and Reagents
PC12 cells (c ancer cell line derived from a pheochromo-
cytoma of the rat adrenal medulla) were used for this
study. Dulbecco’ s Modification of Eagle Medium
(DMEM) (Sigma-Aldrich) supplemented with 10% heat
inactivated horse serum, 5% fetal bovine serum, 1%
penicillin-streptomycin and, Trypsin-EDTA solution and
all chemicals for QD synthesis were purchased from
Sigma-Aldrich. Al
2
Te
3
was purchased from Cerac Inc.
AlamarBlue was purchased from Biosource Interna-
tional. A BrdU cell proliferation kit was purchased from
Roche Diagnostics. Quant-iT PicoGreen DNA assay kit
was obtained from Invitrogen. Permonax four-well
chamber slide (Lab-Tek, Nalge Nunc International),
Rhodamine-Phalloidin [Molecular Probes (Invitrogen)],
DAPI (Vector Laboratories), Nunc tissue culture- trea-
ted 48-well plates were purchased from Biosciences and
96-well tissue culture plates were purchased from
Sarstedt.
Quantum Dot Synthesis
Note: all values denoted are initial concentrations and
follows previously published procedures [49,58]. Milli-
pore water (150 ml) was degassed by bubbling argon for
approximately 1 hour. Cd(ClO
4
)
2
6H
2
O(3.22g,[7.68
mmol]), TGA (thioglycolic acid) stabiliser (1.24 g, [13.46
mmol], 1.75 molar equivalents) was added and the pH
was adjusted to 11.2-11.3 by the addition of a 2 M NaOH
solution. For samples containing gelatine, 0.3 g was dis-
solv ed in 10 ml w ater by heating gently and added to the
reaction mixture. H
2
Te gas, generated from Al
2
Te
3
(0.56
g, [0.128 mmol]) via drop-wise addition of a 0.5 M
H
2
SO
4
solution was bub bled through the cadmium/thiol
solution under a slow argon flow for approximately 10
minutes. Note: 100% reaction and carryover is assumed,
and cadmium is always in exce ss for this experiment.
The resultant, non-luminescent solution was then heated
to reflux. Following the reflux process, fractions were
precipitated via the addition of isopr opanol and were
stored at 4°C. The concentration of stock solutions used
was approximately 2 × 10
-4
M[17]andweredilutedby
dissolving in de-ionised sterile water.
A Shimadzu UV-1601 UV - Visib le Spectrophot-
ometer was used to measure QD absorption while a
Varian - Cary Eclipse Fluorescence Spectrophotometer
was used to determine th e fluorescence emission/photo-
luminescence (PL) spectra of QDs. A JEOL 3011 High
Resolution Transmission Electron Microscope (HTREM)
was used to image the QDs.
Relating QD mass to concentration
Different batches of both gel and non-gel QDs were
individually dried under rotary evaporation. The r esult-
ing powder was scraped from the flask and weighed
before being re-dissolved in exactly 1 ml of purif ied
water. The concentration was then determined [17],
thus giving a relationship between QD molar concentra-
tion and the mass of QDs (mg/ml).
Prasad et al. Journal of Nanobiotechnology 2010, 8:7
/>Page 12 of 16
Investigation of QDs in medium
Gel and non-gel QDs were diluted in cell culture med-
ium to a final concentration of 10
-6
M. UV-Vis absorp-
tion and PL emission spectra were recorded at various
time points up to 72 hours after addition.
Thermogravimetric Analysis (TGA)
Samples of QDs (gel and non-gel) were dried on a
rotary evaporator. The resulting powder was analysed by
thermal gravimetric analysis on a Perkin Elmer Pyrus 1
instrument: it was h eated from 30 to 900°C at a rate of
10°C/min and its weight was recorded continuously.
The gelatine powder was also analysed.
Cell Culture
PC12 cells, were cultured in medium (DMEM supple-
mented with 10% heat inactivated horse serum, 5% fetal
bovine serum, 1% penicillin-streptomycin) @ 37°C and a
5% CO
2
atmosphere. All the tissue culture plates and
chamber slides were treated with 0.001% P oly-L-Lysine
(PLL) for 24 hours.
Cell Staining
Cells were seeded into four-well chambers at density of
10
5
cells/cm
2
. After 24 hours QDs were added (10% of
amount of Medium) to make final concentrations in the
range of 10
(-7)-(-9)
M and the cells were incubated for dif-
ferent time periods from 24 - 72 hours. Cells were grown
on 4 well Permonax Chamber slides in the pre sence of
QDs. After the desired length of exposure, medium was
removed and the coverslips were washed with 1% phos-
phate-buffered saline (BSA/PBS). C ells were fixed with
4% paraformaldehyde for 15 minutes and then washed 3
times with PBS. Then cells were permeabilized with per-
meabilizing solution (5 min, 0°C). Actin fil aments of
cytoplasm were l abelled with Rhodamine Phalloidin
(Molecular Probes (Invitrogen), at a 1:200 dilution with
PBS for 15 minutes and again washed 3 times with PBS.
Nuclei were labelled with Vectashield mounting medium
with DAPI to preserve fluorescence and counter stained
DNA with DAPI 1 μg/ml.
Confocal Microscopy
An LSM 510 (Carl Zeiss, Jena, Germany) Confocal Laser
Scanning microscope wa s used to examine QDs inside
PC12 cells and its morphology.
Cell Imaging was carried out using a LSM 510
Inverted Confocal Microscope which is equipped with
the following excitation lasers: (a) Argon Laser Excita-
tion -wavelengths (l
Ex
) = 458 nm, 488 nm, 514 nm, (b)
HeNe1 - l
Ex
= 543 nm, (c) HeNe1 - l
Ex
= 633 nm a nd
(d) Titanium Sapphire Tuneable Two-photon Laser
tuneable from 710 nm to 1000 nm with a resulting exci-
tation range of 355 nm to 500 nm.
Confocal laser scanning was carried out at laser scan
speed of 7 with the Photomultiplier Tube settings
adjusted to eliminate noise and saturation with the aid
of the range indica tor setting in the LSM 510 sof tware.
For image optimisation scan avera ging was carried out
on 8 scans per image.
Sequential acquisition was used to acquire the two
colour images of the QDs in cells. For visualisation o f
the QDs, the samples were excited with the Argon 514
nm Laser and the microscope configuration was set up
to capture the emitted fluorescence at 550 nm or 600
nm as desired. Differential Interference Contrast (DIC)
or Nomarski Microscopy was used to visualise the cell
morphology, and was carried out by using the HeNe1
488 nm laser with the Transmission Channel Detector
selected and the DIC polariser and Nomarski prisms
engaged. The two images were then over laid using the
LSM 510 software.
Sequential acquisition was also used to acquire three
colour images. Rhodamine phalloidin was excited using
the HeNe1 543 nm laser and the emitted fluorescence
was acquired at 575 nm. DAPI stain was excited with
laser light at 390 nm (from the two photon laser tuned
to 780 nm) and emitted fluorescence was acquired at
458 nm. The three separate images were over laid using
the LSM510 software to make up the three colour
images.
AlamarBlue Assay
During cellular respiration, mitochondria take in oxygen
and release CO
2
. During this process alamarBlue is sub-
stituted for molecular oxygen in the electron transfer
chain and consequently becomes reduced. This reduc-
tion results i n a change in both the colour and also the
absorbance of the dye. These changes can be measured
and are directly quantifiable against the number of
healthy respiring cells present.
PC12 cells were seeded in 48-well micro-plates (Nunc)
as triplicates. After 24 h, QDs were added (10% of
amount of Me dium) to make final concentrations in the
range of 10
(-7)-(-9)
M. Three different types o f controls,
namely: positive, negative and background were used
throughout the study. Positive controls had cells with
culture medium but without treatment with QDs. Nega-
tive controls were treated with QDs wit h culture me d-
ium and no cells. Background controls were cells
treated with QDs but without culture medium. After 24
hours of treatment with QDs, the medium was removed
and the wells were washed with HBSS. AlamarBlue solu-
tion was prepared by adding alamarBlue (Biosciences
UK) and HBSS in the ratio of 1:10. 200 μl of alamarBlue
solution was added to each well and the plates were
incubated for 1 hour. 100 μl of reduced alamarBlue
solution from each well was dispensed in a clear tissue
Prasad et al. Journal of Nanobiotechnology 2010, 8:7
/>Page 13 of 16
culture 96 well plate. The Plate was analysed using a
Wallac Victor Fluorescent Plate Reader. Absorbance was
measured at lower wavelength of 550 nm and higher
wavelength of 595 nm with a measurement time of 5.0
s. This was repeated with incubation periods of 48
hours and 72 hours.
PicoGreen Assay
PicoGreen is a fluorescent stain that is highly selective
for solubilised double-stranded DNA and i s an extre-
mely sensitive technique capable of nanogram DNA
quantification. Unlike the non-destructive alamarBlue
assay, a PicoGreen assay involve s the freeze-thaw lysing
of cells to analyse the quantity of dsDNA present. As
the cells are washed to remove any dead cells before
analysis, the assay only measures the DNA response
from live healthy cells, thus allowing us to directly relate
how the QDs impact cell survival rates.
The Quant-i T Pic oGreen double-s tranded DNA assay
kit (Invitrogen) was used to assess DNA concentration.
PC12 cells were grown in 48-well microplates (Nunc) as
triplicates. After 24 h, QDs were added (10% of amount
of Medium) to make final concentrations in the range
of 10
(-7)-(-9)
M. Three different types of controls, namely:
positive, negative and background were used throughout
the study. Positive controls had cells with culture med-
ium but without treatment with QDs. Negative controls
were treated with QDs with culture medium and no
cells. Background controls were cells treated with QDs
but without culture medium. After 24 hours of co-incu-
bation with the QDs, the medium was removed and the
wells were washed with HBSS. 200 μl of deionised dou-
ble-distilled water was then added and the cells were
lysed by freezing for 15 minutes at -80°C and thawing
for 15 minutes at room temperature repeated 3 times.
According to the assay kit a standard curve was then
constructed. Final co ncentrations of the standards were
1000, 500, 100, 50, 25, 10, 5, and 0 ng/μl. 100 μlof
lysed DNA solution of cells from each well were dis-
pensed in a clear tissue culture 96-well plate. 100 μlof
diluted PicoGreen solution were added to each of the
test wells of 96-well plate. The Plate was analysed using
a Wallac Victor Fluorescent Plate Reader by Fluores-
cence 485 nm/535 nm, 1.0 s protocol. Levels of DNA in
each sample were calculated using the standard curve.
This was repeated with incubation periods of 48 hours
and 72 hours.
Cell Proliferation ELISA BrdU
An ELISA BrdU (BrdU) assay involves the detection of
5-bromo-2-deoxyu ridine, an analogue of thymidine,
which is incorporated into the DNA of proliferating
cells. Incorporated BrdU is label led with a peroxidase-
conjugated anti-BrdU antibody (anti-BrdU-POD). The
amount of bound anti-BrdU-POD is quantified calori-
metrically through exposure to a peroxidase substrate
(3,3,5,5-tetramethylbenzidine [TMB]). TMB is acted
upon by peroxidase to form a blue product. Upon addi-
tion of a stop solution (H
2
SO
4
), a yellow product is
formed, which absorbs at 450 nm. The leve l of absor-
bance is directly related to the amount of cell division
that has occurre d during the course of the incubation
period.
Cellular proliferation was measured using an enzyme-
linked immunosorbent assay (ELISA) ( supplied as a kit
[Roche]). Cell Proliferation ELISA BrdU (Colorimetric)
was performed according to the protocol in the manual
of the kit. PC12 cells were grown in 96-well microplates
(Nunc) as triplicates. After 24 h, QDs were added (10%
of amount of Medium) to make final concentrations in
the range of 10
(-7)-(-9)
M.
Three different types of controls, namely: positive,
negative and background were used throughout the
study. Positive controls had cells with culture medium
but without treatment with QDs. Negative controls were
treated with QDs with culture medium and no cells.
Background controls were cells treated with QDs but
without culture medium. BrdU labelling solution was
added to each well after 24 hours of adding QDs and
incubated at @ 37°C and 5% CO
2
atmosphere. The cul-
ture medium was removed and the cells denatured, and
the anti-BrdU-POD added. This binds to the BrdU
incorpo rated into cellular DNA. The level of incorpora-
tion is detected by means of a colorimetric substrate
reaction. Quantification of the bound anti-BrdU-POD
was accomplished by adding 100 μl TMB to each well
and a further 20 minute incubation time at room tem-
perature. 25 μl0.1MH
2
SO
4
was then added , incubated
for 1 minute and shaken at 300 rpm to stop the reac-
tion. The Plate was analysed using the Wallac Victor
Fluorescent Plate Reader (450-550 nm) protocol and
measured absorbance for 2 minutes at room tempera-
ture. This was repeated with incubation periods of 48
hours and 72 hours.
Statistical Analysis
Results of alamarBlue and PicoGreen assays were ana-
lysed using one-way analysis of variance (ANOVA). A r
valueoflessthan0.05fortheANOVAwasconsidered
significant. Error was expressed as a standard deviation.
Abbreviations
QDs: Quantum Dots; CdTe: Cadmium Telluride; PC12: pheochromocytoma
12; NGF: nerve growth factors; TGA: Thioglycolic Acid; gel-QDs: gelatinised
QDs; DNA: Deoxyribonucleic Acid; DMWM: Dulbecco’s Modification of Eagle
Medium EDTA; DAPI: 4: 6-diamidino-2-phenylindole; UV: ultraviolet; PL:
photoluminescence; PLL: Poly-L-Lysine; BSA/PBS: Bovine serum albumin/
phosphate-buffered saline; DIC: Differential Interference Contrast; HBSS:
Hank’s Balanced Salt Solution; TMB: 3,3,5,5-tetramethylbenzidine; HRTEM:
Prasad et al. Journal of Nanobiotechnology 2010, 8:7
/>Page 14 of 16
High Resolution Transmission Electron Microscopy; FRET: Förster Resonance
Energy Transfer; TGA: Thermogravimetric Analysis.
Acknowledgements
This work has been funded by Science Foundation Ireland (SFI).
Author details
1
National Centre for Biomedical Engineering Science, National University of
Ireland, Galway, Ireland.
2
CRANN and The School of Chemistry, Trinity
College Dublin, Dublin 2, Ireland.
Authors’ contributions
BRP performed all cellular experiments and wrote the manuscript with SJB.
SJB and VAG conducted the QD experiments. DC contributed with confocal
imaging. YR, YG, NN, TJS designed the overall project and helped with data
and manuscript revision. All authors read and approved the final manus cript.
Competing interests
The authors declare that they have no competing interests.
Received: 21 July 2009 Accepted: 25 March 2010
Published: 25 March 2010
References
1. Dubertret B, Skourides P, Norris DJ, Noireaux V, Brivanlou AH, Libchaber A:
In Vivo Imaging of Quantum Dots Encapsulated in Phospholipid
Micelles. Science 2002, 298:1759-1762.
2. Gao X, Cui Y, Levenson RM, Chung LWK, Nie S: In vivo cancer targeting
and imaging with semiconductor quantum dots. Nat Biotech 2004,
22:969-976.
3. Goldman ER, Balighian ED, Mattoussi H, Kuno MK, Mauro JM, Tran PT,
Anderson GP: Avidin: A Natural Bridge for Quantum Dot-Antibody
Conjugates. J Am Chem Soc 2002, 124:6378-6382.
4. Jaiswal JK, Goldman ER, Mattoussi H, Simon SM: Use of quantum dots for
live cell imaging. Nat Methods 2004, 1:73-78.
5. Pinaud F, King D, Moore HP, Weiss S: Bioactivation and cell targeting of
semiconductor CdSe/ZnS nanocrystals with phytochelatin-related
peptides. J Am Chem Soc 2004, 126:6115-6123.
6. Rosenthal SJ, Tomlinson I, Adkins EM, Schroeter S, Adams S, Swafford L,
McBride J, Wang Y, DeFelice LJ, Blakely RD: Targeting Cell Surface
Receptors with Ligand-Conjugated Nanocrystals. J Am Chem Soc 2002,
124:4586-4594.
7. Wu X, Liu H, Liu J, Haley KN, Treadway JA, Larson JP, Ge N, Peale F,
Bruchez MP: Immunofluorescent labeling of cancer marker Her2 and
other cellular targets with semiconductor quantum dots. Nat Biotech
2003, 21:41-46.
8. Chen F, Gerion D: Fluorescent CdSe/ZnS Nanocrystal-Peptide Conjugates
for Long-term, Nontoxic Imaging and Nuclear Targeting in Living Cells.
Nano Lett 2004, 4:1827-1832.
9. Bruchez M Jr, Moronne M, Gin P, Weiss S, Alivisatos AP: Semiconductor
Nanocrystals as Fluorescent Biological Labels. Science 1998,
281:2013-2016.
10. Chan WC, Nie S: Quantum Dot Bioconjugates for Ultrasensitive
Nonisotopic Detection. Science 1998, 281:2016-2018.
11. Alivisatos AP: The use of nanocrystals in biological detection. Nat Biotech
2004, 22:47-52.
12. Han MY, Gao XH, Su JZ, Nie S: Quantum-dot-tagged microbeads for
multiplexed optical coding of biomolecules. Nat Biotech 2001, 19:631-635.
13. Larson DR, Zipfel WR, Williams RM, Clark SW, Bruchez MP, Wise FW,
Webb WW: Water-Soluble Quantum Dots for Multiphoton Fluorescence
Imaging in Vivo. Science 2003, 300:1434-1436.
14. Chan WCW, Maxwell DJ, Gao X, Bailey RE, Han M, Nie S: Luminescent
quantum dots for multiplexed biological detection and imaging. Curr Op
Biotech 2002, 13:40-46.
15. Vanmaekelbergh D, Liljeroth P: Electron-conducting quantum dot solids:
novel materials based on colloidal semiconductor nanocrystals. Chem
Soc Rev 2005, 34:299-312.
16. Pathak S, Cao E, Davidson MC, Jin SH, Silva GA: Quantum dot applications
to neuroscience: New tools for probing neurons and glia. Journal of
Neuroscience 2006, 26:1893-1895.
17. Yu WW, Qu LH, Guo WZ, Peng XG: Experimental determination of the
extinction coefficient of CdTe, CdSe, and CdS nanocrystals. Chem Mater
2003, 15:2854-2860.
18. Osaki F, Kanamori T, Sando S, Sera T, Aoyama Y: A Quantum Dot
Conjugated Sugar Ball and Its Cellular Uptake. On the Size Effects of
Endocytosis in the Subviral Region. JACS 2004, 126:6520-6521.
19. Gomez N, Winter JO, Shieh F, Saunders AE, Korgel BA, Schmidt CE:
Challenges in quantum dot-neuron active interfacing. Talanta 2005,
67:462-471.
20. Jan E, Byrne SJ, Cuddihy M, Davies AM, Volkov Y, Gun’ko YK, Kotov NA:
High-Content Screening as a Universal Tool for Fingerprinting of
Cytotoxicity of Nanoparticles. ACS Nano 2008, 2:928-938.
21. Rajan SS, Liu HY, Vu TQ: Ligand-Bound Quantum Dot Probes for Studying
the Molecular Scale Dynamics of Receptor Endocytic Trafficking in Live
Cells. ACS Nano 2008, 2:1153-1166.
22. Cui BX, Wu CB, Chen L, Ramirez A, Bearer EL, Li WP, Mobley WC, Chu S:
One at a time, live tracking of NGF axonal transport using quantum
dots. PNAS 2007, 104:13666-13671.
23. Tang ML, Xing TR, Zeng J, Wang HL, Li CC, Yin ST, Yan D, Deng HM, Liu J,
Wang M, et al: Unmodified CdSe quantum dots induce elevation of
cytoplasmic calcium levels and impairment of functional properties of
sodium channels in rat primary cultured hippocampal neurons.
Environmental Health Perspectives 2008, 116:915-922.
24. Tang ML, Wang M, Xing TR, Zeng J, Wang HL, Ruan DY: Mechanisms of
unmodified CdSe quantum dot-induced elevation of cytoplasmic
calcium levels in primary cultures of rat hippocampal neurons. Biomater
2008, 29:4383-4391.
25. Lopez E, Figueroa S, Oset-Gasque MJ, Gonzalez MP: Apoptosis and
necrosis: two distinct events induced by cadmium in cortical neurons in
culture. Br J Pharmacol 2003, 138:901-911.
26. Vu TQ, Maddipati R, Blute TA, Nehilla BJ, Nusblat L, Desai TA: Peptide-
Conjugated Quantum Dots Activate Neuronal Receptors and Initiate
Downstream Signaling of Neurite Growth. Nano Lett 2005, 5:603-607.
27. Fan H, Leve EW, Scullin C, Gabaldon J, Tallant D, Bunge S, Boyle T,
Wilson MC, Brinker CJ: Surfactant-Assisted Synthesis of Water-Soluble and
Biocompatible Semiconductor Quantum Dot Micelles. Nano Letters 2005,
5:645-648.
28. Mamedova NN, Kotov NA, Rogach AL, Studer J: Albumin-CdTe
nanoparticle bioconjugates: Preparation, structure, and interunit energy
transfer with antenna effect. Nano Lett 2001, 1:281-286.
29. Howarth M, Takao K, Hayashi Y, Ting AY: Targeting quantum dots to
surface proteins in living cells with biotin ligase. PNAS 2005,
102:7583-7588.
30. Sundara Rajan S, Vu TQ: Quantum Dots Monitor TrkA Receptor Dynamics
in the Interior of Neural PC12 Cells. Nano Letters 2006, 6:2049-2059.
31. Courty S, Luccardini C, Bellaiche Y, Cappello G, Dahan M: Tracking
Individual Kinesin Motors in Living Cells Using Single Quantum-Dot
Imaging. Nano Letters 2006, 6:1491-1495.
32. Nan X, Sims PA, Chen P, Xie XS: Observation of Individual Microtubule
Motor Steps in Living Cells with Endocytosed Quantum Dots. PPhys
Chem B 2006, 109:24220-24224.
33. Kondoh M, Araragi S, Sato K, Higashimoto M, Takiguchi M, Sato M:
Cadmium induces apoptosis partly via caspase-9 activation in HL-60
cells. Toxicol 2002, 170:111-117.
34. Limaye DA, Shaikh ZA: Cytotoxicity of Cadmium and Characteristics of Its
Transport in Cardiomyocytes. Toxicol Appl Pharmacol 1999, 154:59-66.
35. Rikans LE, Yamano T: Mechanisms of cadmium-mediated acute
hepatotoxicity. J Biochem Molec Tox 2000, 14:110-117.
36. Nel A, Xia T, Madler L, Li N: Toxic Potential of Materials at the Nanolevel.
Science 2006, 311:622-627.
37. Hoshino A, Fujioka K, Oku T, Suga M, Sasaki YF, Ohta T, Yasuhara M,
Suzuki K, Yamamoto K: Physicochemical properties and cellular toxicity of
nanocrystal quantum dots depend on their surface modification. Nano
Lett 2004, 4:2163-2169.
38. Derfus AM, Chan WCW, Bhatia SN: Probing the cytotoxicity of
semiconductor quantum dots. Nano Lett 2004, 4:11-18.
39. Guo G, Liu W, Liang J, He Z, Xu H, Yang X: Probing the cytotoxicity of
CdSe quantum dots with surface modification. Mater Lett 2007,
61:1641-1644.
40. Lovrić J, Cho SJ, Winnik FM, Maysinger D: Unmodified Cadmium Telluride
Quantum Dots Induce Reactive Oxygen Species Formation Leading to
Prasad et al. Journal of Nanobiotechnology 2010, 8:7
/>Page 15 of 16
Multiple Organelle Damage and Cell Death. Chem Biol 2005,
12:1227-1234.
41. Kirchner C, Liedl T, Kudera S, Pellegrino T, MunozJavier A, Gaub HE,
Stolzle S, Fertig N, Parak WJ: Cytotoxicity of Colloidal CdSe and CdSe/ZnS
Nanoparticles. Nano Lett 2005, 5:331-338.
42. Chang E, Thekkek N, Yu WW, Colvin VL, Drezek R: Evaluation of Quantum
Dot Cytotoxicity Based on Intracellular Uptake. Small 2006, 2:1412-1417.
43. Wang L, Nagesha D, Selvarasah S, Dokmeci M, Carrier R: Toxicity of CdSe
Nanoparticles in Caco-2 Cell Cultures. J Nanobiotech 2008, 6:11.
44. Byrne SJ, Williams Y, Davies A, Corr SA, Rakovich A, Gun’ko YK, Rakovich YP,
Donegan JF, Volkov Y: “Jelly Dots": Synthesis and Cytotoxicity Studies of
CdTe Quantum Dot-Gelatin Nanocomposites. Small 2007, 3:1152-1156.
45. Lovrić J, Bazzi HS, Cuie Y, Fortin GRA, Winnik FM, Maysinger D: Differences
in subcellular distribution and toxicity of green and red emitting CdTe
quantum dots. J Mol Med 2005, 83:377-385.
46. Shiohara Amane, Hoshino Akiyoshi, Hanaki Ken-ichi, Suzuki Kazuo,
Yamamoto K: Microbiology and Immunology 2004, 48:669-675.
47. Cho SJ, Maysinger D, Jain M, Roder B, Hackbarth S, Winnik FM: Long-Term
Exposure to CdTe Quantum Dots Causes Functional Impairments in Live
Cells. Langmuir 2007, 23:1974-1980.
48. Tan WB, Huang N, Zhang Y: Ultrafine biocompatible chitosan
nanoparticles encapsulating multi-coloured quantum dots for
bioapplications. J Colloid and Interface Sci 2007, 310:464-470.
49. Byrne SJ, Corr SA, Rakovich TY, Gun’ko YK, Rakovich YP, Donegan JF,
Mitchell S, Volkov Y: Optimisation of the synthesis and modification of
CdTe quantum dots for enhanced live cell imaging. J Mat Chem 2006,
16:2896-2902.
50. Tang Z, Ozturk B, Wang Y, Kotov NA: Simple Preparation Strategy and
One-Dimensional Energy Transfer in CdTe Nanoparticle Chains. JPhys
Chem B 2004, 108:6927-6931.
51. Conroy JBSJ, Gun’ko YK, Rakovich YP, Donegan JF, Davies A, Kelleher D,
Volkov Y: CdTe Nanoparticles Display Tropism to Core Histones and
Histone-Rich Cell Organelles. Small 2008, 4:2006-2015.
52. Monteiro-Riviere NA, Inman AO, Zhang LW: Limitations and relative u tility
of screening assays to assess engineered nanoparticle toxicity in a
human cell line. Toxicol Appl Pharmacol 2009, 234
:222-235.
53. Nabiev I, Mitchell S, Davies A, Williams Y, Kelleher D, Moore R, Gun’ko YK,
Byrne S, Rakovich YP, Donegan JF, et al: Nonfunctionalized Nanocrystals
Can Exploit a Cell’s Active Transport Machinery Delivering Them to
Specific Nuclear and Cytoplasmic Compartments. Nano Letters 2007,
7:3452-3461.
54. Chan W-H, Shiao N-H, Lu P-Z: CdSe quantum dots induce apoptosis in
human neuroblastoma cells via mitochondrial-dependent pathways and
inhibition of survival signals. Toxicol Lett 2006, 167:191-200.
55. Lee H-M, Shin D-M, Song H-M, Yuka J-M, Lee Z-W, Lee S-H, Hwang SM,
Kim J-M, Lee C-S, Jo E-K: Nanoparticles up-regulate tumor necrosis factor-
a and CXCL8 via reactive oxygen species and mitogen-activated protein
kinase activation. Toxicol Appl Pharm 2009, 238:160-169.
56. Wan RMY, Zhang X, Chien S, Tollerud DJ, Zhang Q: Matrix
metalloproteinase-2 and -9 are induced differently by metal
nanoparticles in human monocytes: The role of oxidative stress and
protein tyrosine kinase activation. Toxicol Appl Pharm 2008, 233:276-285.
57. Calabrese EJ, Baldwin LA: Applications of hormesis in toxicology, risk
assessment and chemotherapeutics. Trends Pharmacol Sci 2002,
23:331-337.
58. Gaponik N, Talapin DV, Rogach AL, Hoppe K, Shevchenko EV, Kornowski A,
Eychmüller A, Weller H: Thiol-capping of CdTe nanocrystals: An
alternative to organometallic synthetic routes. J Phys Chem B 2002,
106:7177-7185.
doi:10.1186/1477-3155-8-7
Cite this article as: Prasad et al.: Long-term exposure of CdTe quantum
dots on PC12 cellular activity and the determination of optimum non-
toxic concentrations for biological use. Journal of Nanobiotechnology
2010 8:7.
Submit your next manuscript to BioMed Central
and take full advantage of:
• Convenient online submission
• Thorough peer review
• No space constraints or color figure charges
• Immediate publication on acceptance
• Inclusion in PubMed, CAS, Scopus and Google Scholar
• Research which is freely available for redistribution
Submit your manuscript at
www.biomedcentral.com/submit
Prasad et al. Journal of Nanobiotechnology 2010, 8:7
/>Page 16 of 16