báo cáo khoa học: "Quantitative analysis of nanoparticle internalization in mammalian cells by high resolution X-ray microscopy" pps
Bạn đang xem bản rút gọn của tài liệu. Xem và tải ngay bản đầy đủ của tài liệu tại đây (17.79 MB, 15 trang )
RESEA R C H Open Access
Quantitative analysis of nanoparticle
internalization in mammalian cells by high
resolution X-ray microscopy
Hsiang-Hsin Chen
1
, Chia-Chi Chien
1,2
, Cyril Petibois
3
, Cheng-Liang Wang
1
, Yong S Chu
4
, Sheng-Feng Lai
1
,
Tzu-En Hua
1
, Yi-Yun Chen
1
, Xiaoqing Cai
1
, Ivan M Kempson
1
, Yeukuang Hwu
1,2,5*
and Giorgio Margaritondo
6
Abstract
Background: Quantitative analysis of nanoparticle uptake at the cellular level is critical to nanomedicine
procedures. In particular, it is required for a realistic evaluation of their effects. Unfortunately, quantitative
measurements of nanoparticle uptake still pose a formidable technical challenge. We present here a method to
tackle this problem and analyz e the number of metal nanoparticles present in different types of cells. The method
relies on high-lateral-resolution (better than 30 nm) transmission x-ray microimages with both absorption contrast
and phase contrast – including two-dimensional (2D) projection images and three-dimensional (3D) tomographic
reconstructions that directly show the nanoparticles.
Results: Practical tests were successfully conducted on bare and polyethylene glycol (PEG) coated gold
nanoparticles obtained by x-ray irradiation. Using two different cell lines, EMT and HeLa, we obtained the number
of nanoparticle clusters uptaken by each cell and the cluster size. Furthermore, the analysis revealed interesting
differences between 2D and 3D cultured cells as well as between 2D and 3D data for the same 3D specimen.
Conclusions: We demonstrated the feasibility and effectiven ess of our method, proving that it is accurate enough
to measure the nanoparticle uptake differences between cells as well as the sizes of the formed nanoparticle
clusters. The differences between 2D and 3D cultures and 2D and 3D images stress the importance of the 3D
analysis which is made possible by our approach.
Background
Quantitative analysis is an important but still largely
unexplored issue in the study of nanomedic ine proce-
dures, in particular at the cellular and subcellular levels.
Many phenomena were discovered by w hich nanoparti-
cles enhance the cancer cell mortality or facilitate the
action of other cell-killing factors [1-4]. However, the
potential modulation of these phenomena for proce-
dures such as radiotherapy [5-9] or drug delivery
[7,10-13] requires clarifying a number of issues, many of
them quantitative.
Such issues are not simple since each cell line inter-
acts differently with nanoparticles [14-16]. Furthermore,
the specific chemistry and morphology of each type of
nanoparticles influence the interaction mechanisms
leading to nanoparticle uptake [17-23]. Quantitative
features are specifically important since they can affect
internal izat ion processes (endocytosis, pinocytosis, free
membrane trafficking, etc.) [24-27], the optimization of
nanomedicine procedures (in particular the maximum
nanoparticle uptake by ea ch cell line [28-30]) and the
conditions to avoid toxicity.
An effective quantitative analysis should include not
only average properties but also the statistical distributions
for the level of uptake and for the size of the clusters
formed by aggregated nanoparticles. Furthermore, it
would be preferable to identify the location of the inter-
nalized nanoparticles and clusters with respect to the
different organelles in cells for their different functions.
The procedure presented here meets these require-
ments and stems from a n extensive previous work to
develop suitable instruments a nd methods. In recent
* Correspondence:
1
Institute of Physics, Academia Sinica, Nankang, Taipei 115, Taiwan
Full list of author information is available at the end of the article
Chen et al. Journal of Nanobiotechnology 2011, 9:14
/>© 2011 Chen et al; licensee BioMed Central Ltd. This is an Open Access article distributed under the terms of the Creative Commons
Attribution License ( which permits unr estricted u se, distribution, and reproduction in
any me dium, provided the original work is properly cited.
years, we introduced a series of imaging approaches for
biosystems based o n the high brightness and coherence
of x-ray synchrotron sources [31-37]. Such methods
reached sufficient spatial resolution for subcellular
analysis [37], thus enabling us to harvest valuable and
reliable quantitative information.
The results presented below show that the extraction
of detailed quantitative data on nanoparticle cellular
uptake is entirely feasible. Although so far validated for
thespecificcaseofgoldnanoparticl es (AuNPs) on two
cell li nes, the method can have much broader applica-
tions - for example, to all nanoparticles containing high-
Z elements. The approach is non-destructive and
reaches high spatial resolution.
The procedure started with the acquisition of trans-
mission hard-x-ray micrographs with an instrument that
can reach a 30-nm spatial resolution [38,39]. We
collected either individual projection micrographs or
sets of projection images at different angles f or tomo-
graphic 3D reconstruction. The high penetration of our
hard-x-rays (8 keV photon energy) made it possible to
work with 3D samples, i.e., cell cultures in gel.
Large cell collections could be simultaneously imaged
as required for quantitative analysis. Staining with heavy
metals (uranium or osmium acetate) was used in speci-
fic cases to reveal specific intracellular (organelle)
details. Zernike phase contrast was also exploited for
visualizing nanoparticle clusters smaller than ~100 nm.
From the microimages, we extracted quantitative data
on the number and size of uptaken nanopart icl e clusters
and informa tion on the cl uster positions in the cells. The
procedure was first tested on bare (uncoated) AuNPs
with average size ~15 nm prepared by a recently devel-
oped method [40-43]. This is based on x-ray irradiation
of precursor solutions and produces nanoparticle colloids
with high density and excellent stability. Although the
sizes of these nanoparticles are smaller than the currently
achieved resolution of X- ray microsc opy, the aggregation
of the nanoparticles after internalization by cells forms
clusters of size large enough to be imaged and quantita-
tively analyzed.
The tests were then extended to AuNPs coated with
polyetheleneglycol (PEG), prepared with a similar
irradiation method [40]. We tested both types of nano-
particles on two different cancer cell lines, EMT-6 and
HeLa cell, detecting the significant quantitative differ-
ences discussed below.
One interesting issue analyzed in our tests was the
quantitative relation between the nanoparticle uptake
and the cell survival. The image analysis results were
cross-checked with those of cell viability bioassays. The
corresponding conclusions are interesting on their own
considering the present open issues on the cellular
effects of AuNPs.
Specifically, we found that both naked and PEG-
coated AuNPs cause cell death at high concentrations.
Quantitative uptake, quantitative cell death rate and
colloid concentration appear all correlated.
Quite interestingly, no particle uptake was found at
cell nuclei locations. This indicated that the nuclear
membrane selectivity remained unchanged in the
presence of nanoparticles.
Results and discussion
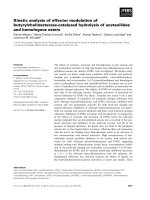
Cytotoxicity
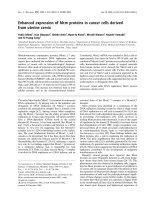
The cytotoxicity results fo r EMT cells exposed to differ-
ent nanoparticle colloid concentrations and for the con-
trol EMT specimen are shown in Figure 1. Cells treated
with a 1 mM colloid of bare AuNPs exhibited >95% cell
viability. This decreased to 44 ± 4% at 5 mM, indicating
that even without surface treatment the AuNPs damage
cells, i.e., cellular homeostasis cannot be maintained at
high nanoparticle concentrations.
The same figure shows that the PEG coating increased
(by 30-40%) the nanoparticle damage at very high
concentrations. At low concentrations (0.1 mM), the
nanoparticles did not significantly affect the cell viability.
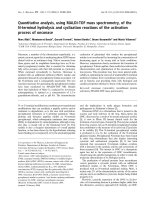
To determin e if apoptosis was the cause of cell death
for highly concentrated PEG-coated AuNPs, we per-
formed flow cytometry with a fluorescence-a ctivated cell
sorter (FACS) [41]. As s hown in Figure 2, there was no
significant i ncrease in the apoptotic cells as the PEG-
coated AuNP concentration increased: the profile is
similar to that of the control specimen. This indicates
that cell death does not occurviaapoptosisbutvia
necrosis.
0%
20%
40%
60%
80%
100%
120%
140%
CM 0.1 mM 0.2 mM 0.5 mM 1.0 mM 2.0 mM 5.0 mM
Viability (%)
PEG Au NPs
naked Au NPs080623
Naked Au NPs
PEG- Au NPs
A
u
NP
Co
n
ce
ntr
a
ti
o
n
Figure 1 Results of the cell survival test. Cell survival test of EMT
cells exposed to AuNPs with or without PEG capping. The cells
were continuously co-cultured with colloidal nanoparticles for 24 h.
The cell viability was measured by direct counting the cell number
by trypan blue exclusion. The data are plotted as the percentage of
surviving cells compared to untreated control specimens.
Chen et al. Journal of Nanobiotechnology 2011, 9:14
/>Page 2 of 15
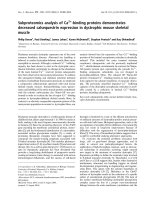
TEM imaging
TEM was first performed on thin sections, of thickness
<100 nm, of all the cell lines with and without exposure
to nanoparticle colloid. Figure 3 shows examples of
TEM micrographs of the EMT and HeLa cells with
AuNPs internalized. After co-culturing with 500 μM
naked AuNPs for 48 h, the endocytotic vesicles inside
the cytoplasm of cell lines contained clusters of many
nanoparticles. However, there are visible differences
between the two lines: the vesicle size for EMT cells (A)
is substantially larger than for HeLa cells (B).
This is an example of the quantitative information
yielded b y TEM: the average size of the vesicles in
Figure 3A, 3B and 3C a re 637 ± 4 1 nm 530 ± 16 nm
and 280 ± 30 nm (n = 5 for EMT cell; n = 4 for HeLa
cell). There are, however, limitations in the quantitative
data that can be extracted with TEM. The images of
Figure 3 are from very thin sli ces of cells hundreds time
thicker, and essentially yield 2D information.
Three-dimensional information can be obtained with
TEM by continu ous sectioning, but both the image tak-
ing and the image analysis are time consuming. This is
particularly true if the density of uptaken nanoparticles
is low, since the procedure would require the analysis of
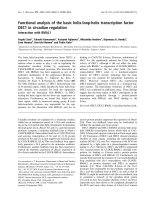
many slices to obtain reliable results. For example, in
Figur e 4, TEM images are used to analyze the uptake of
naked AuNPs in EMT cells for different co-culture
times. After 30 min co-culture, only a very few AuNPs
are uptaken and most TEM images show no AuNPs at
all. Only by analyzing many such images we found
AuNPs on the cell surface or inside the cytoplasm
shown in Figure 4A and 4B. This is due to the necessary
time for cells to produce and internalize the vesicles
packing nanoparticles for endocytosis. This means that
for short co-culture times it is difficult and time-con-
suming to go beyond a mere qualitative analysis.
X-ray imaging
Figures 5 and 6 show the main features of our x-ray
micrographs in view of th e quantitative analysis. Specifi-
cally, Figure 5 demonstrates that the details of 2D
cultured specimens can be seen even without staining.
In fact, the nucleus morphology and some subcellular
details are clearly visible for EMT and HeLa 2D cell cul-
tures- see Figures 5A and 5B. However, other org anelles
such as mitochondrias and vacuoles less dense and
smaller than the nuclei were not fully imaged and
required staining.
Figure 6 shows that even without staining this imaging
method can readily explore in d etail the dissimilarities
in the internalization of different AuNPs by different
cell lines. Specifically, the amount of PEG coated AuNPs
uptaken by EMT cells is much less than that of naked
AuNPs, as seen in Figure 6A and 6B. Similar differences
between these two types of AuNPs were found for all
the cell lines (data not shown). For naked AuNPs, differ-
ent cell lines also exhibited diff erent res ponses in terms
of total amount of internalized nanoparticles and nano-
particle cluster morphology. Comparing Figure 6B and
6C, it is clear that naked AuNPs are more numerous in
EMT cells, form larger cluster and are distributed more
evenly in cytop lasm than in HeLa cel ls. For comparison,
we al so show a similar image of naked AuNPs in CT-26
cells (Figure 6D) revealing a situation intermediate
between those in EMT and HeLa cells.
These qualitative conclusions from 2D projection
images can be confirmed by examining the specimens
from differ ent illumination/imaging directions as shown
in Figure 7. The nanoparti cle clusters appear at the
nuclear membrane location of HeLa cells (Figure 7A
and Additional files 1) whereas the much larger clusters
inside EMT cells are distributed more uniformly
throughout the cell cytoplasm. After specific staining
the c ell skeleton by the DAB-Ni enhancement method,
wefound(seeFigure7B)aclose relation be tween the
uptaken naked AuNPs and the skeletons. The high lat-
eral resolution enabled us to detect individual naked
AuNPs and to conclude from these images that no
AuNPs crossed the nuclear membrane.
The mor phology of 2D cultured specimens could affe ct
the nanoparticle uptake. Therefore, we also performed
tests on 3D specimens with tomographic image recon-
struction. Figure 8A-C shows an example: Figure 8A is
the projection i mage of a control EMT cell grown on a
0 200 400 600 800 1000
0
20
40
60
80
100
120
Counts
FL2A
0 200 400 600 800 100
0
0
20
40
60
80
Counts
FL2A
0 200 400 600 800 1000
0
20
40
60
80
100
120
140
Counts
FL2A
0 200 400 600 800 100
0
0
20
40
60
80
Counts
FL2A
0.5 mM
1.0 mM
0.1 mM Control
A
D
C
B
Figure 2 Results of the flow cytometry. The flow cytometry
profile of the EMT cell cycle after co-culturing with PEG-coated
AuNPs with different colloidal concentrations was performed with a
fluorescence-activated cell sorter (FACS). There was no significant
increase in the apoptotic cells as the nanoparticle concentration
increased (A: Control, B: 0.1 mM, C: 0.5 mM, D: 1.0 mM), indicating
that the apoptosis is not likely to cause the observed cell damage
in this case.
Chen et al. Journal of Nanobiotechnology 2011, 9:14
/>Page 3 of 15
scaffold, revealing the overall cell shape. The magnified
image on the right shows the nucleus (marked by arrow).
Figure 8B shows similar results for a cell specimen tre a-
ted with a nanoparticle colloid. Figure 8C and 8D (movie
of different projection in Additional file 2) shows the
results of specimen staining in revealing the detailed
localization and shape of the nucleus and of the overall
nanoparticle cluster distribution. Figure 8E shows the 3D
tomographically reconstructed image of an EMT cell
after AuNP treatment. The distribution of AuNPs and
their specific location in the cell can be obtained from
the rendered 3D movies (Additional file 3). It is clear that
the AuNPs were not internalized in the cell nucleus.
Furthermore, the cluster size distribution was quite simi-
lar to the results previously obtaine d on 2D cultured cell
specimens.
C
A B
Figure 3 TEM ima ges of c ells with interna lized AuNPs. After co-culturing with 500 μM colloidal naked AuNPs for 48 h, the endocytotic
vesicles of these cells were found to contain clusters of many AuNPs inside the cytoplasm. Note that the size of the clusters is significantly
larger for EMT cells (A and B) than for HeLa cells (C). Bars: 1 μm (A), 200 nm (B) and 5 μm (C).
Chen et al. Journal of Nanobiotechnology 2011, 9:14
/>Page 4 of 15
Figure 9 shows results for a HeLa cell 3D culture,
treated with AuNP colloid and further stained. Once
again, the staining procedure put in evidence the subcel-
lular details and the nanoparticle distribution (Addi-
tional files 4 and 5 corresponding to Figure 9C and 9D).
Figure 10 (and Additional file 6) shows similar results
for a 3D “ pellet” EMT specimen. Similar to movies
associated with Figure 10B (Additional file 7), the tomo-
grap hic reconstruction clearly reveals t he aggregation of
nanoparticles.
Quantitative data
Thesearethecoreobjectiveofourpresentworkand
the basis for the validation of our method. Figures 11
and 12 show typical results of the procedure: the size
distributions of the cluster, formed by aggregation of the
internalized AuNPs, for 2D and 3D cultures of EMT
and HeLa cell (without staining). The distributions were
obtained by analyzing 6 EMT cells and 4 HeLa cells.
These results indicate why the mere evaluation of the
AuNP uptake by averaging over a large number of cells
A
B
D
C
Figure 4 TEM images of EMT cells for different naked AuNP co-culture times. A) co-culturing with 500 μM AuNP colloid for 30 min: only a
few AuNPs can be found on the surface or inside the cytoplasm. The red square (B) marks the area where clusters are found. C) 1 h co-culture
time: a larger number of endocytotic vesicles containing AuNPs is found in the cytoplasm. D) 6 h co-culture time: the number and the size of
endocytotic vesicles containing AuNPs are even larger. Bar: 2 μm (A, C and D) and 200 nm (B).
Chen et al. Journal of Nanobiotechnology 2011, 9:14
/>Page 5 of 15
isnotsufficienttounderstand the quantitative aspects
of the phenomenon. In fact, the above figures reveal
substantial differences between different types of cells
and even between different cells of the same type.
We see i ndeed distributions with different peaks and
different spreads. Overall, the data for EMT cells suggest a
size distribution peak around 140 nm for EMT cells and
around 30 nm for HeLa cells. These cluster distribution
differences are statistically significant. Thus, our approach
made possible a quantitative evaluation of AuNP cluster
distributions at the individual cell level, yielding relevant
information for the intracellular uptake mechanism that
cannot be delivered by cell-averaging procedures.
In addition, our micr oimages also revealed interesting
qualitative differences between EMT and HeLa cells. We
seeinfactfromFigures11and12thattheclustersare
concentrated near the nucleus for HeLa cells, whereas
they are more uniformly distrib uted for EMT cells. By
measuring the location of the AuNP clusters with
respect to the nucleus membrane from 3D images such
as Figure 7A, we could determine that the clusters were
internalized within a very narrow region, ~1 ± 0.5 μm,
outside the HeLa cell nuclear membrane.
ThedifferenceoftheAuNPinternalization process
between cell lines can be explained by differences in the
biophysical mechanisms: the endocytosis depends on the
cell membrane properties, which can be largely different
between epithelial, endothelial, cubic, circulating, etc.
phenotypes. The different size of the clusters encom-
passed by endosomes could also result in different intra-
cellular transportation mechanisms of the AuNP
clusters . One must also consider that biochemical envir-
onment will play a major role in this process, with pH,
fluid pressure, and interstitial homeostasis modulating
the size and the number of formed vesic les. Further stu-
dies on the details of the dynamics of these processes
with respect to the size of the clusters are underway.
Figure 13 emphasizes another important quantitative
issue: the difference between 2D and 3D analysis. The
figure shows four x-ray micrographs from 3D pellet
specimens of EMT cells. These projection images are
from large angular sets (Additional file 8) from which
tomographically reconstructed pictures were obtained.
The analysis of such pictures yielded the cluster size dis-
tribution also shown in Figure 13.
It is clear that such a distribution is substantially differ-
ent from the corresponding 2D results, Figure 11. This
means that the reliable extraction of data on uptaken
nanoparticles must include the analysis of 3D speci mens,
made possible in our approach by the combination of
x-ray microscopy and tomographic reconstruction.
On the qualitative side, 3D data on pellet specimens
corroborated the information from 2D cultured speci-
mens. Specifically, they confirmed that clusters inside
EMT cells are substantially larger and more uniformly
distributed than inside HeLa cells, even when the cells
are prepared in 3D.
Conclusions
We experimentally demonst rated that high resolution
x-ray micrographs yield important quantitative informa-
tion about the nanoparticle internalization processes.
A
B
Figure 5 Transmission x-ray micro scopy image of EMT and HeLa cells without chemical staining. A) EMT cell: some filopodia on the cell
boundary are visible. B) HeLa cell: the membrane ruffles and the nuclei are clear. Bars: 10 μm).
Chen et al. Journal of Nanobiotechnology 2011, 9:14
/>Page 6 of 15
We specifically found subst antial differences in the clus-
ter size distributions and in the overall cluster uptake
between individual cells even if they are in the same
culture. Similar but quantitatively more important
differences were found between different types of cells,
together with qualitative differences in the spatial distri-
butions inside the cells. S uch results prove not only the
feasibility of our quantitative method but its effective-
ness and expanded features with respect to other
approaches. Substantial differences between 2D and 3D
cultured c ells as well as between the results of 2D and
3D data analysis stress the importance of 3D procedures
like the tomographic reconstruction made possible by
our approach.
Methods
AuNP synthesis
Bare, MUA and PEG-coated (pegylated) AuNPs in
colloidal solution were synthesized by the synchrotron
x-ray i rradiation method [40,42-44]. A mixture of gold
A
B
D
C
Figure 6 Transmission x-ray microimages images showing the different internalization of AuNPs by different cell lines. A) An EMT cell
co-cultured with 1 mM PEG‐coated AuNPs for 48 h. B) An EMT cell co-cultured with 500 μM naked AuNPs for 48 h. C) A HeLa cell co-cultured
with 500 μM naked AuNPs for 48 h. D) A CT-26 cell co-cultured with 500 μM naked AuNPs for 48 h. (Bars: 5 μm).
Chen et al. Journal of Nanobiotechnology 2011, 9:14
/>Page 7 of 15
AB
Figure 7 Transmission X-ray microimages of a 2D cultured HeLa cell.A)Co-culturedwith500μM naked AuNPs for 48h show the
aggregation of AuNP clusters around the cell nucleus (Additional file 1). B) With NAB-Ni staining, AuNP clusters are imaged within the cell
skeletons. Bars: 5 μm.
Figure 8 Transmission x-ray microimages of 3D cultured EMT cells. EMT cells were grown on an OPLA scaffold. A) Cells from an untreated
(without nanoparticles) specimen stained with uranium acetate. The nuclei (one of them marked by an arrow) are clearly visible. Bar: 20 μm. B)
EMT cells co-cultured with 500 μM naked AuNPs for 6h. The nucleus would not be visible without staining whereas the AuNPs could be
observed for unstained specimens due to their strong contrast. Bar: 5 μm. (C) Patchwork of projection micrograph for an EMT cell co-cultured
with 500 μM naked AuNPs. Bar: 5 μm. (D) Single projection images like this were collected for tomographic reconstruction at 1 degree intervals
with respect to the incoming x-rays (Additional file 2). Bar: 5 μm. The cell was stained with uranium acetate, targeting the lipid membrane. E)
Picture of the 3D tomographic reconstruction of an EMT cell. The nanoparticle cluster distribution can be reliably extracted from the
corresponding movie (Additional file 3).
Chen et al. Journal of Nanobiotechnology 2011, 9:14
/>Page 8 of 15
precursor, salt buffer and water was exposed for 5 min
to the x-rays emitted by the 01A beamline of the
National Synchrotron Radiation Research Center
(NSRRC), Hisnchu, Taiwan. The photon energies of this
beamline are in the 8-15 keV band. The nanoparticle
colloids were then centrifuged using an Amicon ultra-15
centrifugal filer tube (Millipore, Billercia, MA) to
increase the concentration and to remove the unreacted
precursors.
Cell culture
EMT-6, CT-26 and HeLa cells were separately cultured
in Dulbecco’ s modified Eagle medium (DMEM)-F-12
medium and DMEM medium (Invitrogen, Carlsbad,
CA) supplemented with 1% penicillin-streptomycin and
10% heat-inactived fetal bovine serum (Invitrogen,
Carlsbad, CA) and were maintained i n a humidified
incubator with 5% CO
2
and at 37 C; the culture medium
was changed every two days.
Cytotoxicitic assay
AuNP colloid was freshly prepared and diluted with
Dulbecco’ s medium. After overnight cell seeding in a
multiplate, EMT-6 cells were co-cultured for 24 hours
with AuNPs with different colloida l concentrations: 0.1,
0.25, 0.5, 1.0, 2.0, 5.0 and 10.0 mM. Growth medium
with no nanoparticles was used for the control speci-
mens. After incubation, some of the cells were harvested
A
C
D
B
Figure 9 Transmission x-ray microimages of 3D cultured HeLa cells. Similar to Figure 7, the HeLa cells were grown on an OPLA scaffold. Bar
in A: 20 μm, B and C: 5 μm. (Additional files 4 (9A) and 5 (9B))
Chen et al. Journal of Nanobiotechnology 2011, 9:14
/>Page 9 of 15
and stained by trypan blue re agent (Sigma, St. Louis,
MO) to count the number of live cell.
Flow cytometry analysis of the cell cycle
After a 24-hour incubation, trypsin was used to detach
the cells from the petri dishes. The cells were frozen
with pre-cooled methanol for 3 min and then stained
with propidium iodide for 20 min. Flow cytometry was
then performed by FACS C alibur E2594 and the Cell-
Quest Acquisition and Analysis Software (Becton Dick-
inson Biosciences, Franklin Lakes, NJ) was used to treat
the required 5000-7000 cells for each sample.
Cell preparation for transmission electron microscopy
Cells prepared as described above were deposited on
an acryl embedding film. After removing the medium
by PBS washing, the sample was fixed with 4% (w/v)
paraformaldehyde (EMS, Hatfield, PA) plus 2.5% (w/v)
glutaraldehyde (EMS, Hatfield, PA) mixture for 20 min
at room temperature. Then, we used a 2% (w/w)
osmium tetroxide (EMS, Hatfield, PA) water solution
to post-fix it for 30 min. Later, the sample was dehy-
drated using a series of ethanol solutions with increas-
ing concentration, 30%-100%; each washing step lasted
15 min. Ultrathin sample sectioning, down to ~90 nm,
was performed with a diamond knife.
Cell preparation for transmission x-ray microscopy
Two dimensional cultured spe cimens were obtained by
growing the cells on a Kapton film overnight for complete
cell attachment. For 3D specimens, the cells were grown
on BD
®
3D OPLA scaffolds (Becton Dickinson Bios-
ciences, Franklin Lakes, NJ) in vitro. Such scaffolds can be
used for a variety of cell types and have a porous architec-
ture suitable for microscopic observations. The fixation
was performed using a 4% (w/v) paraformaldehyde and
2.5% (w/v) glutaraldehyde mixture with 1X PBS buffer
both for cells grown on Kapton films and on scaffolds.
Osmium tetroxide and uranium acetate were used in
some cases to enhance the absorption contrast (see the
discussion below about absorption vs. phase contrast).
Three-dimensional specimens were also prepared with
a “ pellet” technique: after t he 2D culture describ ed
above, the cells were lifted by trypsin. After they devel-
oped a spherical form, t hey were fixed and stained as
described above. During the acquisition of projection
image sets for tomography, we used Embed-812 Resin
(EMS, Hatfield, PA) or photoresist to preserve the speci-
men structure.
A commercial kit (Vector Laboratories, Burlingame,
CA) was used to perform DAB-nickel enhancement
staining. The metallic nickel-DAB mixture was imaged
exploiting its strong x-ray absorption and used as a con-
trast agent to image specific subcellular organelles.
X-ray imaging
The technical details and performances of our transmis-
sion x-ray microscope were reported [37,38,45]. The field
of view is 24 μm and the detector is a 2048 × 2048 CCD.
In the pre sent study, each projection image was collected
B
A
Figure 10 EMT cells pr epared as the pellets. EM T cell co-cultured with 500 μM naked AuNPs and prepared as the pellets; the specimen was
not stained. A) Transmission x-ray projection micrograph (Additional file 6). Bar: 5 μm. B) 3D reconstructed tomography image (Additional file 7).
Bar: 5 μm. The distribution of AuNPs is shown in the corresponding movie.
Chen et al. Journal of Nanobiotechnology 2011, 9:14
/>Page 10 of 15
0 100 200 300 400 500 600 700
0
10
20
30
40
50
Frequency (%)
Cluster size (nm)
S2
S3
S3 S2
A
B
Figure 11 Quantitative analysis of the uptake of EMT cells by transmission x-ray microimages. Transmission x-ray uptake microanalysis by
EMT cells after co-culturing with 500 μM naked AuNPs for 48 h. The size distribution in A) was obtained by analyzing individual cells such as that
in B). Bars in B: 10 μm.
Chen et al. Journal of Nanobiotechnology 2011, 9:14
/>Page 11 of 15
witha1-4sexposuretimeandthennormalizedbythe
background illumination intensity. Images for entire cells
were obtained by patchworking several pictures.
For tomography, images were collected at regular
angular intervals over 140 degrees (the limits of the
experimental geometry). The tomographic reconstruction
was performed using an Xradia software and then visua-
lized with the Amira software.
For quantitative analysis, the procedure was interactive.
By visual insp ection, an appropr iate grey scale value was
Figure 12 Quantitative analysis of the uptake of HeLa cells by transmission x-ray microim ages. Results similar to those of Figure 10, for
HeLa cells. Bar: 5 μm.
Chen et al. Journal of Nanobiotechnology 2011, 9:14
/>Page 12 of 15
selected to segment each TXM image and identify areas
with nanoparticle clusters. The large difference in contrast
between cells and nanoparticles makes this segmentati on
reliable. Then, the number of clusters was interactively
extracted for each cell as well as the size of each cluster,
thus obtaining cell-specific cluster size distributions.
The particle size analysis in 2 D images was performed
with image segmentation followed by an approximate fitting
Figure 13 Quantitative uptake analysis of EMT plellets by 3D images. A) Internalized cluster size distri bution from fo ur x-ray transmission
micrographs (B) of 3Dal pellet specimens of EMT cells. Bars: 5 μm. (Additional file 8).
Chen et al. Journal of Nanobiotechnology 2011, 9:14
/>Page 13 of 15
of the particles by ellipses. The image segmentation is first
performed on tomography reconstructed 2D s lice by home-
made routine in the Image Pro Plus (Mediacybernetic)
software. After integrate the complete set of slices to form
3D model by Amira software overlaid with the segmented
objects, the particle size was evaluated as the average of
the long and short axes of each ellipse. In 3D, we used
ellipsoids rather than ellipses and evaluated the size as the
average of the 3 axes in 3 di rection s. Sampling included
only particles that clearly resided inside the cells.
Additional material
Additional file 1: A movie obtained from sequential projection X-
ray micrographs taken with 1 degree angle separation of a HeLa
cell shows the aggregation of AuNP clusters around the cell
nucleus.
Additional file 2: A movie obtained from sequential projection X-
ray micrographs taken of an EMT cell grown on an OPLA scaffold
with AuNPs.
Additional file 3: Movies from pictures of the 3D tomographic
reconstruction of an EMT cell with AuNPs.
Additional file 4: A movie obtained from sequential projection X-
ray micrographs of a HeLa cell grown on an OPLA scaffold with
AuNPs.
Additional file 5: Movies from pictures of the 3D tomographic
reconstruction of a HeLa cell with AuNPs.
Additional file 6: A movie obtained from sequential projection X-
ray micrographs of a pallet EMT cell with AuNPs.
Additional file 7: Movies from pictures of the 3D tomographic
reconstruction of a pallet EMT cell with AuNPs.
Additional file 8: A movie obtained from sequential projection X-
ray micrographs of specimen S3 (pallet EMT cells) in Figure 13
taken at 1 degree intervals.
Acknowledgements
This work was supported by the ANR-NSC French-Taiwan bilateral program
n° ANR-09-BLAN-0385, the National Science and Technology Program for
Nanoscience and Nanotechnology, the Thematic Research Project of
Academia Sinica, the Biomedical Nano-Imaging Core Facility at National
Synchrotron Radiation Research Center (Taiwan), the Fonds National Suisse
pour la Recherche Scientifique and the Center for Biomedical Imaging
(CIBM, supported by the Louis-Jeantet and Leenards foundations). Use of the
Advanced Photon Source is supported by the U. S. Department of Energy,
Office of Sciences, Office of Basic Energy Sciences, under Contract No. DE-
AC02-06CH11357.
Author details
1
Institute of Physics, Academia Sinica, Nankang, Taipei 115, Taiwan.
2
Department of Engineering and System Science, National Tsing Hua
University, Hsinchu 300, Taiwan.
3
Université de Bordeaux, CNRS UMR 5248,
B8 Avenue des faculties, 33402 Talence-Cedex, France.
4
National Synchrotron
Light Source II, Brookhaven National Laboratory, Upton, NY 11973, USA.
5
Institute of Optoelectronic Sciences, National Taiwan Ocean University,
Keelung 202, Taiwan.
6
Ecole Polytechnique Fédérale de Lausanne, CH-1015
Lausanne, Switzerland.
Authors’ contributions
Conceived and designed the experiments: HSC CCC CP YH. Performed the
experiments: HSC CCC CLW IMK. Analyzed the data: HSC CCC EL YH GM.
Wrote the paper: HSC YH GM. All authors read and approved the final
manuscript.
Competing interests
The authors declare that they have no competing interests.
Received: 26 December 2010 Accepted: 10 April 2011
Published: 10 April 2011
References
1. Kirchner C, Liedl T, Kudera S, Pellegrino T, Muñoz Javier A, Gaub HE,
Stölzle S, Fertig N, Parak WJ: Cytotoxicity of colloidal CdSe and CdSe/ZnS
nanoparticles. Nano Lett 2005, 5:331-338.
2. Lin W, H uang YW, Zhou XD, Ma Y: In vitro toxicity of silica
nanoparticles in human lung cancer cells. Toxicol App l Pha rmacol 2006,
217:252-259.
3. Osman IF, Baumgartner A, Cemeli E, Fletcher JN, Anderson D: Genotoxicity
and cytotoxicity of zinc oxide and titanium dioxide in HEp-2 cells.
Nanomedicine (Lond) 2010, 5:1193-1203.
4. Tarantola M, Pietuch A, Schneider D, Rother J, Sunnick E, Rosman C,
Pierrat S, Sonnichsen C, Wegener J, Janshoff A: Toxicity of gold-
nanoparticles: Synergistic effects of shape and surface functionalization
on micromotility of epithelial cells. Nanotoxicology 2010.
5. Hainfeld JF, Slatkin DN, Smilowitz HM: The use of gold nanoparticles to
enhance radiotherapy in mice. Phys Med Biol 2004, 49:N309-315.
6. Liu CJ, Wang CH, Chien CC, Yang TY, Chen ST, Leng WH, Lee CF, Lee KH,
Hwu Y, Lee YC, Cheng CL, Yang CS, Chen YJ, Je JH, Margaritondo G:
Enhanced x-ray irradiation-induced cancer cell damage by gold
nanoparticles treated by a new synthesis method of polyethylene glycol
modification. Nanotechnology 2008, 19:295104-5.
7. Passarella RJ, Spratt DE, van der Ende AE, Phillips JG, Wu H, Sathiyakumar V,
Zhou L, Hallahan DE, Harth E, Diaz R: Targeted nanoparticles that deliver a
sustained, specific release of Paclitaxel to irradiated tumors. Cancer Res
2010, 70:4550-4559.
8. Hainfeld JF, Dilmanian FA, Zhong Z, Slatkin DN, Kalef-Ezra JA, Smilowitz HM:
Gold nanoparticles enhance the radiation therapy of a murine
squamous cell carcinoma. Phys Med Biol 2010, 55:3045-3059.
9. Liu CJ, Wang CH, Chen ST, Chen HH, Leng WH, Chien C, Wang CCL,
Kempson IM, Hwu Y, Lai TC, Hsiao M, Yang CS, Chen YJ, Margaritondo G:
Enhancement of cell radiation sensitivity by pegylated gold
nanoparticles. Phys Med Biol 2010, 55:931-945.
10. Liong M, Lu J, Kovochich M, Xia T, Ruehm SG, Nel AE, Tamanoi F, Zink JI:
Multifunctional inorganic nanoparticles for imaging, targeting, and drug
delivery. ACS Nano 2008, 2:889-896.
11. Maham A, Tang Z, Wu H, Wang J, Lin Y: Protein-based nanomedicine
platforms for drug delivery. Small 2009, 5:1706-1721.
12. Chen ZG: Small-molecule delivery by nanoparticles for anticancer
therapy. Trends Mol Med 2010, 16:594-602.
13. Janib SM, Moses AS, MacKay JA: Imaging and drug delivery using
theranostic nanoparticles. Adv Drug Deliv Rev 2010, 62:1052-1063.
14. Williams Y, Sukhanova A, Nowostawska M, Davies AM, Mitchell S,
Oleinikov V, Gun’ko Y, Nabiev I, Kelleher D, Volkov Y: Probing cell-type-
specific intracellular nanoscale barriers using size-tuned quantum dots.
Small 2009, 5:2581-2588.
15. Cartiera MS, Johnson KM, Rajendran V, Caplan MJ, Saltzman WM: The
uptake and intracellular fate of PLGA nanoparticles in epithelial cells.
Biomaterials 2009, 30:2790-2798.
16. Mahmood M, Casciano DA, Mocan T, Iancu C, Xu Y, Mocan L, Iancu DT,
Dervishi E, Li Z, Abdalmuhsen M, Biris AR, Ali N, Howard P, Biris AS:
Cytotoxicity and biological effects of functional nanomaterials delivered
to various cell lines. J Appl Toxicol 2010, 30:74-83.
17. Gupta AK, Gupta M, Yarwood SJ, Curtis AS: Effect of cellular uptake of
gelatin nanoparticles on adhesion, morphology and cytoskeleton
organisation of human fibroblasts. J Control Release 2004, 95:197-207.
18. Unfried K, Albrecht C, Klotz LO, Von Mikecz A, Grether-Beck S, Schins RPF:
Cellular responses to nanoparticles: Target structures and mechanisms.
Nanotoxicology 2007, 1:52-71.
19. Hauck TS, Ghazani AA, Chan WC: Assessing the effect of surface chemistry
on gold nanorod uptake, toxicity, and gene expression in mammalian
cells. Small 2008, 4 :153-159.
20. Anas A, Okuda T, Kawashima N, Nakayama K, Itoh T, Ishikawa M, Biju V:
Clathrin-mediated endocytosis of quantum dot-peptide conjugates in
living cells. ACS Nano 2009, 3:2419-2429.
Chen et al. Journal of Nanobiotechnology 2011, 9:14
/>Page 14 of 15
21. Alkilany AM, Nagaria PK, Hexel CR, Shaw TJ, Murphy CJ, Wyatt MD: Cellular
uptake and cytotoxicity of gold nanorods: molecular origin of
cytotoxicity and surface effects. Small 2009, 5:701-708.
22. Soenen SJH, Illyes E, Vercauteren D, Braeckmans K, Majer Z, De Smedt SC,
De Cuyper M: The role of nanoparticle concentration-dependent
induction of cellular stress in the internalization of non-toxic cationic
magnetoliposomes. Biomaterials 2009, 30:6803-6813.
23. Cho EC, Au L, Zhang Q, Xia Y: The Effects of Size, Shape, and Surface
Functional Group of Gold Nanostructures on Their Adsorption and
Internalization by Cells. Small 2010, 6:517-522.
24. Chen J, Irudayaraj J: Quantitative investigation of compartmentalized
dynamics of ErbB2 targeting gold nanorods in live cells by single
molecule spectroscopy. ACS Nano 2009, 3:4071-4079.
25. Thurn KT, Arora H, Paunesku T, Wu A, Brown EM, Doty C, Kremer J,
Woloschak G: Endocytosis of titanium dioxide nanoparticles in prostate
cancer PC-3M cells. Nanomedicine 2010.
26. Zaki NM, Tirelli N: Assessment of nanomaterials cytotoxicity and
internalization. Methods Mol Biol 2011, 695:243-259.
27. Elsaesser A, Taylor A, de Yanes GS, McKerr G, Kim EM, O’Hare E, Howard CV:
Quantification of nanoparticle uptake by cells using microscopical and
analytical techniques. Nanomedicine (Lond) 2010, 5:1447-1457.
28. Gupta AK, Gupta M: Cytotoxicity suppression and cellular uptake
enhancement of surface modified magnetic nanoparticles. Biomaterials
2005, 26:1565-1573.
29. Villanueva A, Canete M, Roca AG, Calero M, Veintemillas-Verdaguer S,
Serna CJ, Morales Mdel P, Miranda R: The influence of surface
functionalization on the enhanced internalization of magnetic
nanoparticles in cancer cells. Nanotechnology 2009, 20:031151.
30. Takahashi M, Yoshino T, Matsunaga T: Surface modification of magnetic
nanoparticles using asparagines-serine polypeptide designed to control
interactions with cell surfaces. Biomaterials 2010, 31:4952-4957.
31. Lee KH, Hwu YK, Je JH, Tsai WL, Choi EW, Kim YC, Kim HJ, Seong JK, Yi SW,
Ryo HS, Margaritondo G: Synchrotron radiation imaging of internal
structures in live animals. Yonsei Med J 2002, 43:25-30.
32. Hwu Y, Tsai WL, Chang HM, Yeh HI, Hsu PC, Yang YC, Su YT, Tsai HL,
Chow GM, Ho PC, Li SC, Moser HO, Yang P, Seol SK, Kim CC, Je JH,
Stefanekova E, Groso A, Margaritondo G: Imaging cells and tissues with
refractive index radiology. Biophys J 2004, 87:4180-4187.
33. Yoon CY, Sung DJ, Lee JH, Kim AR, Oh CW, Je JH, Weon BM, Seol SK,
Pyun A, Hwu Y, Margaritondo G, Joo KJ, Yoon DK: Imaging of renal and
prostate carcinoma with refractive index radiology. Int J Urol 2007,
14:96-103.
34. Liu P, Sun J, Guan Y, Yue W, Xu LX, Li Y, Zhang G, Hwu Y, Je JH,
Margaritondo G:
Morphological study of early-stage lung cancer using
synchrotron radiation. J Synchrotron Radiat 2008, 15:36-42.
35. Son SW, Park SY, Park GM, Ha SH, Lee GW, Lee OS, Hwu Y, Kim AR, Je JH,
Oh CH: Ex vivo imaging of basal cell carcinoma using synchrotron
phase-contrast X-ray microscopy. Skin Res Technol 2008, 14:13-17.
36. Chien CC, Wang CH, Wang CL, Li ER, Lee KH, Hwu Y, Lin CY, Chang SJ,
Yang CS, Petibois C, Margaritondo G: Synchrotron microangiography
studies of angiogenesis in mice with microemulsions and gold
nanoparticles. Anal Bioanal Chem 2010, 397:2109-2116.
37. Cai X, Wang CL, Chen HH, Chien CC, Lai SF, Chen YY, Hua TE, Kempson IM,
Hwu Y, Yang CS, Margaritondo G: Tailored Au nanorods: optimizing
functionality, controlling the aspect ratio and increasing
biocompatibility. Nanotechnology 2010, 21:335604.
38. Chen YT, Lo TN, Chiu CW, Wang JY, Wang CL, Liu CJ, Wu SR, Jeng ST,
Yang CC, Shiue J, Chen CH, Hwu Y, Yin GC, Lin HM, Je JH, Margaritondo G:
Fabrication of high-aspect-ratio Fresnel zone plates by e-beam
lithography and electroplating. J Synchrotron Radiat 2008, 15:170-175.
39. Chen YT, Lo TN, Chu YS, Yi J, Liu CJ, Wang JY, Wang CL, Chiu CW, Hua TE,
Hwu Y, Shen Q, Yin GC, Liang KS, Lin HM, Je JH, Margaritondo G: Full-field
hard x-ray microscopy below 30 nm: a challenging nanofabrication
achievement. Nanotechnology 2008, 19:395302-7.
40. Wang CH, Liu CJ, Wang CL, Hua TE, Obliosca JM, Lee KH, Hwu Y, Yang CS,
Liu RS, Lin HM, Je JH, Margaritondo G: Optimizing the size and surface
properties of polyethylene glycol (PEG)-gold nanoparticles by intense x-
ray irradiation. J Phys D 2008, 41:195301.
41. Riccardi C, Nicoletti I: Analysis of apoptosis by propidium iodine staining
and flow cytometry. Nat Protoc 2006, 1:1458-1461.
42. Yang YC, Wang CH, Hwu YK, Je JH: Synchrotron X-ray synthesis of
colloidal gold particles for drug delivery. Mater Chem Phys 2006,
100:72-76.
43. Wang CH, Chien CC, Yu YL, Liu CJ, Lee CF, Chen CH, Hwu Y, Yang CS,
Je JH, Margaritondo G: Structural properties of ‘naked’ gold nanoparticles
formed by synchrotron X-ray irradiation. J Synchrotron Radiat 2007,
14:477-482.
44. Wang CH, Hua TE, Chien CC, Yu YL, Yang TY, Liu CJ, Leng WH, Hwu Y,
Yang YC, Kim CC, Je JH, Chen CH, Lin HM, Margaritondo G: Aqueous gold
nanosols stabilized by electrostatic protection generated by X-ray
irradiation assisted radical reduction. Mater Chem Phys 2007, 106:323-329.
45. Huang FK, Chen WC, Lai SF, Liu CJ, Wang CL, Wang CH, Chen HS, Hua TE,
Cheng YY, Wu MK, Hwu Y, Yang CS, Margaritondo G: Enhancement of
irradiation effects on cancer cells by cross-linked dextran-coated iron
oxide (CLIO) nanoparticles. Phys Med Biol 2010, 55:469-482.
doi:10.1186/1477-3155-9-14
Cite this article as: Chen et al.: Quantitative analysis of nanoparticle
internalization in mammalian cells by high resolution X-ray microscopy.
Journal of Nanobiotechnology 2011 9:14.
Submit your next manuscript to BioMed Central
and take full advantage of:
• Convenient online submission
• Thorough peer review
• No space constraints or color figure charges
• Immediate publication on acceptance
• Inclusion in PubMed, CAS, Scopus and Google Scholar
• Research which is freely available for redistribution
Submit your manuscript at
www.biomedcentral.com/submit
Chen et al. Journal of Nanobiotechnology 2011, 9:14
/>Page 15 of 15