Evidence-Based Imaging - part 10 pps
Bạn đang xem bản rút gọn của tài liệu. Xem và tải ngay bản đầy đủ của tài liệu tại đây (1.3 MB, 60 trang )
Goals of Imaging
In patients with colorectal cancer imaging studies are acquired periodically
in order to detect development of recurrent disease and to assess tumor
burden and response to therapy. In the cirrhotic patient, the main goal of
imaging is detection of developing complications, the most important of
which is HCC. Many imaging modalities currently available have been
used for detecting liver metastases, with variable success. Regardless of the
technique used, the ability to detect a focal space-occupying lesion in the
liver depends on the size of the tumor, the spatial and contrast resolution
of the imaging method, the difference in contrast and perfusion between
the tumor and background liver parenchyma, and the adequacy of the
method used for displaying the images after acquired (10). All these factors
affect the performance parameters of the various imaging techniques. A
test is useful if sensitivity remains high at an acceptable specificity level.
In a meta-analysis that studied the detection rate of liver metastases from
gastrointestinal malignancies with multiple modalities, Kinkel et al. (3)
suggest that, in order to be useful in clinical practice, the minimum accept-
able specificity of imaging methods in this context should be 85%. Lower
specificities would lead to excessive and unnecessary interventions such
as biopsies, excessive complementary imaging tests, and follow-up exam-
inations. When assessing cost-effectiveness of the imaging methods, other
factors need to be considered: availability, cost, risks (such as radiation
and use of toxic contrast agents), and potential benefit of tumor detection
(i.e., likelihood of achieving long-term remission or cure with appropriate
therapy).
Overall Cost to Society
On an individual level, cirrhosis results in impaired quality of life and indi-
rect costs involving decreased productivity and lost days from work. The
Centers for Disease Control and Prevention conservatively estimates U.S.
expenditures in excess of $600 million annually on patients with HCC. In
2002, in the U.S., a total of 15,654 patients were discharged from hospitals
with the diagnosis of HCC and 2522 patients died in the hospital with
HCC. The mean length of hospital stay was 7.2 days with a mean cost of
$32,193. This resulted in a total cost of $501,998,078.
I. How Accurate Is Imaging in Patients with Suspected
Hepatic Metastatic Disease?
Summary of Evidence: Computed tomography (CT) and magnetic reson-
ance imaging (MRI) are the most widely used techniques for evaluating
the liver in the initial staging and follow-up of cancer patients. For detect-
ing liver metastases, carefully performed CT and MRI studies with state-
of-the-art equipment and interpretation by experienced radiologists afford
similarly good results. Some studies showed a slight advantage for
MRI (11,12) (moderate evidence). Others, including a multiinstitutional
524 B.C. Lucey et al.
Chapter 28 Hepatic Disorders 525
study of 365 patients (13) (moderate evidence), have not. Computed
tomography is usually preferred because it is more widely available and
because it is a well-established technique for surveying the extrahepatic
abdominal organs and tissues (such as the peritoneum and lymph nodes).
However, MRI has an advantage in the characterization of focal lesions.
Thus, MRI is commonly used as a problem-solving tool or for initial
staging of a tumor. It is also preferred for patients who cannot receive intra-
venous iodinated contrast material. Finally, concerns about the risk of radi-
ation from repeated exposure to CT examinations make MRI a valuable
alternative for children or young adults with malignancies. As mentioned
previously, a comparison of the performance of CT vs. MRI for this and
other indications needs to be reassessed periodically, considering the rapid
evolution of both technologies and the increase in therapeutic options
available.
Kinkel et al. (3) reviewed a total of 111 studies that included over 3000
patients. At a specificity of at least 85%, the weighted sensitivities were
ultrasonography (US) 55%, CT 72%, MRI 76%, and positron emission
tomography (PET) 90% (moderate evidence). These data, however, need to
be validated in prospective trials before broad conclusions can be drawn.
Intraoperative ultrasonography (IOUS) has higher sensitivity than trans-
abdominal ultrasonography, CT, and MRI (14,15). The role of FDG-PET and
PET-CT will continue to expand, but cost constraints will limit their use to
patients in whom the possible impact is greatest.
Supporting Evidence: The most widely used imaging techniques today
include US, CT, MRI, and, more recently, PET. There is extensive literature
available regarding the relative merits and limitations of each of these
modalities for detecting metastases of primary tumors from various
organs. When analyzing the multiple studies published on this topic,
several limitations are evident: insufficient definition of inclusion and
exclusion criteria, incomplete reporting of methods used, and lack of a
uniform standard of reference. Although the best standard of reference
available is findings at laparotomy with bimanual palpation or intraoper-
ative ultrasonography, this was used as the gold standard in only a minor-
ity of studies (14,16,17). As indicated by van Erkel et al. (18), use of a
suboptimal standard of reference results in underreporting of lesions and
overestimation of detection rate. Another confounding factor is the varying
method for reporting sensitivity numbers: per patient (detection of at least
one lesion per patient) and per lesion (detection of all lesions per patient).
Thus, it is important to continually scrutinize the results of all available
current studies as evolving and improving technology can make results of
prior studies redundant. Following is a review of the available data regard-
ing the benefits and limitations of the various imaging techniques com-
monly used for evaluating the liver in patients with colorectal cancer and
other gastrointestinal primary malignancies.
A. Ultrasonography
Ultrasonography has the advantage of being widely available throughout
the world, inexpensive, and essentially risk-free. The reported sensitivity
of US for detecting liver metastases varies between 60% and 90% (3).
526 B.C. Lucey et al.
Unfortunately, many of the published studies were performed in the 1980s
(19,20) (limited evidence) and were largely limited to reporting sensitivity
results on a per patient basis. More recently, the advent of US contrast
agents has led several investigators to evaluate the use of US with current
equipment. For detecting liver metastases, the sensitivity and specificity of
US improve substantially with the addition of microbubble contrast agents.
Microbubbles are essentially blood pool agents that augment the Doppler
and harmonic US signal. In addition, some of these agents have a
hepatosplenic specific late phase, which enables visualization of tumor foci
in the liver that were otherwise undetectable (21). In a multicenter study,
Albrecht et al. (22) found that the addition of a microbubble contrast agent
increased the per patient sensitivity of US from 94% to 98% (not signifi-
cant), while the per lesion sensitivity increased from 71% to 87% (highly
significant, p < .05).
Intraoperative ultrasonography has higher sensitivity than transabdom-
inal US, CT, and MRI (14,15). Conlon et al. (14) compared MRI with IOUS
in 80 patients with colorectal cancer metastases who underwent hepatic
resection and found that IOUS findings added important information in
37 patients and changed the surgical approach in 14 patients. They con-
cluded that IOUS provides valuable information prior to hepatic resection
of colorectal cancer metastases.
B. Computed Tomography
Multiple factors pertaining to technique need to be considered when
planning CT scans of patients with suspected metastatic disease and
when examining reports that deal with this topic. The typical colorectal
cancer metastasis is hypoattenuating and hypovascular relative to liver
parenchyma. Thus, detectability is maximized by administering intra-
venous contrast material and by acquiring the CT images during the time
of peak enhancement of the liver parenchyma. This typically occurs during
the portal venous dominant phase, which occurs approximately 60 to
80 seconds after the initiation of contrast injection. Ideally, hepatic
parenchyma attenuation should increase by at least 50 Hounsfield units
after the administration of intravenous contrast material. The addition of
images acquired prior to the administration of intravenous contrast mate-
rial or in the arterial-dominant or delayed phases of contrast enhancement
are not routinely necessary when the indication for the scan is suspected
hypovascular metastases. These are necessary when evaluating the cir-
rhotic liver, when attempting to characterize a focal lesion, or when the
primary tumor is one that is known to be associated with hypervascular
metastases, such as neuroendocrine and carcinoid tumors, thyroid cancer,
melanoma, breast cancer, or renal cell carcinoma (Fig. 28.1).
Although specific protocols vary among institutions, most use a total
load of 37 to 50g of iodine (23). Although as little as 30g have been used,
detection of hypovascular focal lesions may be limited with this approach
(24). In the patient with colorectal cancer who is being scanned to decide
among the several therapeutic options available, the risk of overlooking a
potentially resectable small liver metastasis needs to be outweighed vs. the
benefit of limiting the amount of contrast material injected.
In a carefully performed study, Valls et al. (25) used contrast-enhanced
helical CT to detect liver metastases in 157 patients with colorectal
Chapter 28 Hepatic Disorders 527
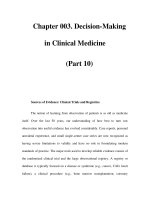
Figure 28.1. Importance of adequate technique for detecting computed tomogra-
phy (CT) of metastatic disease to the liver. Noncontrast (A), arterial phase (B), and
portal venous phase (C) CT images of a 57–year-old patient with breast cancer and
abnormal results of liver function tests. There are multiple foci of hypervascular
metastatic deposits seen exclusively in the arterial phase image (B). The appearance
of the liver is near normal on the noncontrast (A) and portal venous phase (C)
images.
A
B
C
carcinoma. Using intraoperative palpation and US as the standard of ref-
erence, helical CT correctly depicted 247 (85.2%) of 290 metastases and had
a 96.1% positive predictive value (moderate evidence). Surgical resection
of the liver metastases was attempted in 112 patients and the authors
achieved a 4-year survival rate of 58.6%. In their study, all false-negative
interpretations occurred in lesions less than 1.5cm in diameter. Other
studies that also used surgical findings and IOUS as the standard of refer-
ence found similar high sensitivity and specificity (16), for detecting lesions
as small as 4mm in diameter.
Although with the multirow detector helical CT (MDCT) scanners that
are now available it is possible to acquire CT images in multiple phases
after administration of intravenous contrast material, it has not been con-
vincingly demonstrated that detection of hypovascular metastases such as
those from colorectal carcinoma is improved significantly by scanning in
any phase other than the peak portal venous phase (16,26,27). The advent
of MDCT has also brought about new paradigms related to CT technique.
Although scanning with slice thickness of less than 1mm and often
with isotropic voxels is tempting, there is debate as to what is the limit
in thickness that achieves the performance that is adequate for demon-
strating small metastatic lesions in clinical practice. Some studies have
shown that scanning with a slice thickness of less than 5mm does not
result in a significant improvement in sensitivity for detecting small
lesions (28). Other investigators have obtained better results using thinner
collimation (29). However, detection of even small lesions in the patient
with cancer is important, since approximately 12% of lesions less than
1cm in diameter will prove to be metastatic in nature (30). The possible
added benefit of images acquired with isotropic voxels remains to be deter-
mined and will undoubtedly be the focus of multiple studies in the near
future.
Another CT technique that continues to be used at some institutions is
CT during arterial portography (CTAP). This is an invasive technique that
requires catheterization of the superior mesenteric or splenic artery for
direct injection of contrast into the territory drained by the portal vein. This
direct delivery of contrast into the porto-mesenteric circulation achieves
the greatest degree of hepatic parenchymal enhancement and maximizes
lesion detection with CT, with a sensitivity that exceeds 90% (17,31). The
technique, however, is invasive and has a false-positive rate as high as 25%
(17,31). This has led to decreased enthusiasm for this technique and its
replacement with noninvasive CT and MRI methods using state-of-the-art
equipment (32,33).
C. Magnetic Resonance Imaging
Magnetic resonance imaging of the liver for detecting metastases requires
the acquisition of multiple sequences and administration of intravenous
contrast material. Although the appearance of metastatic lesions on MRI is
variable, the T1 and T2 relaxation times of metastases are prolonged rela-
tive to normal liver parenchyma. In general, this results in hypointensity
on T1-weighted sequences and hyperintensity on T2-weighted images (Fig.
28.2). T2-weighted MRI is also useful for characterizing focal lesions and
differentiating nonsolid benign lesions such as cysts and hemangiomas
528 B.C. Lucey et al.
Chapter 28 Hepatic Disorders 529
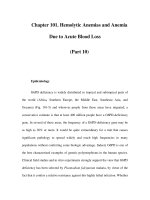
Figure 28.2. Typical appearance of hepatic metastasis on magnetic resonance
imaging (MRI). T1-weighted (A), T2-weighted (B), and late arterial phase (C) MRI
acquired in a patient with known colon cancer demonstrate a large metastatic
deposit in the right hepatic lobe. The lesion is hypointense (relative to liver
parenchyma) on the T1-weighted image, slightly hyperintense on the T2-weighted
image, and demonstrates moderate enhancement after administration of
gadolinium-DTPA.
A
B
C
from metastases. In multiecho T2-weighted scans, metastases become less
intense when the echo time (TE) is increased from <120msec to 160msec
or more. Conversely, cysts and hemangiomas typically remain hyperin-
tense as the TE increases. For lesions with equivocal behavior, MRI can be
used to measure the T2 value; the T2 of malignant tumors is approximately
90msec, while that of hemangiomas and cysts exceeds 130msec (34,35).
However, metastases with liquefactive necrosis or cystic neoplasms may
remain hyperintense on heavily T2-weighted images. Metastases can have
a perilesional halo of high signal, indicating viable tumor, or demonstrate
a doughnut or target appearance (36,37).
For detection of liver metastases, a three-phase technique after adminis-
tration of gadolinium is recommended; these phases are the arterial-dom-
inant phase, the portal venous phase, and the hepatic venous or interstitial
phase. Similar to CT, the detection of colorectal cancer metastases using
MRI is maximized during the portal venous phase. In this phase, the
lesions typically appear hypointense relative to the enhanced liver
parenchyma and may exhibit variable degrees of enhancement (Fig. 28.2).
In addition to lesion detection, this protocol also allows characterization of
coexisting nonmetastatic focal lesions. This is important for staging
recently detected malignant tumors, and has implications in determining
the type of therapy to be offered. The reported sensitivity of MRI using
multiple combinations of the sequences available varies between 65% and
95% (3,33,38–41), with a mean of approximately 76% (3) (moderate
evidence).
The administration of organ-specific contrast agents increases the lesion-
to-liver contrast-to-noise ratio (CNR), thereby improving the conspicuity
and detection rate of metastatic lesions. These include hepatobiliary agents
such as mangafodipir trisodium (MnDPDP) (40) and gadobenate dimeg-
lumine (Gd-BOPTA), and reticuloendothelial agents such as superpara-
magnetic iron oxide (SPIO) particles (41). The available data regarding the
need for these liver-specific agents is controversial, with some studies
showing improved results (17,42) while others do not (3,43,44). In addition
to a lack of consensus regarding the benefits associated with their use, these
agents are generally considered costly and not widely available. Thus, a
broad use of liver-specific contrast material for detecting liver metastases
is not recommended at this time.
D. Whole-Body Positron Emission Tomography
Whole body PET performed with fluorine-18-fluorodeoxyglucose (18F-
FDG) has also been used successfully for detecting extracolonic spread
of colorectal carcinoma, including liver metastases. Although published
studies have included small groups of patients, early results are encour-
aging, with sensitivity and specificity exceeding 80% (45,46). Kinkel et al.
(3) performed a meta-analysis study comparing the data available for
detection of liver metastases from gastrointestinal tract neoplasms with
noninvasive tests: US, CT, MRI, and PET. They reviewed a total of 111
studies that included over 3000 patients. At a specificity of at least 85%, the
weighted sensitivities were US 55%, CT 72%, MRI 76%, and PET 90%. The
strength of these data is moderate and they need to be validated in ran-
domized trials before broad conclusions can be drawn.
530 B.C. Lucey et al.
Chapter 28 Hepatic Disorders 531
II. What Is the Accuracy of Imaging in Patients with
Cirrhosis for the Detection of Hepatocellular Carcinoma?
Summary of Evidence: Screening for HCC in patients with cirrhosis is not
easy. No one imaging modality dominates over the others. All imaging
modalities have advantages and disadvantages with no one modality offer-
ing both high sensitivity and specificity. The results of these individual
studies often depend on the date of the study. This is primarily because
of the rapid change in technology available in all imaging modalities. A
reasonable consensus for screening includes biannual measurement of
the AFP level. Annual sonography is the imaging modality most
commonly used, as it is cheap, portable, and most widely available. If the
AFP value increases and the sonogram does not show evidence of an HCC,
either CT or MRI should be performed.
Although MRI at present has marginally higher specificity than CT, the
recent improvement in CT technology may change this soon (Fig. 28.3).
Published sensitivities for MRI range from 48% to 87% (47–50). The CT sen-
sitivities for these studies range from 47% to 71% without the use of com-
puted tomography hepatic arteriography (CTHA) or CTAP. These reports
conclude that MRI is certainly as sensitive and perhaps a little more so than
CT. The use of superparamagnetic iron oxide (SPIO) has increased the sen-
sitivity of MRI.
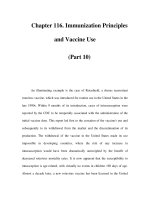
Figure 28.3. Algorithm for imaging to detect HCC in a patient with cirrhosis. AFP,
a-fetoprotein; f/u, follow-up. *6/12 means six months.
The sensitivity of sonography for detecting HCC has been reported
between 59% and 90% (51–55), with lower sensitivity for smaller lesions
(55). Ultrasound may also lead to a high percentage of false-positive
studies. Overall, there is little evidence to support the use of PET imaging
in the detection of HCC. The value of PET in this patient population lies
in detecting distant metastases, and PET may be useful in monitoring the
response to treatment.
Supporting Evidence
A. Ultrasonography
The 59% to 90% sensitivity of sonography cited above varies with lesion
size, with the sensitivity for detecting lesions 2cm or less approaching 60%,
with larger lesions having higher sensitivity (55). The sensitivity for detect-
ing HCC also depends on patient selection. Screening a population at risk
for developing HCC (i.e., chronic hepatitis carriers) is often performed dif-
ferently from screening a population with documented cirrhosis. As a
result, lesions missed by sonography in cirrhotic patients may be picked
up by CT or AFP measurement, thus masking the false-negative cases that
may be attributable to sonography (52). One major difficulty with sonog-
raphy in the detection of HCC is the high percentage of false-positive
studies. This is particularly difficult in the cirrhotic patient population as
the risk of developing HCC is higher and therefore any focal geographic
area of heterogeneity is concerning for HCC. This may lead to frequent per-
cutaneous biopsy to obtain a definitive diagnosis with the attendant mor-
bidity and mortality. Despite the difficulties of sonography, given the
widespread availability, portability, and safety of the modality, sonography
remains the imaging modality of choice for screening for HCC in cirrhotic
patients. The time interval between sonograms remains controversial.
There is no consensus as to when to perform repeat imaging; however,
authors have suggested that annual or biannual interval imaging with
sonography is the most effective approach to detecting HCC.
There is great interest in the use of intravenous contrast agents for
enhancing the value of sonography to detect and characterize liver lesions.
There are many reports describing the value of these agents in patients
with HCC (56–59). There is no doubt that these microbubbles demonstrate
increased vascularity in HCC when used, increasing the color flow within
HCC from 33% to 92% in one study (57); however, there is little published
evidence to support the value of these agents in identifying HCC from
degenerative nodules in patients with cirrhosis. Increased flow may be
detected in other hepatic lesions also and not just in HCC after injection of
the microbubbles. One potential use for the microbubbles is in the evalu-
ation of patients following RFA. The results for contrast-enhanced sonog-
raphy for detecting tumor recurrence post-RFA have been reported to be
similar to those for CT (60).
B. Computed Tomography
Computed tomography has benefited even more than sonography from
recent advances in technology. With the move from incremental CT to
532 B.C. Lucey et al.
single-detector CT to multidetector CT, the ability to detect HCC in the cir-
rhotic liver has improved. This difference in technology is the most impor-
tant consideration when attempting to compare the results of studies
performed to evaluate CT in the detection of HCC. This improvement
allows for thinner slice collimation and improved image quality. Another
technical parameter to consider is the use of dual-phase imaging. The liver
has a dual blood supply from both the hepatic artery and portal vein. In
normal livers, approximately three quarters of the blood supply comes
from the portal system. In contrast, HCC depends more on the hepatic
artery for blood supply. Therefore, ideally, imaging to detect HCC should
include images obtained in the hepatic arterial phase, usually commenc-
ing at 30 seconds after contrast administration. With the advent of multi-
detector CT, imaging in dual phase became possible and this improved
detection of HCC.
When examining the reports available for detecting HCC in cirrhotic
patients, it is important to differentiate between identifying patients with
HCC and identifying lesions that represent HCC. This fact may change the
sensitivity of an imaging modality greatly. The effect of this is clearly
demonstrated in a study by Peterson et al. (61) evaluating patients
pre–liver transplant for HCC, in which CT had a prospective sensitivity to
detect patients with HCC of 59%. This fell to 37% when attempting to
detect HCC on a lesion-by-lesion basis.
Reported sensitivity for detecting HCC by CT varies greatly. Most recent
reports yield sensitivities between 68% and 88% (5,62). These reports gen-
erally refer to the percentage of patients in whom an HCC is found. Figures
for detecting individual lesions are much lower. The value of some of these
reports is always in some doubt, however, given the previously described
rapid change in CT technology today. In an effort to improve detection of
HCC using CT, CTAP is occasionally used. This involves placing a catheter
into the splenic or superior mesenteric artery and directly injecting con-
trast. Computed tomography hepatic arteriography (CTHA) has also been
used, in which a catheter is placed directly into the hepatic artery. These
techniques have yielded high sensitivities when used together. Makita et
al. (63) found the sensitivity of CTAP alone to be 85.5%, CTHA alone to be
88.1%, and combined to be 95%. Specificity, however, suffers and the com-
bined specificity reported by that group was only 54%. Similar findings
have been reported by others (64,65) with sensitivities ranging from 82%
to 97%, although the high number of false-positive studies with these tech-
niques leads most authors to conclude that they have minimal role in the
evaluation for HCC in cirrhotic patients, particularly given the relatively
invasive nature of the procedures.
C. Magnetic Resonance Imaging
The MRI sequences used in the evaluation of the cirrhotic liver are the same
as those used for the detection of liver metastases. The use of intravenous
gadolinium is required in all cases. As with CT, the difficulty with MRI lies
in differentiating early HCC from dysplastic nodules. As nodules change
from regenerative to dysplastic to malignant, the T1 signal characteristics
become more hypointense and the T2 signal characteristics become more
hyperintense. As one moves along this spectrum, the primary blood supply
of the mass changes from predominantly portal to predominantly hepatic
Chapter 28 Hepatic Disorders 533
arterial. As a result, HCC generally demonstrates early enhancement in the
arterial phase following gadolinium injection. In the same manner as CT,
MRI technology is advancing rapidly. Some of the difficulties with MRI
include respiratory and peristalsis motion artifact. With newer, faster
sequences, these are becoming less of a problem. This therefore leaves us
to decide which imaging modality is best for detecting HCC in a cirrhotic
liver.
There are many reports published using MRI to detect HCC and many
of these compare directly with CT. The results of many of the studies per-
formed in the 1990s are extremely variable. Sensitivity in these studies for
MRI in detecting HCC lies between 44% and 75% (66–71). Although all
these studies compared MRI with CT, the results of some support CT as
the imaging modality of choice (66,67), others support MRI as the imaging
modality of choice (69,71), and yet others suggest that the imaging modal-
ities have equal capability in detecting HCC (68,70), with one report stating
that intraarterial CT is an improvement over both CT and MRI using intra-
venous contrast (68). The reasons for such discrepancy are multiple, but
certainly the lack of consistency in study design contributes to the vari-
ability. The results also vary considerably depending on the size of the
HCC identified.
The figures published comparing CT to MRI since 2000 make interest-
ing reading. Although there is not yet a clear advantage of MRI over CT,
more studies give MRI a slight edge over CT. Published sensitivities for
MRI range from 48% to 87% (47–50). Sensitivities for CT in these studies
range from 47% to 71% without the use of CTHA or CTAP. These reports
conclude that MRI is certainly as sensitive and perhaps a little more so than
CT. The use of SPIO has increased the sensitivity of MRI. Its use by Kwak
et al. (50) when combined with gadolinium-enhanced imaging increased
the sensitivity of MRI from 87% to 95%, which surpassed the sensitivity of
CTHA and CTAP combined. Other authors have reported similar advan-
tages of using SPIO (49,72), including increased sensitivity compared to CT
imaging.
D. Whole-Body Positron Emission Tomography
Although PET has been around as an imaging modality for many years, it
is only recently that the modality has been used with any frequency in the
clinical setting. The studies available for detecting HCC using PET are
few in number and generally have few patients evaluated. Three studies
looking directly at the value of PET imaging in HCC all had 20 or fewer
patients (73–75). In these studies, the sensitivity of PET for detecting HCC
was low, varying from 20% to 55%. Well-differentiated HCCs are not iden-
tified using PET imaging. Moderately differentiated or poorly differenti-
ated HCC may be identified. Tumors greater than 5 cm and tumors
associated with elevated AFP levels are also more likely to be identified
using PET. One advantage to the use of PET imaging in patients with HCC
is the ability to detect extrahepatic metastases. This is especially important
in the workup of patients with cirrhosis for liver transplant. In a larger
study evaluating PET in HCC with 91 patients (76), PET had a clinical
impact on the management of 28% of patients. This included not only
detecting unsuspected metastases but also monitoring the response to
534 B.C. Lucey et al.
therapy. Several other studies have evaluated PET in detecting HCC in
patients with hepatitis C and cirrhosis prior to transplant (77–79). These
show poor sensitivity for PET ranging from 0% to 30%.
III. What is the Cost-Effectiveness of Imaging in Patients
with Suspected Hepatocellular Carcinoma?
Summary of Evidence: A study concluded that screening all patients with
cirrhosis is of limited value given the high cost, and the benefit in terms of
patient survival is poor. However, targeted screening in high-risk patients
with HCC and imaging may yet be of value.
Supporting Evidence: There are a number of reports on the cost-effective-
ness of screening for HCC. The results of some of these studies conclude
that there is little value to be gained from screening (80–82). One such
report by Bolondi et al. (80) evaluated 324 patients with cirrhosis for HCC
using sonography and AFP every 6 months. In all, 1800 sonographic exam-
inations and AFP titrations were obtained at a cost of $219,600 per patient.
The cost of diagnosing each of the successfully treated HCC was $24,400.
The authors concluded that screening all patients with cirrhosis is of
limited value given the high cost, and the benefit in terms of patient sur-
vival is poor. Targeted screening may yet be of value according to this
group. Two similar studies reach similar conclusions (81,82). Sarasin et al.
(81) compared screening patients with cirrhosis for HCC with imaging for
HCC only when clinically suspected. The cost for each year of life gained
ranged between $48,000 and $284,000 in the screening group. The cost of
each year of life gained in the group with predicted cirrhosis-related sur-
vival rate above 80% at 5 years ranged between $26,000 and $55,000. This
suggests that screening to identify asymptomatic tumors provides a neg-
ligible benefit in life expectancy, yet targeted screening may increase life
expectancy by 3 to 9 months at a lower cost. A meta-analysis type study
by Yuen and Lai (82) concluded that AFP with sonography remains the
screening modality of choice given that they are convenient, accessible, and
noninvasive. They also concluded that screening for HCC in countries with
a low prevalence of HCC was not cost-effective but targeted screening of
high-risk patients in countries with a higher incidence of HCC makes
screening for HCC more cost-effective.
As with the studies based purely on detection of HCC, there is little con-
sensus on the most cost-effective imaging modality to use to detect HCC.
While acknowledging that screening for HCC may not be cost-effective at
all, if one is to perform imaging, which modality is most cost-effective is
open to debate. In a retrospective study, Gambarin-Gelwan et al. (83) com-
pared AFP with sonography and with CT. They found that sensitivity and
specificity of sonography and CT were similar and that sonography was
preferable given the lower cost. A similar study by Lin et al. (84) compared
AFP and sonography annually, biannually, biannual AFP with annual
sonography, and biannual AFP with annual CT. They found that biannual
AFP with annual sonography gave the most QALY gain while still main-
taining a cost-effectiveness ratio <$50,000 per QALY. In addition, they
found the cost-effectiveness ratio of biannual AFP with annual CT to be
Chapter 28 Hepatic Disorders 535
536 B.C. Lucey et al.
$51,750 per QALY. This compares to the $33,083 per QALY for sonography.
The authors suggest that CT screening may be becoming cost-effective.
This is supported by other work that evaluated the cost-effectiveness of no
screening, AFP alone, and imaging with sonography, CT, and MRI all per-
formed in conjunction with AFP levels (85). This study was performed in
a patient population with high risk for developing HCC as all patients had
cirrhosis secondary to hepatitis C. The results found that compared to no
screening, sonography had a cost of $26,689 per QALY; CT had a cost of
$25,232 per QALY and MRI had a cost of $118,000 per QALY. These figures
would certainly support the value of CT for screening; however, this study
did involve the so-called targeted screening described by the previous
authors.
Take-Home Tables and Figure
Table 28.1. Performance of various tests for diagnosis of liver metastases
from colorectal cancer
Test Sensitivity (%) References Strength of evidence
CT 71–91 10,16,25,27– Moderate
29,40,86
MRI 72 11,12,32,38–40 Moderate
MRI with organ- 87–90 17,31,33,38,40– Moderate
specific contrast 44
US 54–77 3,19,20 Moderate
PET and PET/CT 88 41,45,46 Weak to moderate
Table 28.2. Sensitivity of various imaging tests for
detecting hepatocellular carcinoma
Imaging modality Sensitivity (%)
US 59–90
US with intravenous contrast 92
CT 47–88
CTAP 85
CTHA 88
CTAP + CTHA 95
MRI 44–87
MRI + SPIO 95
PET 0–55
AFP 48–65
AFP, a-fetoprotein; CTAP, CT during arterial portography;
CTHA, computed tomography hepatic arteriography; SPIO,
superparamagnetic iron oxide.
Chapter 28 Hepatic Disorders 537
Imaging Technique Protocols
Abdominal Computed Tomography for Detection of Hepatocellular
Carcinoma Using Multirow Detector Computed Tomography
Slice thickness: 2 to 3mm
Scan parameters: 120–140kVp; 180–220mAs
Number of acquisitions: 3
Area of coverage first acquisition: top of diaphragm through the liver
Area of coverage second acquisition: top of diaphragm to inferior pubic
ramus
Area of coverage third acquisition: top of diaphragm to inferior pubic
ramus
Figure 28.4. A: Sonographic image showing large hyperechoic mass in the liver in
a 67–year-old man with chronic hepatitis C. B: CT image showing arterial enhance-
ment of multiple masses, which proved to be hepatocellular carcinoma (HCC) fol-
lowing biopsy.
538 B.C. Lucey et al.
Breath hold: full inspiration or full expiration
Reconstruction algorithm: standard
Oral contrast: 800cc 2 hours prior to imaging
Intravenous (IV) contrast: first acquisition performed without IV contrast;
second acquisition 120 to 150cc nonionic contrast injected at 3 to 4cc/sec;
30-second prescan delay; third acquisition obtained with a 60-second
delay
Liver Magnetic Resonance Imaging for Detection of Metastases or
Hepatocellular Carcinoma (Minimum Sequences)
Table 28.3. Liver magnetic resonance imaging for detection of metastases or hepatocellular
carcinoma (minimum sequences)
Slice Fat
Sequence TR TE Flip angle thickness (mm) Matrix suppression Breath hold
T1 200 4.6/2.3 80 7 192 ¥ No Yes
gradient-echo 256
axial in and
out of phase
T2 dual echo, 2350 40/140 90 6 256 ¥ Yes No,
fast spin-echo 512 respiratory
triggered
Precontrast T1 200 4.6 80 7 192 ¥ Yes Yes
fat-suppressed 256
gradient-echo
Dynamic 3.5 1.7 10 2 192 ¥ Yes Yes
gadolinium 20 cc 256
IV
Precontrast T1 200 4.6 80 7 192 ¥ Yes Yes
fat-suppressed 256
gradient-echo
Future Research
1. A randomized, multicenter, trial comparing the performance of state-of-
the-art CT, MRI and PET-CT for detecting colorectal cancer metastases
is highly desirable at this time.
2. Need to develop an imaging modality that will differentiate dysplastic
nodules from HCC.
3. Need to identify HCC earlier. Study design similar to the one shown for
colorectal cancer metastases above is recommended—relates to entry 1,
above.
4. The role of PET and PET-CT in these populations of patients should con-
tinue to be explored.
5. Molecular imaging and tagging HCC cells will be the future of screen-
ing; CT and MRI are operating at the limits of their sensitivity and
specificity.
References
1. Ohlsson B, Tranberg KG, Lundstedt C, Ekberg H, Helderestrom E. Eur J Surg
1993;159:275–281.
2. Moertel CG, Fleming TR, Macdonald JS, Haller DG, Laurie JA, Tangen C. JAMA
1993;270:943–947.
3. Kinkel K, Lu Y, Both M, Warren RS, Thoeni RF. Radiology 2002;224:748–756.
4. Maringhini A, Cottone M, Sciarrino E, et al. Dig Dis Sci 1988;33(1):47–51.
5. Chalasani N, Horlander JC Sr, Said A, et al. Am J Gastroenterol 1999;94(10):
2988–2993.
6. Scheele J, Stang R, Altendorf-Hofmann A, Paul M. World J Surg 1995;19:
1959–1971.
7. Fong Y, Cohen AM, Fortner JG, et al. J Clin Oncol 1997;15:938–946.
8. Fusai G, Davidson BR. Management of colorectal liver metastases. Colorectal
Dis 2003;5:2–23.
9. Gazelle GS, Hunin MG, Kuntz KM, et al. Ann Surg 2003;237:544–555.
10. Pijl MEJ, Wasser MNJM, Joekes EC, van de Velde CJH, Bloem JL. Radiology
2003;227:747–751.
11. Semelka RC, Shoenut JP, Asher SM, et al. J Magn Reson Imaging 1994;4:319–323.
12. Semelka RC, Worawattanakul S, Kelekis NL, et al. J Magn Reson Imaging 1997;
7:1040–1047.
13. Zerhouni EA, Rutter C, Hamilton SR, et al. Radiology 1996;200:443–451.
14. Conlon R, Jacobs M, Dasgupta D, Lodge JP. Eur J Ultrasound 2003;6:211–
216.
15. Hartley JE, Kumar H, Drew PJ, et al. Dis Colon Rectum 2000;43:320–324.
16. Soyer P, Poccard M, Boudiaf M, et al. Radiology 2004;231:413–420.
17. Strotzer M, Gmeinwieser J, Schmidt J, et al. Acta Radiol 1997;38:986–992.
18. van Erkel AR, Pijl MEJ, van den Berg-Husymans AA, Wasser MNJM, van de
Velde CJH, Bloem JL. Radiology 2002;224:4040–4094.
19. Tempero MA, Williams CA, Anderson JC. J Clin Oncol 1986;4:1074–1078.
20. Grace RH, Hale M, Mackie G, Marks CG, Bloomberg TJ, Walker WJ. Br J Surg
1987;74:480–481.
21. Hohmann J, Albrecht T, Oldenburg A, Skrok J, Wolf KJ. Abdomin Imagin
2004;29.
22. Albrecht T, Blomkey MJK, Burns PN, et al. Radiology 2003;227;361–370.
23. Silverman PM, Kohan L, Ducic I. AJR 1998;170:149–152.
24. Freeny PC, Gardner JC, vonIngersleben G, Heyano S, Nghiem HV, Winter TC.
Radiology 1995;197:89–93.
25. Valls C, Andia E, Sanchez A, et al. Radiology 2001;218:55–60.
26. Miller FH, Butler RS, Hoff FL, Fitzgerald SW, Nemcek AA, Gore RM. AJR 1998;
171:643–649.
27. Scott DJ, Guthrie JA, Arnold P, et al. Clin Radiol 2001;56:235–242.
28. Haider MA, Amitai MM, Rappaport DC. Radiology 2002;225:137–142.
29. Weg N, Scheer MR, Gabor MP. Radiology 1998;209:417–426.
30. Schwartz LH, Gandras EJ, Colangelo SM, Ercolani MC, Panicek DM. Radiology
1999;210:71–74.
31. Soyer P, Levesque M, Caudron C, Elias D, Zeitoun G, Roche A. J Comput Assist
Tomogr 1993;17:67–74.
32. Kondo H, Kanematsu M, Hoshi H, et al. AJR 2000;174:947–954.
33. Seneterre E, Taourel P, Bouvier Y, et al. Radiology 1996;200:785–792.
34. McFarland EG, Mayo SW, Saini S, Hahn PF, Goldberg MA, Lee MJ. Radiology
1994;193:43–47.
35. Tello R, Fenlon HM, Gagliano T, de Carvalho VLS, Yucel EK. AJR 2001;176:
870–884.
36. Wittenberg J, Stark DD, Forman BH, et al. AJR 1988;151:79–84.
37. Outwater E, Tomaszewski JE, Daly JM, Kressel HY. Radiology 1991;180:327–332.
38. Yamashita Y, Tank Y, Namimoto T, Mitsuzaki K, Takahashi M. Radiology 1998;
207:331–337.
39. Kanematsu M, Hoshi H, Murakami T, et al. Radiology 1999;211:363–371.
40. Bartolozzi C, Donati F, Cioni D, et al. Eur Radiol 2004;14:14–20.
41. Vogl TJ, Schwarz W, Blume S, et al. Eur Radiol 2003;13:262–272.
Chapter 28 Hepatic Disorders 539
42. Ward J, Naik KS, Guthrie JA, Wilson D, Robinson PJ. Radiology 1999;210:
459–466.
43. Said B, McCart JA, Libutti SK, Choyke PL. Magn Reson Imaging 2000;18:
305–309.
44. Matsuo M, Kanematsu M, Itoh K, et al. AJR 2001;177:637–643.
45. Kantorova I, Lipska L, Belohlavek O, Visokai V, Trubac M, Schneiderova M. J
Nucl Med 2003;44:1784–1788.
46. Abdel-Nabi H, Doerr RJ, Lamonica DM, et al. Radiology 1998;206:755–760.
47. Noguchi Y, Murakami T, Kim T, et al. J Comput Assist Tomogr 2002 Nov-Dec;
26(6):981–987.
48. Noguchi Y, Murakami T, Kim T, et al. AJR 2003;180(2):455–460.
49. Hori M, Murakami T, Kim T, et al. J Comput Assist Tomogr 2002;26(5):701–710.
50. Kwak HS, Lee JM, Kim CS. Eur Radiol 2004;14(3):447–457.
51. Shinagawa T, Ohto M, Kimura K, et al. Gastroenterology 1984;86(3):495–502.
52. Okazaki N, Yoshida T, Yoshino M, Matue H. Clin Oncol 1984;10(3):241–246.
53. Ikeda K, Saitoh S, Koida I, et al. Hepatology 1994;20(1 pt 1):82–7.
54. Tanaka S, Kitamura T, Ohshima A, et al. Cancer 1986;58(2):344–347.
55. Okano H, Shiraki K, Inoue H, et al. Anticancer Res 2001;21(4B):2979–2982.
56. Angeli E, Carpanelli R, Crespi G, Zanello A, Sironi S, Del Maschio A. Radiol
Med (Torino) 1994;87(5 suppl 1):24–31.
57. Maruyama H, Matsutani S, Sato G, et al. Abdom Imaging 2000;25(2):164–171.
58. Khong PL, Chau MT, Fan ST, Leong LL. Australas Radiol 1999;43(2):156–159.
59. Choi BI, Kim AY, Lee JY, et al. J Ultrasound Med 2002;21(1):77–84.
60. Shimizu M, Iijima H, Horibe T, et al. Hepatol Res 2004;29(4):235–242.
61. Peterson MS, Baron RL, Marsh JW Jr, Oliver JH 3rd, Confer SR, Hunt LE. Radi-
ology 2000;217(3):743–749.
62. Bhattacharjya S, Bhattacharjya T, Quaglia A, et al. Dig Surg 2004;21(2):152–159.
63. Makita O, Yamashita Y, Arakawa A, et al. Acta Radiol 2000;41(5):464–469.
64. Matsuo M, Kanematsu M, Inaba Y, et al. Clin Radiol 2001;56(2):138–145.
65. Jang HJ, Lim JH, Lee SJ, Park CK, Park HS, Do YS. Radiology 2000;215(2):
373–380.
66. Hori M, Murakami T, Oi H, et al. Acta Radiol 1998;39(2):144–151.
67. Kanematsu M, Hoshi H, Murakami T, et al. AJR 1997;169(6):1507–1515.
68. Murakami T, Kim T, Oi H, et al. Acta Radiol 1995;36(4):372–376.
69. Oi H, Murakami T, Kim T, Matsushita M, Kishimoto H, Nakamura H. AJR
1996;166(2):369–374.
70. Kim T, Murakami T, Oi H, et al. J Comput Assist Tomogr 1995;19(6):948–954.
71. Yamashita Y, Mitsuzaki K, Yi T, et al. Radiology 1996;200(1):79–84.
72. Lee JM, Kim IH, Kwak HS, Youk JH, Han YM, Kim CS. Korean J Radiol 2003;
4(1):1–8.
73. Trojan J, Schroeder O, Raedle J, et al. Am J Gastroenterol 1999;94(11):3314–3319.
74. Khan MA, Combs CS, Brunt EM, et al. J Hepatol 2000;32(5):792–797.
75. Verhoef C, Valkema R, de Man RA, Krenning EP, Yzermans JN. Liver 2002;
22(1):51–56.
76. Wudel LJ Jr, Delbeke D, Morris D, et al. Am Surg 2003;69(2):117–124.
77. Liangpunsakul S, Agarwal D, Horlander JC, Kieff B, Chalasani N. Transplant
Proc 2003;35(8):2995–2997.
78. Schroder O, Trojan J, Zeuzem S, Baum RP. Nuklearmedizin 1998;37(8):279–285.
79. Teefey SA, Hildeboldt CC, Dehdashti F, et al. Radiology 2003;226(2):533–542.
80. Bolondi L, Gaiani S, Casali A, Serra C, Piscaglia F. Radiol Med (Torino) 1997;
94(1–2):4–7.
81. Sarasin FP, Giostra E, Hadengue A. Am J Med 1996;101(4):422–434.
82. Yuen MF, Lai CL. Ann Oncol 2003;14(10):1463–1467.
83. Gambarin-Gelwan M, Wolf DC, Shapiro R, Schwartz ME, Min AD. Am J
Gastroenterol 2000;95(6):1535–1538.
84. Lin OS, Keeffe EB, Sanders GD, Owens DK. C. Aliment Pharmacol Ther
2004;19(11):1159–1172.
540 B.C. Lucey et al.
85. Arguedas MR, Chen VK, Eloubeidi MA, Fallon MB. Am J Gastroenterol 2003;
98(3):679–690.
86. Lopez Hanninen E, Vogl TJ, Felfe R, et al. Radiology 2000;216:403–409.
Chapter 28 Hepatic Disorders 541
29
Imaging of Nephrolithiasis,
Urinary Tract Infections,
and Their Complications
Julia R. Fielding and Raj S. Pruthi
Issues of Imaging of Nephrolithiasis
I. What is the appropriate test for suspicion of obstructing ureteral
stone?
II. How should stones be followed after treatment?
III. Special case: the pregnant patient
Issues of Imaging of Urinary Tract Infections
IV. When is imaging required in the adult female with a urinary tract
infection?
V. When is imaging required in the adult male with a urinary tract
infection?
VI. When is imaging required in the child with a urinary tract
infection?
VII. Special case: the neurogenic bladder
542
Nephrolithiasis
Non–contrast-enhanced helical computed tomography (CT) with
5-mm slice thickness is the test of choice for the patient with a sus-
pected obstructing ureteral stone. In the absence of an available CT
scanner, intravenous urography (IVU) or a combination of plain film
and ultrasonography (US) should be performed (moderate evidence).
Plain film should be used to follow the descent of stones along the
ureter (moderate evidence).
For the pregnant patient with a suspected renal stone, there is insuf-
ficient evidence to determine whether IVU or CT is the appropriate
test when US is not diagnostic (insufficient evidence).
Issues
Key Points
Chapter 29 Imaging of Nephrolithiasis, Urinary Tract Infections, and Their Complications 543
Urinary Tract Infection
Uncomplicated urinary tract infections (UTIs) in women, those
without systemic signs or symptoms, do not require imaging
(moderate evidence).
Complicated UTIs in women, those that occur in combination with
pregnancy or with symptoms that extend beyond 10 days and evolve
to include fever, chills, and flank pain may require imaging to exclude
renal abscess. It is unclear what clinical finding should prompt
imaging and whether CT or US should be performed (insufficient
evidence).
Uncomplicated, isolated UTIs in men are uncommon. It is unclear
when US or cystoscopy should be performed to exclude associated
infection of the testis or epididymis and bladder cancer, respectively
(insufficient evidence).
Because of the high likelihood of vesicoureteral reflux in children with
UTIs, US and voiding cystourethrogram (VCUG) should be per-
formed in children with a UTI (moderate evidence). At most acade-
mic institutions in the United States, both US and VCUG are
performed in boys and girls to exclude hydronephrosis, significant
renal scars, and vesicoureteral reflux. Nuclear medicine cystogram
may be substituted for VCUG; however, the currently used low-dose
fluoroscopy units and higher spatial resolution make VCUG the more
commonly used test.
Patients with neurogenic bladders often have colonized the urine
with pathogens. They may demonstrate few signs and symptoms
when developing a complicated infection. It is unclear when and
what type of imaging should be performed (insufficient evidence).
Definition and Pathophysiology
Urolithiasis is the presence of stones within the urinary tract. Some patients
with stones in the kidney live out their lives without incident. Many
patients suffer from hematuria as the stones grow and move within the
renal pelves and experience severe flank pain when the stone(s) become
lodged in the ureter. The most common renal stones in the United States
are calcium based and are formed at the tip of the papilla when excess
calcium is excreted into the urine. Less common stone varieties include
those made of uric acid, struvite (ammonium/magnesium/phosphate),
cystine, and xanthine.
Urinary tract infection occurs when urine stasis or an altered local resis-
tance allows a bacterial pathogen to grow in the bladder. Patients complain
of pain and usually have a urinalysis positive for the presence of white
blood cells (>100,000 organisms/1mL of urine) and bacterial organisms.
On occasion, the infectious process will ascend the ureter to involve the
intrarenal collecting system and renal cortex leading to pyelonephritis and
renal abscess. With certain organisms, such as tuberculosis, the bacteria
may be hematogenously seeded into the renal cortex and the infectious
process descends into the bladder.
Epidemiology
Nephrolithiasis is a common problem of people living in temperate cli-
mates. It is estimated that at least 5% of female and 12% of the male pop-
ulation will have at least one episode of renal colic due to stone disease by
the age of 70 years (1). In the U.S., the majority of stone disease cases are
seen in the southeastern part of the country where diet, genetic predispo-
sition, and certain occupations all may predispose to stone formation.
Nephrolithiasis is three times more common in males. The peak age for
onset of renal stone disease is age 20 to 30, but stone formation is often a
lifelong problem. Stone disease is rare in children.
Urinary Tract Infection
Because of the short female urethra, it is much easier for bacteria to ascend
into the bladder and therefore the vast preponderance of infections occur
in females, particularly in children and women of childbearing age. During
any given year, 11% of women report having had a UTI and more than half
of all women has at least one such infection during their lifetime (2). After
the age of 50, the number of infections in males and females is nearly equal,
likely because the bladder outlet obstruction due to enlargement of the
prostate in males leads to urine stasis.
Overall Cost to Society
Nephrolithiasis
Because nephrolithiasis is such a common process, the cumulative expense
of imaging and clinical evaluations is quite high. In 1995 Clark et al. (3)
estimated the annual cost of nephrolithiasis in the U.S. to be $1.23 billion,
with the cost of outpatient evaluation at $278 million.
Urinary Tract Infection
Again, because UTIs are extremely common, the cost of diagnosis and
treatment is very high. Each year in the U.S., uncomplicated acute cystitis
is responsible for 3.6 million office visits, accounting for direct costs of $1.6
billion (4,5). The majority of patients are treated based on symptomatology
and the results of a urine dipstick detecting the presence of nitrite of leuko-
cyte esterase. Only a small percentage of these patients will undergo
imaging as part of the workup, usually when structural abnormalities of
the urinary tract are suspected or the patient fails treatment and develops
signs of an upper tract infection.
Goals
The goal of imaging in the case of nephrolithiasis is twofold: first, to deter-
mine the presence or absence of an obstructing ureteral stone; and second,
to contribute to treatment planning. In a patient who chronically forms
stones, imaging can also be used to follow renal stone burden. Imaging of
UTIs is undertaken to identify complications, specifically renal abscess. In
544 J.R. Fielding and R.S. Pruthi
children with UTIs, imaging is undertaken to exclude vesicoureteral reflux
or renal scarring.
Methodology
A Medline search was performed using PubMed (National Library of
Medicine, Bethesda, Maryland) for original research publications relating
the diagnostic performance and accuracy for imaging of nephrolithiasis
and UTIs. Clinical indicators of urinary tract disease including hematuria
and flank pain were also included. The search covered the period 1966 to
March 2004. The search strategy employed different combinations of the
following terms: (1) nephrolithiasis, (2) renal abscess, (3) UTI, and (4) radiog-
raphy or imaging or computed tomography or intravenous urography or ultra-
sound. This search was limited to the English language and human studies.
Using the Limits feature of PubMed and the above terms, the database was
also searched specifically for clinical trials and meta-analyses. After review
of the abstracts of the search results, we reviewed the entire text of rele-
vant articles. In addition, additional pertinent publications were gleaned
from a review of the reference lists.
I. What Is the Appropriate Test for Suspicion of
Obstructing Ureteral Stone?
Summary of Evidence: Patients with clinical signs and symptoms of renal
obstruction should undergo unenhanced helical CT of the abdomen and
pelvis. The accuracy of this test has been shown to be higher than that of
IVU and a combination of US and plain film in level II (moderate evidence)
studies. In addition, CT is quick to perform and interpret and does not
require the administration of intravenous contrast medium. Findings on
the CT scan can be used by the referring physician to determine treatment.
The drawbacks of the technique include cost and a relatively high dose of
ionizing radiation (30–40mSv). When CT is not available either IVU or a
combination of plain film and sonography may be used.
Supporting Evidence: For many years, IVU served as the test of choice for
identification of obstructing ureteral stones. Following administration of
intravenous contrast medium, delayed renal enhancement and excretion
and a filling defect within the ureter were diagnostic findings. Because this
test dates to the beginning of modern radiology, no prospective studies
were performed to determine its accuracy. It was one of the few imaging
tests available. In recent years, level II and III (moderate and limited
evidence) studies have revealed an accuracy between 85% and 90% (6,7).
Unfortunately, the IVU, while accurate, often requires several hours to
perform. In addition, the excretion of contrast into the dilated ureter tends
to increase the patient’s already severe pain.
An alternative imaging scenario used commonly in Europe and the Far
East combines a plain film with an ultrasound examination. In a level II
(moderate evidence) study comparing IVU and US in the identification of
ureteral stones, both modalities revealed 44 stones for a sensitivity of 64%
(8). More recently, unenhanced helical CT has become the preeminent test
for the diagnosis of renal colic in the U.S. In one of the largest published
Chapter 29 Imaging of Nephrolithiasis, Urinary Tract Infections, and Their Complications 545
series, 210 patients with a confirmed diagnosis for flank pain underwent
helical CT (9); 100 stones were recovered and 30 patients were found to
have a source for pain beyond the urinary tract. There were three false neg-
atives and four false positives for stone disease. These data yield a sensi-
tivity of 97%, specificity of 96%, and accuracy of 97% for the diagnosis of
obstructing ureteral stone. Of note, all stones are radiodense on CT with
the exception of the urinary concretions formed by HIV patients taking
protease inhibitors (10,11). Similar level II (moderate evidence) clinical
studies have been performed by multiple groups with reported diagnostic
accuracies ranging from 0.90 to 0.97, high interobserver reliability, and
accurate depiction of stone size (12–15). Level II (moderate evidence) and
level III (limited evidence) studies have also shown that stone size, shape,
and location can be used to determine whether the stone will pass spon-
taneously or is likely to require intervention (12,14). Stones that are 5mm
or less in size, of regular shape, are located in the distal two thirds of the
ureter, and are present on one or two consecutive CT images 5mm in thick-
ness are most likely to pass spontaneously. These same studies also demon-
strate an alternative source for flank pain in 15% of cases, including ovarian
masses, appendicitis, and diverticulitis.
In a level II (moderate evidence) study comparing the combination of
plain film and sonography with unenhanced CT in 181 patients with flank
pain, CT was found to have a greater sensitivity (92% vs. 77%), negative
predictive value (87% vs. 68%), and overall accuracy (94% vs. 83%) for
identification of flank pain (16). Sourtzis et al. (6) reported similar results
in a level III (limited evidence) study. When CT was compared with both
IVU and sonography in 64 patients with recovered ureteral stones, sensi-
tivities were 94%, 52%, and 19%, respectively (7).
II. How Should Stones Be Followed After Treatment?
Summary of Evidence: Because plain film has the highest spatial resolution
of any imaging modality, has good contrast sensitivity, is inexpensive, and
delivers minimal radiation dose, it is at present the best way to follow the
passage of a stone down the ureter over time.
Supporting Evidence: Level II and III (moderate and limited evidence)
studies report that 60% of ureteral stones are visible on plain radiography
(17,18). The low detection rate is likely due to overlying fecal material and
the presence of some radiolucent stones, such as those composed of uric
acid. Despite the relatively low detection rate, the use of repeat CT studies
is likely not justified because of the cumulative radiation dose. An excep-
tion may be made when following the results of lithotripsy and the detec-
tion of small intrarenal stone fragments is of importance.
III. Special Case: The Pregnant Patient
Summary of Evidence: There is no compelling published evidence that IVU,
plain film, and sonography or helical CT is the preferred test. In dealing
with the pregnant patient, fetal age and estimated radiation dose is of para-
mount importance. Pregnant patients routinely have right hydronephrosis
as the enlarging uterus turns slightly to the right, compressing the ureter.
546 J.R. Fielding and R.S. Pruthi
Computed tomography, the most accurate test, delivers approximately 16
mSv to the fetus. Two plain films obtained prior to and after administra-
tion of intravenous contrast material deliver significantly less radiation but
may be more difficult to interpret because of the overlying bony fetal parts
and lateral deviation of the ureters. Dilation of the left ureter is thought to
be less common, and the presence of left hydronephrosis with flank pain
or hematuria is often enough clinical evidence for clinicians to begin treat-
ment for stone disease.
IV. When Is Imaging Required in the Adult Female with a
Urinary Tract Infection?
Summary of Evidence: Level II (moderate evidence) studies have revealed
that IVU and US are of little value in males or females in the diagnosis of
uncomplicated UTIs in which symptoms are confined to the pelvis. In eval-
uating recurrent UTIs, IVU may be of some use, particularly when a struc-
tural abnormality of the urinary tract is suspected. There is no compelling
evidence to determine when and how imaging of complicated UTIs should
be performed. Complicated infections include those in which symptoms
exceed 10 days, there is coexisting pregnancy, or symptoms evolve to
include fever, chills, and flank pain.
Supporting Evidence: In a study of 328 patients referred for imaging of the
urinary tract performed by Lewis-Jones et al. (19) in the United Kingdom,
the small subset with a positive urine culture and UTI (n = 33) had no
abnormalities detected using either IVU or US. In a similar study per-
formed by Little et al. (20), 200 consecutive patients were evaluated for a
variety of complaints using IVU. In the subset of patients with recurrent
UTI (n = 60) five patients (8%) had abnormalities including at least one case
of carcinoma.
Urinary tract infection is the most common medical complication of
pregnancy. Although pregnant women are at no greater risk for develop-
ing an uncomplicated UTI, the compression of the bladder and uterus
on the ureters is thought to lead to a higher incidence of reflux and
pyelonephritis. For asymptomatic patients, treatment is usually antibiotics
on an outpatient basis. The exception would be group B streptococcus,
which usually requires inpatient intravenous antibiotic treatment because
of its association with neonatal sepsis (21).
There is no compelling evidence to suggest when CT or US should be
performed when a renal abscess is suspected. Opinion articles, level IV
(insufficient evidence), suggest that development of the appropriate clini-
cal symptomatology despite treatment with antibiotics for 10 days should
prompt imaging (22,23).
V. When Is Imaging Required in the Adult Male with a
Urinary Tract Infection?
Summary of Evidence: There is no compelling evidence to indicate the role
of imaging in men with UTIs. Isolated UTIs are uncommon. Associated dis-
orders such as orchitis, epididymitis, and prostate enlargement can be
detected using US. It is possible that IVU and other contrast studies may
Chapter 29 Imaging of Nephrolithiasis, Urinary Tract Infections, and Their Complications 547
be of use when stones or strictures of the ureter are suspected; however,
there is no compelling evidence to support this (20).
VI. When is Imaging Required in the Child with a
Urinary Tract Infection?
Summary of Evidence: During the first 6 years of life, 8% of all girls and 2%
of all boys will have a symptomatic UTI (24). The diagnosis is confirmed
by the presence of bacterial organisms and white blood cells in the urine.
Diagnosis of pyelonephritis in small children who cannot communicate the
location of pain remains a challenge. In a study of 919 girls undergoing
a first imaging evaluation for UTI, Gelfand et al. (25) found that vesi-
coureteral reflux was extremely uncommon in girls with a fever less than
38.5°C and greater than 10 years of age. Because UTIs can be associated
with vesicoureteral reflux, the standard imaging algorithm consists of a
voiding fluoroscopic or nuclear cystourethrogram and a renal US.
Supporting Evidence: Level II (moderate evidence) suggests that the current
model of VCUG and US is appropriate. Kass et al. (26) examined 453 chil-
dren with UTI using ultrasound and VCUG; 152 had normal renal US, of
whom 101 also had normal VCUG. Vesicoureteral reflux was identified on
VCUG in 23 (23%) of patients with normal sonography. Similar results
were obtained by Goldman et al. (27), who studied 45 male neonates pre-
senting with a first UTI. Both investigators suggested that US and VCUG
should be routinely performed. Power Doppler may improve the sensitiv-
ity of US. In a level II (moderate evidence) study of 19 children with
pyelonephritis as diagnosed by clinical symptomatology and contrast-
enhanced CT, power Doppler US identified 89% of cases (28). For patient
convenience and because of the high loss to follow-up, most institutions
perform a US and VCUG on the same day. Despite its lower radiation dose,
nuclear cystogram has fallen out of favor in many areas of the U.S. because
referring urologists require a clear assessment of ureteral anatomy and
because new fluoroscopic equipment allows acquisition of 7 frames/sec,
decreasing the amount of radiation received by the child by 75% compared
with standard adult fluoroscopic technique.
Nuclear cystogram using technetium-99m (Tc-99m)-labeled dimercapto-
succinic acid (DMSA) may be of particular value in girls, for whom ure-
thral obstruction is not an issue or for follow-up of well-documented
vesicoureteral reflux. Level II, moderate evidence, studies have shown an
increase in the incidence (25–45%) of vesicoureteral reflux in siblings
afflicted with the disease (29,30). For this reason, siblings under 10 years
of age are often tested for reflux. Laboratory studies have shown that sen-
sitivity of Tc-99m DMSA for diagnosis of pyelonephritis in a piglet model
is approximately 90% (31,32). In a large retrospective level II (moderate
evidence) study of inpatients and outpatients, Desphande and Jones (33)
found renal scarring present on DMSA scans in 2% of the outpatients and
33% of inpatients, indicating that clinical findings of severe disease may be
important in deciding on this imaging algorithm. There is no compelling
evidence describing the imaging findings of CT or magnetic resonance
imaging (MRI) in the diagnosis of pyelonephritis in adults or children.
Case series of CT scans often describe a striated nephrogram or diminished
548 J.R. Fielding and R.S. Pruthi