Engineering - Materials Selection in Mechanical Design Part 16 pdf
Bạn đang xem bản rút gọn của tài liệu. Xem và tải ngay bản đầy đủ của tài liệu tại đây (753.48 KB, 12 trang )
Forces for change
16.1
Introduction and synopsis
Materials are evolving faster now than at any previous time in history. The speed of change was
suggested by Figure
1.2:
new polymers, elastomers, ceramics and composites are under development;
and new processing routes offer cheaper, more reproducible production of conventional materials.
These changes are driven by a number of forces. First, there is the
marker-pull:
the demand from
industry for materials which are lighter, stiffer, stronger, tougher, cheaper and more tolerant of
extremes of temperature and environment. Then there is the
science-push:
the curiosity-driven
researches of materials experts in the laboratories of universities, industries and government. Beyond
this, there are
global issues:
the desire of society to minimize environmental damage, to save
energy, and to reuse rather than discard. Finally, there is the driving force of what might be called
mega-projects:
historically, the Manhattan Project, the space-race and various defence programmes;
today, one might think of alternative energy technology, the problems of maintaining an ageing
infrastructure of drainage, roads, bridges and aircraft, and environmental problems associated with
industrialization.
This chapter examines these forces for change and the directions in which they push materials
and their deployment.
16.2
The market
pull:
economy versus performance
The end-users of materials are the manufacturing industries. They decide which material they will
purchase, and adapt their designs to make best use of them. Their decisions are based on the nature
of their products. Materials for large civil structures (which might weigh 10 000 tonnes or more)
must be cheap; economy is the overriding consideration.
By
contrast, the cost of the materials for
biomredical applications (an artificial heart valve, for instance) is almost irrelevant; performance,
not economy, dictates the choice.
The market price of a product has several contributions. One is the cost of the materials of which
the product is made, but there is also the cost of the research and development which went into
its design, the cost of manufacture and marketing and the perceived value associated with fashion,
scarcity, lack of competition and such like. When the material costs are a large part of the market
value (50%, say)
-
that
is
,
when the value added to the material is small
-
the manufacturer seeks
to economize on materials to increase profit or market share. When, by contrast, material costs are
a tiny fraction of the market value
(1
%,
say), the manufacturer seeks the materials which will most
improve the performance of the produce with little concern for their cost.
With this background, examine Figures 16.1 and 16.2. The vertical axis is the price per unit
weight (£/kg or $/kg), applied to both materials and products: it gives a common measure by which
364
Materials Selection in Mechanical Design
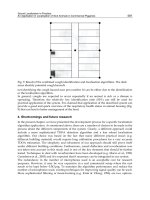
Fig.
16.1
The cost-per-unit-weight diagrams
for
materials. The shaded band spans the range in which
lie
the widely used commodity materials
of
manufacture and construction.
materials and products can be compared. The measure is
a
crude one but has the great merit that
it
is unambiguous, easily determined, and bears some relationship to value-added.
A
product with
a
pricekg which is twice that of its materials is material-intensive and is sensitive
to
material
costs; one with
a
pricekg which is
100
times that
of
its materials is insensitive to material costs,
and is probably performance-driven rather than cost-driven. On this scale the cost per
kg
of a
contact lens differs from that of
a
glass bottle by a factor of
IO5,
even though both are made of
almost the same glass; the cost per kg
of
a heart valve differs from that
of
a plastic bottle by a
similar factor, even though both are made of polyethylene. There
is
obviously something to be
learned here.
Forces for change
365
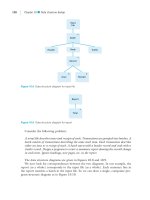
Fig.
16.2
The cost-per-unit-weight diagram for products. The shaded band spans the range in which
lie most
of
the materials of which they are made. Products in the shaded band are material-intensive;
those above it are not.
Look first at the price per unit weight of materials (Figure 16.1). The bulk, ‘commodity’ materials
of construction and manufacture lie in the shaded band; they all cost between
E0.05
and ElOkg, or
$0.7
and $16kg. Construction materials like brick, concrete, wood and structural steel, lie at the
lower end; high-tech materials, like titanium alloys, lie at the upper. Polymers span a similar range:
polyethylene at the bottom, polytetrafluorethylene (PTFE) near the
top.
Composites lie higher, with
GFRP at the bottom and CFRP at the top
of
the range. Engineering ceramics, at present, lie higher
still, though this will change as production increases. Only the low-volume ‘exotic’ materials lie
much above the shaded band.
The price per kg
of
products (Figure
16.2)
shows a different distribution. Eight market sectors
are shown, covering much
of
the manufacturing industry. The shaded band on this figure spans the
cost
of
commodity materials, exactly as in the previous figure. Sectors and their products within
366
Materials Selection
in
Mechanical Design
the shaded band shave the characteristic that material cost is a major fraction of product price:
about
50%
in civil construction, large marine structures and some consumer packaging, falling
to perhaps
20%
as the top of the band is approached (family car
-
around
25%).
The value
added
in
converting material to product
in
these sectors is relatively low, but the market volume
is large. These constraints condition the choice of materials: they must meet modest performance
requirements at the lowest possible cost. The associated market sectors generate a driving force for
improved processing of conventional materials in order to reduce cost without
loss
of performance,
or
to
increase reliability at no increase in cost. For these sectors, incremental improvements in well-
tried materials are far more important than revolutionary research-findings. Slight improvements
in
steels,
in
precision manufacturing methods, or in lubrication technology are quickly assimilated
and used.
The products in the upper half of the diagram are technically more sophisticated. The materials
of which they are made account for less than
10%
-
sometimes less than
1%
-
of the price of
the product. The value added to the material during manufacture is high. Product competitiveness
is closely linked to material performance. Designers in these sectors have greater freedom in their
choice of material and there is a readier acceptance of new materials with attractive property-
profiles. The market-pull here is for performance, with cost as a secondary consideration. These
smaller volume, higher value-added sectors drive the development of new or improved materials
with enhanced performance: materials which are lighter, or stiffer, or stronger, or tougher, or expand
less, or conduct better
-
or all of these at once.
The sectors have been ordered to form an ascending sequence, prompting the question: what
does the horizontal axis measure? Many factors are involved here, one of which can be identified as
‘information content’. The accumulated knowledge involved in the production of a contact lens or
a
heart valve is clearly greater than that in
a
beer-glass or a plastic bottle. The sectors on the left make
few demands on the materials they employ; those on the right push materials to their limits, and
at the same time demand the highest reliability. These features make them information-intensive.
But
there are also other factors: market size, competition (or lack of it), perceived value, fashion
and taste, and
so
on. For this reason the diagram should not be over-interpreted: it is a help in
structuring information, but it is not a quantitative tool.
The manufacturing industry. even
in
times of recession, has substantial resources; and it is in the
interests of government to support their needs. The market pull is, ultimately, the strongest force
for change.
16.3
The science-push: curiosity-driven research
Curiosity may kill cats, but it is the life-blood of innovative engineering. Technically advanced
countries sustain the flow of new ideas by supporting research in three kinds of organization:
universities, government laboratories and industrial research laboratories. Some of the scientists
and engineers working in these institutions are encouraged to pursue ideas which may have no
immediate economic objective, but which can evolve into the materials and manufacturing methods
of future decades. Numerous now-commercial materials started in this way. Aluminium, in the time
of Napoleon
111,
was
a
scientific wonder
-
he commissioned a set of aluminium spoons for which
he paid more than those of solid silver. Aluminium was not, at that time,
a
commercial success; now
it
is. Titanium, more recently, has had a similar history. Amorphous
(=
non-crystalline) metals, now
important in transformer technology and in recording-heads
of
tape decks, were, for years, of only
academic interest. It seems improbable that superconductors
or
semiconductors would have been
Forces
for
change
367
discovered in response to market forces alone; it took long-term curiosity-driven research to carry
them to the point that they became commercially attractive. Polyethylene was discovered by chemists
studying the effect of pressure on chemical reactions, not by the sales or marketing departments of
multinational corporations. History is dotted with examples of materials and processes which have
developed from the inquisitiveness of individuals.
What new ideas are churning in the minds of the materials scientists of today? There are many,
some already on the verge of commercialization, others for which the potential is not yet clear.
Some, at least, will provide opportunities for innovation; the best may create new markets.
Monolithic ceramics,
now produced in commercial quantities, offer high hardness, chemical
stability, wear resistance and resistance to extreme temperatures. Their use as substrates for microcir-
cuits is established; their use in wear-resistant applications is growing, and their use in heat engines
is being explored. The emphasis in the development of
composite materials
is shifting towards those
which can support loads at higher temperatures. Metal-matrix composites (example: the aluminium
containing particles or fibres
of
silicon-carbide
of
Section
14.7)
and intermetallic-matrix compos-
ites (titanium-aluminide or molybdenum-disilicide containing silicon-carbide, for instance) can do
this.
So,
potentially, can ceramic-matrix composites (alumina with silicon carbide fibres) though the
extreme brittleness of these materials requires new design techniques. Metallic foams, up to
90%
less dense than the parent metal, promise light, stiff sandwich structures competing with composites.
A number of new techniques of
su$ace engineering
allows the alloying, coating or heat treating
of a thin surface layer of a component, modifying its properties to enhance its performance. They
include: laser hardening, coatings of well-adhering polymers and ceramics, ion implantation, and
even the deposition of ultra-hard carbon films with a structure and properties like those of diamond.
New
bio-materials,
designed to be implanted in the human body, have structures onto which growing
tissue will bond without rejection. New
polymers
which can be used at temperatures up to
350°C
allow plastics to replace metals in even more applications
-
the inlet manifold of the automobile
engine, for example. New
elastomers
are flexible but strong and tough; they allow better seals,
elastic hinges, and resilient coatings. Techniques for producing
functionally-graded materials
can
give tailored gradients of composition and structure through a component
so
that it could be corrosion
resistant on the outer surface, tough in the middle and hard
on
the inner surface.
‘Intelligent’
materials
which can sense and report their condition (via embedded sensors) allow safety margins
to be reduced. New
adhesives
could displace rivets and spot-welds; the glue-bonded automobile is
a real possibility. And new techniques of
mathematical modelling
and
process control
allow much
tighter control of composition and structure in manufacture, reducing cost and increasing reliability
and safety.
All these and many more are in the pipeline. They have the potential
to
enable new design, or,
more often, potential for the redesign
of
a product which already has a market, increasing its market
share. Some are already commercial or near commercial; others may not become commercially
viable for two decades. The designer must stay alert.
16.4
Materials and the environment: green design
Technical progress and environmental stewardship are not incompatible goals. History contains many
examples of civilizations that have adopted environmentally conscious life-styles while making tech-
nological and sociological progress. But since the start of the industrial revolution, the acceleration
of
industrial development has overwhelmed the environment, with local and global consequences
which cannot be ignored.
368
Materials Selection
in
Mechanical Design
There is a growing pressure to reduce and reverse this environmental impact. It requires processes
which are less toxic and products which are lighter, less energy-intensive and easier to recycle;
and this must be achieved without compromising product quality. New technologies must (and
can) be developed which allow an increase in production with diminished impact on the environ-
ment. Concern for the environment must be injected into the design process
-
brought ‘behind the
drawing-board’,
so
to
speak
-
taking a life-cycle view of the product which includes manufacture,
distribution, use and final disposal.
Energy-content as a measure
of
environmental impact
All materials contain energy (Table 16.1). Energy is used to mine, refine, and shape metals; it is
consumed in the firing of ceramics and cements; and it is intrinsic to oil-based polymers and elas-
tomers. When you use a material, you are using energy, and energy carries with it an environmental
penalty: CO?, oxides
of
nitrogen, sulphur compounds, dust, waste heat. Energy is only one of the
eco-influences of material production and use, but it is one which is easier to quantify than most
others. We take
it
as an example.
Performance indices which include energy content are derived in the same way as those for weight
or cost (Chapter
5).
An example: the selection of a material for a beam which must meet
a
stiffness
constraint, at minimum energy content.
If
the energy content per kilogram of a material is
q
(data in
Table
16.
l), that per unit volume is
pq
where
p
is the density of the material. Repeating the deriva-
tions of Chapter
5
but with the objective of minimizing the energy content of the beam rather than
its mass leads to performance equations and material indices which are simply those of Chapter
5
with
p
replaced by
pq.
Thus the best materials to minimize energy content of a beam of specified
stiffness and length are those with large values
of
the index
(16.1)
where
E
is the modulus of the material of the beam. The stiff tie of minimum energy content is
best made of a material
of
high
E/pq;
the stiff plate, of a material with high
E1i3/pq.
Strength works the same way. The best choice of material for a beam of specified bending strength
and minimum energy content is that with the highest value of
(16.2)
P9
where
uf
is the failure strength
of
the beam-material. The equivalent calculation for the tie gives
the index
u//pq;
that for a plate gives
u;I2/pq
.
The calculation is easily adapted to include shape;
then the indices of Table
8.1
apply, with
p
replaced by
pq.
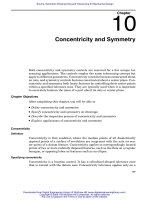
Figures 16.3 and 16.4 are a pair of Materials Selection Charts for minimizing energy content per
unit of function. The first show modulus,
E,
plotted against energy content,
pq;
the design guide-
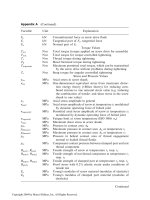
lines give the slopes for three of the commonest performance indices. The second shows strength
The charts are used in exactly the same way
as
before. Energy consumption, and the potential for
saving, are significant when large quantities of material are used, as they are in civil construction. The
reader can quickly establish that the most energy-efficient beam, whether the design is based on stiff-
ness or on strength, is that made of wood; steel, even with
a
large shape factor, consumes
far
more.
Columns of brick or stone are more energy-efficient than concrete, though more labour intensive.
(defined as in Chapter
4)
against
pq;
again, design guide-lines give the slopes.
Forces for change
369
Table
16.1
Energy content and eco-indicator values for materials
Class
Material Energy/wt Energyhol Eco-indicator
4
(MJ/kg) p4(GJ/m3
j
(millipointskg)
Metals
Polymers
Ceramics
and
glasses
Composites
(estimates)
Other
Titanium and alloys
Magnesium and alloys
Cast irons
Aluminium and alloys
Stainless steels
Copper and alloys
Zinc and alloys
Carbon steels
Lead and alloys
Nylon 66
Polypropylene
H.D. polyethylene
L.D. polyethylene
Polystyrene
PVC
Synthetic rubber
Natural rubber
Glasses
Glass fibres
Bone china
Bricks
Refractories
Pottery
Cement
Concrete
Stone
Gravel
GFRP
CFRP
Hard and soft woods
Reinforced concrete
Crude oil
Coal
Natural gas
555-565
410-420
60-260
290-305
110- 120
95-115
67-73
50-60
28-32
170-
180
108-113
80-
104
103-120
96- 140
67-92
120-140
5.5-6.5
13-23
38-64
270
1-50
6-15
4.5-8.0
3 -6
1.8-4.0
0.1
90-120
130-300
3.4-6.0
1.8-4.0
8-20
44
29
2400 -2880
717-756
468-1500
754
-
884
825-972
712- 1035
348-525
390-468
300-360
187-216
95-102
97-116
73-94
96-154
87- 147
108-126
5-6
32-57
95-160
540
-
5
80
6.8-12
3-100
12-30
9-18
7-15
4-8.8
0.2-0.4
160-220
230-540
1.2-3.6
20-50
38-40
27
-
30
0.033-0.039
80-100 (est.)
20-30 (est.)
3-10
10- 18
16-18
60-85
60-85 (est.)
60-85 (est.)
4.0-4.3
12-14
3.2- 3.4
2.8-3.0
3.7-3.9
8.0-8.5
4.2-4.3
13-15
14-16
2.0-2.2
2.1-2.3
1.0-1.5 (est.)
10-20 (est.)
1.0-2.0 (est.)
0.6-
1
.O
(est.)
0.5-1.0
0.5
-
1.5
0.5-
1 .0
0.2-0.5
12-12 (est.)
20-25 (est.)
1.5-2.5 (est.)
0.6-0.8
-
-
-
(1
MJ
=
0.278
kWh
=
9.48
x
10’Btu)
Most polymers are derived from oil. This leads to statements that they are energy-intensive,
with implications for their future. The two charts show that, per unit of function in bending (the
commonest mode of loading), most polymers are less energy-intensive than primary aluminium,
magnesium
or
titanium, and that several are competitive with steel. Most
of
the energy consumed
in the production
of
light alloys such as aluminium and magnesium is used to reduce the ore to the
elemental metal,
so
that these materials, when recycled, are much less energy intensive. Efficient
collection and recycling makes important contributions to energy saving.
Eco-indicators
Energy content, as said earlier, is only one measure of the environmental impact of material usage.
In many circumstances it is not the important one; the emission of a toxic by-product, the difficulty
370
Materials Selection in Mechanical Design
Forces
for
change
371
Fig.
16.4
The strength versus energy-content chart, with guide-lines for selecting materials for strong
structures at minimum energy-content.
this way
-
it is, after all, an aggregated measure of the costs of resources, labour, capital and
energy required to make 1 kg of material. Can a similar aggregate be constructed for eco-burden?
Efforts are underway in Europe to devise such a lumped measure, called the
em-indicator
value,
associated with the manufacture or processing of 1 kg of each material. Evaluating it involves three
steps (Figure
16.5).
First, values for the individual contributions of Table
16.2
are normalized to
remove the strange units. To do this, the contribution is divided by the average contribution per
(European) person per year. Thus the energy is normalized by the energy consumption per person
per year (the total European energy consumption per year divided by the population). Second, the
normalized contributions are weighted to take account
of
the severity
of
the problems they cause.
Thus if acidification is a serious problem it is weighted heavily, and if summer smog is not a problem
372 Materials Selection in Mechanical Design
Table 16.2 Eco-profile: production of 1 kg of aluminium from
bauxite
Environmental
load
Value
Units*
(all per kg)
Energy
Resources
Greenhouse
Ozone
Acidification
Eutrophication
Heavy metals
Carciogenicity
Wintersmog
Summersmog
Pesticides
Solid
220
2.
10.
0
0.
0.
0
0
0.
0.
0
0.
MJ
kg
GWP
ODP
AP
NP
Pb equiv.
PAR equiv
SO2 equiv
POCP
kg
kg
*Units (all per kg):
MI = megajoules of energy
GWP = global warming potential relative to I kg of C02
ODP = ozone depletion potential relative to I kg of CFC-III
AP = acidification potential relative to I kg of 802
NP = nutrification potential relative to I kg of P04
Pb equiv. = heavy metal toxicity relative to I kg of Pb ion
POCP = photochemical oxidant formation relative to I kg of ethylene
802 equiv. = equivalent smog-potential relative to I kg of 802
Fig. 16.5 The steps in deriving an eco-indicator value for a material or process. The raw data are first
normalized by the average output per European person per year, then weighted by the severity of their
effect, then summed. For details, see Goedkoop et al. (1995).
0
6
11
002
13
003
083
Forces for change
373
it is given a light weight. Finally, the weighted, normalized contributes are
summed
to give the
eco-indicator value. There is
a
lot more to it than that, but this outline gives the essentials. The last
column of Table
16.1
lists values based on weight-factors appropriate to a European nation. A high
value means that the use of
1
kg of the material carries a high eco-burden; a low value, a low one.
These eco-indicators (symbol:
I,)
are only an approximate measure of the eco-burden, but they are
a useful one because they allow the initial election of material to minimize overall eco-impact per
unit of function. The reasoning,
as
with energy in the last section, follows the method of Chapter
5.
This leads to a set of indices which are simply those given above with
pq
replaced by
pl,.
Despite often-expressed reservations about the low resolution of eco-indicators, several large
industries now use them to guide the selection of materials and processes. As the documentation of
the eco profile of materials improves and broader agreement is reached on procedures for normalizing
and weighting, it can be expected that their use will grow. The right way to exploit them is that
described here, seeking materials which minimize the eco-impact, not per unit of weight, but per
unit
of
function.
16.5 The pressure
to
recycle and reuse
There are many good reasons for not throwing things away. Discarded materials damage the envi-
ronment; they are
a
form
of pollution. Materials removed from the manufacturing cycle must be
replaced by drawing on
a
natural resource. And materials contain energy, lost when they are dumped.
Recycling is obviously desirable. But in
a
market economy it will happen only if there is profit to
be made. What is needed to allow this?
Look, first, at where recycling works well and where it does not.
Primary scrap
-
the turnings,
trimmings and tailings which are a by-product of manufacture
-
has high value: it is virtually all
recycled. That is because it is uncontaminated and because
it
is not dispersed.
Secondary scrap
has
been through
a
consumption cycle
-
the paper of newsprint, the aluminium
of
a drink-can, the steel
of an automobile
-
all are contaminated by other materials to which they are joined; by corrosion
products; by ink and paint. And they are dispersed, some, like the tungsten
in
the filaments of lamp
bulbs, very widely dispersed. In this form they are worth nothing or less-than-nothing, meaning
that the cost of collection is greater than the value of the scrap itself. Yet this is by far the largest
component
of
the material cycle. Newsprint and bottles are present examples: in
a
free market it is
not economic to recycle either
of
these. Recycling
does
take place, but
it
relies on social conscience
and good will, local subsidies and publicity. It is precarious for just those reasons.
Two things can change all that. Legislation
(a
departure from
a
true free market economy) is the
obvious one. A deposit or ‘dispersal cost’, built into the price of each product, profoundly changes
the economics and effectiveness of recycling; numerous societies have tried it, and it works. The
other is design. The great obstacles in recycling are recognition, separation and decontamination;
all are problems the designer can address. Finger-printing materials by colour or emblem or bar
code allows recognition. Design for disassembly and the avoidance of mutually contaminating
combinations allow economic separation. Clever chemistry (strippable paints; soluble glues) help
with decontamination. And finally: design to by-pass the need to recycle: longer primary life; and
more thought, at the initial design stage, of secondary usage.
16.6 Summary and conclusions
Powerful forces drive the development of new and improved materials, encourage substitution,
and modify the way in which materials are produced and used. Market forces, historically the
374
Materials Selection in Mechanical Design
most influential, remain the strongest. The ingenuity of research scientists, too, drives change by
revealing a remarkable spectrum of new materials with exciting possibilities, though the time it
takes to develop and commercialize them is long: typically
15
years from laboratory to market.
Until recently, these were the evolutionary forces of materials technology. But man's damaging
impact on the environment can no longer be ignored. Materials contribute to this damage at three
points: in their production, in the use of products made from them, and in the disposal of these prod-
ucts. Concern about this, backed by legislation, already drives the development of new processing
routes, the elimination
of
particularly damaging materials, and requirements for more effective recy-
cling. The need, today, is to inject concern for environmental friendliness into the design process.
Only the designer can do that.
16.7 Further reading
Boustead, I. and Hancock, G.F. (1979)
Handbook
of
Industrial Energy Analysis,
Wiley, New York.
Chapman,
P.F.
and Roberts, F. (1983)
Model Resources and Energy.
Butterworths, London.
Goedkoop,
M.J.,
Demmers, M. and Collignon, M.X. (1995)
Eco-Indicator
'95,
Manual,
PrC
Consultants, and
the Netherland Agency for Energy and the Environment, Amersfort,
ISBN
90-721
30-80-4.
Kreigger,
P.C.
(1981) Energy analysis
of
materials and structures
in
the building industry, IEEE.
Navichandra,
D.
(1991) Design
for
environmentability, ASME Design Theory and Methodology Conference,
van Griethuysen, A.J. (1987) (ed.)
New Applications
of
Materials.
Scientific and Technical Publications, The
American Society of Mechanical Engineers, Miami, Florida.
Hague.