Engineering Materials vol 1 Part 5 ppt
Bạn đang xem bản rút gọn của tài liệu. Xem và tải ngay bản đầy đủ của tài liệu tại đây (999.08 KB, 25 trang )
92
Engineering Materials
1
Fig.
8.19.
Reduction in
area
at
break
The maximum decrease in cross-sectional area at the fracture expressed as a percentage
of the original cross-sectional area.
Strain after fracture and percentage reduction in area are used as measures of
ductility, i.e. the ability of a material to undergo large plastic strain under stress before
it fractures.
Chapter
9
Dislocations and yielding in crystals
Introduction
In the last chapter we examined data for the yield strengths exhibited by materials. But
what would we expect? From our understanding of the structure of solids and the
stiffness
of
the bonds between the atoms, can we estimate what the yield strength
should be?
A
simple calculation (given in the next section) overestimates it grossly. This
is because real crystals contain defects,
dislocations,
which move easily. When they
move, the crystal deforms; the stress needed to move them is the yield strength.
Dislocations are the
carriers
of deformation, much as electrons are the carriers of
charge.
The
strength
of
a
perfect crystal
As
we showed in Chapter
6
(on the modulus), the slope of the interatomic force-
distance curve at the equilibrium separation is proportional to Young’s modulus
E.
Interatomic forces typically drop off to negligible values at a distance of separation of
the atom centres of
2ro.
The maximum in the force-distance curve is typically reached
at
1.25~~
separation, and if the stress applied to the material is sufficient to exceed this
maximum force per
bond,
fracture is bound to occur. We will denote the stress at which
this bond rupture takes place by
5,
the
ideal strength;
a material cannot be stronger than
this. From Fig.
9.1
a
=
EE,
0.25r0
E
25~E-z-
Yo
4
’
E
8
-
(T=-
(9.1)
More refined estimates of
6
are possible, using real interatomic potentials (Chapter
4):
they give about
E/15
instead of
E/&
Let us now see whether materials really show this strength. The bar-chart (Fig.
9.2)
shows values of
ay/E
for materials. The heavy broken line at the top is drawn at the
level
a/E
=
1/15.
Glasses, and some ceramics, lie close to this line
-
they exhibit their
ideal strength, and we could not expect them to be stronger than this. Most polymers,
too, lie near the line
-
although they have low yield strengths, these are low because the
moduli
are low.
94
Engineering Materials
1
Fig.
9.1.
The
ideal
strength,
@.
lo-'
10-2
1
o-~
10-6
io-'
Fig.
9.2.
Bar-chart
of
data for normalised yield strength,
cry/€.
Dislocations and yielding in crystals
95
All metals, on the other hand, have yield strengths far below the levels predicted by
our calculation
-
as much as a factor of
lo5
smaller. Even ceramics, many of them, yield
at stresses which are as much as a factor of
10
below their ideal strength. Why is
this?
Dislocations in
crystals
In Chapter
5
we said that many important engineering materials (e.g. metals) were
normally made up of crystals, and explained that a perfect crystal was an assembly
of
atoms packed together in a regularly repeating pattern.
But crystals (like everything in this world) are not perfect; they have
defects
in them.
Just as the strength of a chain is determined by the strength of the weakest link,
so
the
strength of a crystal
-
and thus of our material
-
is usually limited by the defects that
are present in it. The
dislocation
is a particular type of defect that has the effect of
allowing materials to deform plastically (that is, they yield) at stress levels that are
much less than
6.
-
Displace
,
Half plane
Dislocation "line"
Fig.
9.3.
An edge dislocation, (a) viewed
from
a continuum standpoint (i.e. ignoring the atoms) and
(b)
showing
the positions
of
the atoms near the dislocation
96
Engineering Materials
1
Figure 9.3(a) shows an
edge dislocation
from a continuum viewpoint (i.e. ignoring the
atoms). Such a dislocation is made in a block of material by cutting the block up to the
line marked
I
-
I,
then displacing the material below the cut relative to that above by
a distance
b
(the atom size) normal to the line
I
-
I,
and finally gluing the cut-and-
displaced surfaces back together. The result, on an atomic scale, is shown in the
adjacent diagram (Fig. 9.3@)); the material in the middle of the block now contains a
half-plane
of atoms, with its lower edge lying along the line
I
-
I:
the
dislocation line.
This defect is called an edge dislocation because it is formed by the edge of the half-
plane of atoms; and
it
is written briefly by using the symbol
I.
Dislocation motion produces plastic strain. Figure 9.4 shows how the atoms
rearrange as the dislocation moves through the crystal, and that, when one dislocation
moves entirely through a crystal, the lower part is displaced under the upper by the
distance
b
(called the Burgers vector). The same process
is
drawn, without the atoms,
and using the symbol
I
for the position of the dislocation line, in Fig. 9.5. The way in
I
IT-
7-
7- 7-
II
w
4
b
Unlt
of
slip
-
the "Burgers vector",
b
b
Fig.
9.4.
How an edge dislocation moves through a crystal. (a) Shows how
the
atomic bonds at the centre of
the dislocation
break
and reform to allow the dislocation to move.
(b)
Shows a complete sequence for the
introduction of a dislocation into a crystal from the left-hand side, its migration through the crystal, and its
expulsion on
the
right-hand side; this process causes the lower half of the crystal
to
slip by
a
distance
b
under
the upper half.
Dislocations and yielding in
crystals
97
\I
Elevation
Three-dimensional
svmbol
I'
I'
I'
I1
I1
Plan
br
-7
#
-7
-1
tb
Dislocation
"glide"
direction
{a:tep,,
(plane or
dislocation
"glide" plane
Fig.
9.5.
Edge-dislocation conventions.
98
Engineering Materials
1
Fig.
9.6.
The 'carpet-ruck' analogy
of
an edge dislocation.
Displace
dislocation "line"
(b)
Three-dimensional view
Three-dimensional symbol:
"\-e
S
Two-dimensional symbol:
S
Looking down on
to
the plane
of
the cut, along direction
AB
~ Atoms above plane
Fig.
9.7.
A
screw dislocation,
(a)
viewed from
a
continuum standpoint and
(b)
showing the atom positions.
Dislocations and yielding in crystals
99
which this dislocation works can be likened to the way in which a ballroom carpet can
be moved across a large dance floor simply by moving rucks along the carpet
-
a very
much easier process than pulling the whole carpet across the floor at one
go.
In making the edge dislocation of Fig.
9.3
we could, after making the cut, have
displaced the lower part of the crystal under the upper part in a direction
parallel
to the
bottom of the cut, instead of normal to it. Figure
9.7
shows the result; it, too, is a
dislocation, called a
screw
dislocation
(because it converts the planes
of
atoms into a
helical surface, or screw). Like an edge dislocation, it produces plastic strain when it
Bond stretching
I'
0
l'
L
Bond formation
Tb
Tb
Fig.
9.8.
Sequence showing how a screw dislocation moves through a
crystal
causing the lower half of the
crystal
(0)
to
slip
by
a distance
b
under the upper half
(x).
lo0
Engineering Materials
1
/
Dislocation glide
direction
Fig.
9.9.
Screw-dislocation conventions.
Fig.
9.10.
The 'planking' analogy of
the
screw dislocation. Imagine four planks resting side
by
side on
a
factory
floor.
It
is much easier to slide them across the floor one
at
a time than
all
at the same time.
Dislocations and yielding in crystals
101
I
Fig.
9.1
1.
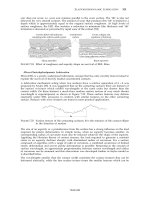
An electron microscope picture of dislocation lines in stainless
steel.
The picture was taken by firing
electrons through a very thin slice
of
steel
about
100
nm thick. The dislocation lines here are only about
1
OOO
atom diameters long because they have been ‘chopped
off
where
they
meet
the top and
bottom
surfaces
of
the
thin slice. But a sugar-cube-sized piece of any engineering alloy contains about
1
O5
km of dislocation line.
(Courtesy of Dr. Peter Southwick.)
moves (Figs
9.8,9.9,9.10).
Its geometry is a little more complicated but its properties are
otherwise just like those of the edge. Any dislocation, in a real crystal, is either a screw
or an edge; or can be thought of as little steps of each. Dislocations can be seen by
electron microscopy. Figure
9.11
shows an example.
The
force acting on a dislocation
A
shear stress
(7)
exerts a force on a dislocation, pushing it through the crystal. For
yielding to take place, this force must be great enough to overcome the
resistance
to the
motion of the dislocation. This resistance is due to intrinsic friction opposing
dislocation motion, plus contributions from alloying or work-hardening; they are
discussed in detail in the next chapter. Here we show that the magnitude of the force
is
7b
per unit length of dislocation.
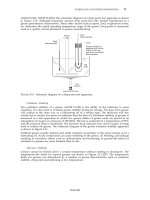
We prove this by a virtual work calculation. We equate the work done by the applied
stress when the dislocation moves completely through the crystal to the work done
against the force
f
opposing its motion (Fig.
9.12).
The upper part is displaced relative
to the lower by the distance
b,
and the applied stress does work
(7E112)
X
b.
In moving
102
Engineering Materials
1
Fig.
9.12.
The
force
acting
on
a
dislocation.
through the crystal, the dislocation travels a distance
Z2,
doing work against the
resistance,
f
per unit length, as it does
so;
this work is
f11Z2.
Equating the two gives
.rb
=
f.
(9.2)
This result holds for any dislocation
-
edge, screw or a mixture of both.
Other properties
of
dislocations
There are two remaining properties of dislocations that are important in understanding
the plastic deformation of materials. These are:
(a) Dislocations always glide on crystallographic planes, as we might imagine from
our earlier drawings of edge-dislocation motion. In f.c.c. crystals, for example, the
dislocations glide on
{111)
planes, and therefore plastic shearing takes place on
(111)
in f.c.c. crystals.
(b) The atoms near the core of a dislocation are displaced from their proper positions
and thus have a higher energy. In order to keep the total energy as low as possible,
the dislocation tries to be as short as possible
-
it behaves as
if
it had a
fine tension,
T,
like a rubber band. Very roughly, the strains at a dislocation core are of order
1
/2;
the stresses are therefore of order
G/2
(Chapter
8)
so
the energy per unit volume of
core is
G/8.
If
we take the core radius to be equal to the atom size
b,
its volume, per
unit length, is
rb2.
The line tension is the energy per unit length (just as
a
surface
tension is an energy per unit area), giving
(9.3)
where
G
is
the shear modulus.
In
absolute terms,
T
is
small (we should need
=
10'
dislocations to hold an apple up) but it is large in relation to the size
of
a
Dislocations and yielding
in
crystals
103
T
G
b2
T
TZ
-
2
Fig.
9.13.
The
line tension in a dislocation.
dislocation, and has an important bearing on the way in which obstacles obstruct
the motion
of
dislocations.
We shall be looking in the next chapter at how we can use our knowledge
of
how
dislocations work and how they behave in order to understand how materials deform
plastically, and to help
us
design stronger materials.
Further
reading
A.
H.
Cottrell,
The Mechanical Properties
of
Matter,
Wiley,
1964,
Chap.
9.
D.
Hull,
Introduction
to
Dislocations,
2nd edition, Pergamon Press,
1975.
W.
T.
Read,
Jr.,
Dislocations in Crystals,
McGraw Hill,
1953.
J.
P.
Hirth and
J.
Lothe,
Theory
of
Dislocations,
McGraw Hill,
1968.
Chapter
10
Strengthening methods, and
plasticity
of
polycrystals
Introduction
We showed in the last chapter that:
(a) crystals contain dislocations;
(b) a shear stress
r,
applied to the slip plane of a dislocation, exerts a force
rb
per unit
(c) when dislocations move, the crystal deforms plastically
-
that is, it yields.
length of the dislocation trying to push it forward;
In this chapter we examine ways of increasing the resistance to motion of a dislocation;
it
is this which determines the
dislocation yield strength
of a single isolated crystal, of a
metal or a ceramic. But bulk engineering materials are aggregates of many crystals, or
grains.
To
understand the plasticity of such an aggregate, we have to examine also how
the individual crystals interact with each other. This lets us calculate the
polycrystal yield
strength
-
the quantity that enters engineering design.
Strengthening mechanisms
A
crystal yields when the force
Tb
(per unit length) exceeds
f,
the
resistance
(a force per
unit length) opposing the motion of a dislocation. This defines the dislocation yield
strength
f
rY
=
-
b'
(10.1)
Most crystals have a certain
intrinsic
strength, caused by the bonds between the atoms
which have to be broken and reformed as the dislocation moves. Covalent bonding,
particularly, gives a very large
intrinsic lattice resistance,
fi
per unit length of dislocation.
It is this that causes the enormous strength and hardness of diamond, and the carbides,
oxides, nitrides and silicates which are used for abrasives and cutting tools. But pure
metals are very soft: they have a very low lattice resistance. Then it is useful to increase
f
by
solid solution strengthening,
by
precipitate
or
dispersion
strengthening, or by
work-
hardening,
or by any combination of the three. Remember, however, that there is an
upper limit to the yield strength: it can never exceed the ideal strength (Chapter
9).
In
practice, only a few materials have strengths that even approach it.
Strengthening methods, and plasticity
of
polycrystals
105
Solid solution hardening
A
good way of hardening a metal is simply to make it impure. Impurities
go
into solution
in a solid metal just as sugar dissolves in tea.
A
good example is the addition of zinc to
copper to make the
alloy
called brass. The zinc atoms replace copper atoms to form a
random substitutional solid solution.
At room temperature Cu will dissolve up to
30%
Zn in
this way. The Zn atoms are bigger than the Cu atoms, and, in squeezing into the Cu
structure, generate stresses. These stresses ‘roughen’ the slip plane, making it harder for
dislocations to move; they increase the resistance
f,
and thereby increase the dislocation
yield strength,
T~
(eqn.
(10.1)).
If the contribution tofgiven by the solid solution isfss then
T~
is increased by
fss
lb.
In a solid solution
of
concentration
C,
the spacing of dissolved
atoms
on
the slip plane (or on any other plane, for that matter) varies as
C-%;
and the
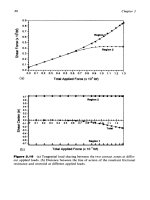
smaller the spacing, the ’rougher’ is the slip plane. As a result,
T~
increases about
parabolically (i.e. as
Cg)
with solute concentration (Fig.
10.1).
Single-phase brass, bronze,
and stainless steels, and many other metallic alloys, derive their strength in this way.
Solid-solution
1
I
I,
0
Weight
%
Zn
30
(Pure
Cu)
Fig.
10.1.
Solid
solution hardening.
Precipitate and dispersion strengthening
If
an impurity (copper, say)
is
dissolved in a metal or ceramic (aluminium, for instance)
at a high temperature, and the alloy is cooled to room temperature, the impurity may
precipitate
as small particles, much as sugar will crystallise from a saturated solution
when
it
is cooled. An alloy
of
A1 containing
4%
Cu (’Duralumin’), treated in this way,
gives very small, closely spaced precipitates of the hard compound CuA1,. Most steels
are strengthened by precipitates of carbides, obtained in this way.*
‘The
optimum precipitate
is
obtained by
a
more elaborate
heat
treatment:
the alloy is
solution heat-treated
(heated to dissolve the impurity),
quenched
(cooled fast
to
room temperature, usually by dropping it into oil
or water) and finally
tempered
or
aged
for
a
controlled time and at a controlled temperature
(to
cause the
precipitate
to
form).
106
Engineering Materials
1
Small particles can be introduced into metals or ceramics in other ways. The most
obvious is to mix a dispersoid (such as an oxide) into a powdered metal (aluminium
and lead are both treated in this way), and then compact and sinter the mixed
powders.
Either approach distributes small, hard particles in the path of a moving dislocation.
Figure
10.2
shows how they obstruct its motion. The stress
7
has to push the dislocation
between the obstacles. It is like blowing up a balloon in a bird cage: a very large
pressure is needed to bulge the balloon between the bars, though once a large enough
bulge is formed, it can easily expand further. The
critical
configuru
tion
is the semicircular
one (Fig. 10.2(c)): here the force
T~L
on one segment is just balanced by the force
2T
due
to the line tension, acting on either side of the bulge. The dislocation escapes
(and
yielding occurs) when
2T
bL
7y
=
(10.2)
The obstacles thus exert a resistance of
fo
=
2T/L.
Obviously, the greatest hardening is
produced by
strong, closely
spaced
precipitates or dispersions (Fig.
10.2).
(a) Approach situation
tttt
It
tttltlt
Force
7b
per
unit length
(b) Sub-critical situation
(c) Critical situation
1
7bL
hh4
T
T
(d)
Escape situation
T
T
L
10-7
Um
10-8
Fig.
10.2.
How
dispersed precipitates help prevent the movement
of
dislocations, and help prevent plastic
flow
of
materials.
Strengthening methods, and plasticity
of
polycrystals
107
Work- hardening
When crystals yield, dislocations move through them. Most crystals have several slip
planes: the f.c.c. structure, which slips on
(Ill]
planes (Chapter
5),
has four, for
example. Dislocations on these intersecting planes interact, and obstruct each other,
and accumulate in the material.
The result is
work-hardening:
the steeply rising stress-strain curve after yield, shown
in Chapter
8.
All metals and ceramics work-harden. It can be a nuisance: if you want
to roll thin sheet, work-hardening quickly raises the yield strength
so
much that
you
have to stop and
anneal
the metal (heat it up to remove the accumulated dislocations)
before you can
go
on. But it is also useful: it is a potent strengthening method, which
can be added to the other methods to produce strong materials.
Fig.
10.3.
TY
hardening
0.01
Z
m
Z
0.5
-
Shear
strain,
y
Collision
of
dislocations
leads
to
work-hardening.
The analysis
of
work-hardening
is
difficult. Its contribution
fwh
to the total dislocation
resistance
f
is considerable and increases with strain (Fig.
10.3).
The dislocation yield strength
It is adequate to assume that the strengthening methods contribute in an additive way
to the strength. Then
fi
fss
f0
fwh
-
-+-+-+
"-b
b
b b
(10.3)
Strong materials either have a high intrinsic strength,
fi
(like diamond), or they rely on
the superposition
of
solid
solution strengthening
fs,,
obstacles
fo
and work-hardening
fWwll
(like high-tensile steels). But before we can use this information, one problem
108
Engineering Materials
1
remains: we have calculated the yield strength
of
an
isolated crystal
in
shear.
We want the
yield strength
of
a
polycrystalline aggregate
in
tension.
Yield
in
polycrystals
The crystals, or
grains,
in a polycrystal fit together exactly but their crystal orientations
differ (Fig.
10.4).
Where they meet, at
grain boundaries,
the crystal structure is disturbed,
but the atomic bonds across the boundary are numerous and strong enough that the
boundaries do not usually weaken the material.
r,
Material
vapour
Surface
of
materia
I
Vacancy
Gra-in boundary
Fig.
10.4.
Ball bearings can
be
used to simulate how atoms are packed together in solids. Our photograph
shows a ball-bearing model set up to show what the grain boundaries look like in a polycrystalline material. The
model
also shows up another
type
of defect
-
the vacancy
-
which
is
caused by a missing atom.
Strengthening methods, and plasticiv
of
polycrystals
109
Y
Fig.
10.5.
The progressive nature
of
yielding in a polycrystalline material.
Let
us
now look at what happens when a polycrystalline component begins to yield
(Fig.
10.5).
Slip begins in grains where there are slip planes as nearly parallel to
T
as
possible, e.g. grain
(1).
Slip later spreads to grains like
(2)
which are not
so
favourably
oriented, and lastly to the worst oriented grains like
(3).
Yielding does not take place all
at once, therefore, and there is no sharp polycrystalline yield point on the stress-strain
curve. Further, gross (total) yielding does not occur at the dislocation-yield strength
7y
because not all the grains are oriented favourably for yielding. The gross-yield strength
is higher, by
a
factor called the Taylor factor, which is calculated (with difficulty) by
averaging the stress over all possible slip planes; it is close to
1.5.
But we want the tensile yield strength,
uy
A
tensile stress
u
creates a shear stress in the
material that has a maximum value of
T
=
0/2.
(We show this in Chapter
11
where we
resolve the tensile stress onto planes within the material.)
To
calculate
uy
from
T.~,
we
combine the Taylor factor with the resolution factor to give
m,
=
37y.
(10.4)
cy
is
the quantity we want: the yield strength
of
bulk, polycrystalline solids. It is larger
than the dislocation shear strength
qY
(by the factor
3)
but is proportional to it.
So
all the
statements we have made about increasing
T,,,
apply unchanged to
cy
A
whole science of alloy design for high strength has grown up in which alloys are
blended and heat-treated to achieve maximum
T
Important components that are
strengthened in this way range from lathe tools ('high-speed steels) to turbine blades
('Nimonic' alloys based on nickel). We shall have more to say about strong solids when
.f/'
110
Engineering Materials
1
we come to look at how materials are
selected
for a particular
job.
But first we must
return to a discussion
of
plasticity at the non-atomistic, or continuum, level.
Further
reading
A.
H.
Cottrell,
The Mechanical Properties ofMatter,
Wiley,
1964,
Chap.
9.
R.
W.
K.
Honeycornbe,
The Plastic Deformation
of
Metals,
Arnold,
1968.
Chapter
11
Continuum aspects
of
plastic
flow
Introduction
Plastic flow occurs by shear. Dislocations move when the shear stress on the slip plane
exceeds
the dislocation yield strength
T~
of
a single crystal. If this is averaged over all
grain-orientations and slip planes, it can be related to
the tensile yield strength
uy
of a
polycrystal by
uy
=
3~~
(Chapter
10).
But in solving problems of plasticity, it is more
useful to define
the shear yield strength
k
of a polycrystal. It is equal to uy/2, and differs
from
T~
because it is an average shear-resistance over all orientations of slip plane.
When a structure is loaded, the planes on which shear will occur can often be identified
or guessed, and the collapse load calculated approximately by requiring that the stress
exceed
k
on these planes.
In this chapter we show that
k
=
uy/2,
and use
k
to relate the hardness to the yield
strength of a solid. We then examine tensile instabilities which appear in the drawing
of
metals and polymers.
The
onset
of
yielding and
the
shear
yield
strength,
k
A
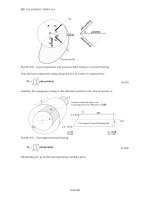
tensile stress applied to a piece of material will create a shear stress at an angle to the
tensile stress. Let us examine the stresses in more detail. Resolving forces in Fig. 11.1
gives the shearing force as
F
sin
0.
The area over which this force acts in shear is
A
cos
0
and thus the shear stress,
T,
is
F
sin
tl
F
Alcos
0
A
r=
=
-
sin
0
cos
0
=
u
sin
0
cos
0.
(11.1)
If we plot this against
8
as in Fig. 11.2 we find a maximum
T
at
0
=
45"
to the tensile
axis. This means that the
highest value of the shear stress is found at
45"
to
the tensile axis,
and
has
a
value
of
u/2.
1
12
Engineering Materials
1
Fig.
11
.l.
A
tensile stress,
F/A,
produces a shear stress,
T,
on an inclined plane in the stressed moterial
m
/
90"
450
6
4
IF
IF
Fig.
1 1.2.
Shear stresses in a material have their maximum value on planes at
45"
to the tensile axis
Now, from what we have said in Chapters
9
and
10,
if
we are dealing with a single
crystal, the crystal will
not
in fact slip on the 45" plane
-
it will slip on the nearest lattice
plane to the 45" plane on which dislocations can glide (Fig.
11.3).
In a polycrystal,
neighbouring grains each yield on their nearest-to-45' slip planes. On
a
microscopic
scale, slip occurs on a zigzag path; but the
average
slip path is at 45" to the tensile axis.
The shear stress on this plane when yielding occurs
is
therefore
T
=
uy
/2,
and we define
this as the shear yield strength
k
Continuum aspects
of
plastic
flow
1
13
F
material the average
Fig.
11.3.
In a polycrystalline
-
slip path
is
at
45”
to the tensile axis.
Example: Approximate calculation
of
the hardness
of
solids.
This concept of shear yielding
-
where we ignore the details of the grains in our polycrystal and treat the material as
a
continuum
-
is useful in many respects. For example, we can use it to calculate the
loads that would make our material yield for all sorts of quite complicated
geometries.
A good example is the problem of the
hardness indenter
that we referred to in the
hardness test in Chapter
8.
Then, we stated that the hardness
(with a correction factor for materials that work-harden appreciably
-
most do). For
simplicity, let us assume that our material does not work-harden;
so
that as the indenter
is pushed into the material, the yield strength does not change. Again, for simplicity, we
will consider a two-dimensional model.
(A
real indenter, of course, is three-dimensional,
but the result is, for practical purposes, the same.)
direction:-
/
Fig.
1
1.4.
The plastic
flow
of
material under
a
hardness indenter
-
a
simplified two-dimensional visualisation
1
14
Engineering Materials
1
As
we press a flat indenter into the material, shear takes place on the
45"
planes of
maximum shear stress shown in Fig.
11.4,
at a value of shear stress equal to
k.
By
equating the work done by the force
F
as the indenter sinks a distance
u
to the work
done against
k
on the shear planes, we get:
This simplifies to
F
=
6Ak
from which
F
-
=
6k
=
3~~
A
But
F/A
is the hardness,
H;
so
H
=
3uy
(11.3)
(Strictly, shear occurs not just on the shear planes we have drawn, but on a myriad of
45"
planes near the indenter. If our assumed geometry for slip is wrong it can be shown
rigorously by a theorem called the
upper-bound
theorem that the value we get for
F
at
yield
-
the so-called 'limit' load
-
is always on the high side.)
Similar treatments can be used for all sorts of two-dimensional problems: for
calculating the plastic collapse load of structures of complex shape, and for analysing
metal-working processes like forging, rolling and sheet drawing.
Plastic instability: necking in tensile loading
We now turn to the other end of the stress-strain curve and explain why, in tensile
straining, materials eventually start to
neck,
a name for
plastic instability.
It means that
flow becomes localised across one section of the specimen or component, as shown in
Fig.
11.5,
and (if straining continues) the material fractures there. Plasticine necks
readily; chewing gum is very resistant to necking.
We analyse the instability by noting that if a force
F
is applied to the end of the
specimen
of
Fig.
11.5,
then any section must carry this load. But is it capable
of
doing
so?
Suppose one section deforms a little more than the rest, as the figure shows. Its
section
is
less, and the stress in it is therefore larger than elsewhere. If work-
hardening has raised the yield strength enough, the reduced section can still carry
the force
F;
but if it has not, plastic flow will become localised at the neck and the
specimen will fail there. Any section
of
the specimen can carry
a
force
Aa,
where
A
is its area, and
u
its current strength. If
Ao
increases with strain, the specimen is
Continuum aspects
of
plastic
Row
1
15
Section
area
,
ir
Section
area
__
-
-A
I
+
dl
Fig.
11.5.
The formation
of
a
neck
in
a
bar
of
material which is being deformed plastically.
stable.
If
it decreases, it is unstable and will neck. The critical condition for the start
of necking is that
Ao
=
F
=
constant.
Then
Ada+odA
=
0
or
dA
do
o
A
_-
-
But volume is conserved during plastic flow,
so
dA
dl
AI
=
de
-
-
-
(prove this by differentiating
AI
=
constant). So
do
-
=
de
o
or
do
de
-
=
u.
(11.4)
This equation is given in terms of true stress and true strain.
As
we said in Chapter
8,
tensile data are usually given in terms of nominal stress and strain. From Chapter
8:
u
=
on
(I
+
€J,
E
=
In
(1
+
en).
1
16
Engineering
Materials
1
/
E
Fig.
11.6.
The
condition
for
necking.
If
these are differentiated and substituted into the necking equation we get
(11.5)
In other words,
on
the point of instability, the
nominal
stress-strain curve is at its
maximum as we know experimentally from Chapter
8.
To
see what is going on physically, it is easier to return to our first condition. At low
stress, if we make a little neck, the material in the neck will work-harden and will be
able to carry the extra stress it has to stand because of its smaller area; load will
therefore be continuous, and the material will be stable. At high stress, the
rate
of
work-
hardening
is less as the true stress-true strain curve shows: i.e. the slope
of
the
u/e
curve is less. Eventually, we reach a point at which, when we make a neck, the work-
hardening is only
just
enough to stand the extra stress. This
is
the point of necking,
with
At still higher
true
stress, du/de, the rate
of
work-hardening decreases further,
becoming insufficient to maintain stability
-
the extra stress in the neck can no longer
be accommodated by the work-hardening produced by making the neck, and the neck
grows faster and faster, until final fracture takes place.
Consequences
of
plastic
instability
Plastic instability is very important in processes like deep drawing sheet metal to form
car bodies, cans, etc. Obviously we must ensure that the materials and press designs are
chosen carefully to
avoid
instability.
Mild steel is a good material for deep drawing in the sense that it flows a great deal
before necking starts. It can therefore be drawn very deeply without breaking (Fig.
11.7).