A randomized controlled trial of interventions to enhance patient-physician partnership, patient adherence and high blood pressure control among ethnic minorities and poor persons: study protocol NCT00123045 pptx
Bạn đang xem bản rút gọn của tài liệu. Xem và tải ngay bản đầy đủ của tài liệu tại đây (337.37 KB, 16 trang )
BioMed Central
Page 1 of 16
(page number not for citation purposes)
Implementation Science
Open Access
Study protocol
A randomized controlled trial of interventions to enhance
patient-physician partnership, patient adherence and high blood
pressure control among ethnic minorities and poor persons: study
protocol NCT00123045
Lisa A Cooper*
1,2,3,4
, Debra L Roter
5
, Lee R Bone
5
, Susan M Larson
5
,
Edgar R Miller III
1,2,3
, Michael S Barr
6
, Kathryn A Carson
3
and
David M Levine
2,5
Address:
1
Welch Center for Prevention, Epidemiology and Clinical Research, Johns Hopkins University, Baltimore, Maryland, USA,
2
Department
of Medicine, Johns Hopkins University School of Medicine, Baltimore, Maryland, USA,
3
Department of Epidemiology, Johns Hopkins Bloomberg
School of Public Health, Baltimore, Maryland, USA,
4
Department of Health Policy and Management, Johns Hopkins Bloomberg School of Public
Health, Baltimore, Maryland, USA,
5
Department of Health, Behavior and Society, Johns Hopkins Bloomberg School of Public Health, Baltimore,
Maryland, USA and
6
American College of Physicians, Practice Advocacy and Improvement Division, Washington, DC, USA
Email: Lisa A Cooper* - ; Debra L Roter - ; Lee R Bone - ;
Susan M Larson - ; Edgar R Miller - ; Michael S Barr - ;
Kathryn A Carson - ; David M Levine -
* Corresponding author
Abstract
Background: Disparities in health and healthcare are extensively documented across clinical
conditions, settings, and dimensions of healthcare quality. In particular, studies show that ethnic
minorities and persons with low socioeconomic status receive poorer quality of interpersonal or
patient-centered care than whites and persons with higher socioeconomic status. Strong evidence
links patient-centered care to improvements in patient adherence and health outcomes; therefore,
interventions that enhance this dimension of care are promising strategies to improve adherence
and overcome disparities in outcomes for ethnic minorities and poor persons.
Objective: This paper describes the design of the Patient-Physician Partnership (Triple P) Study.
The goal of the study is to compare the relative effectiveness of the patient and physician intensive
interventions, separately, and in combination with one another, with the effectiveness of minimal
interventions. The main hypothesis is that patients in the intensive intervention groups will have
better adherence to appointments, medication, and lifestyle recommendations at three and twelve
months than patients in minimal intervention groups. The study also examines other process and
outcome measures, including patient-physician communication behaviors, patient ratings of care,
health service utilization, and blood pressure control.
Methods: A total of 50 primary care physicians and 279 of their ethnic minority or poor patients
with hypertension were recruited into a randomized controlled trial with a two by two factorial
design. The study used a patient-centered, culturally tailored, education and activation intervention
for patients with active follow-up delivered by a community health worker in the clinic. It also
included a computerized, self-study communication skills training program for physicians, delivered
Published: 19 February 2009
Implementation Science 2009, 4:7 doi:10.1186/1748-5908-4-7
Received: 14 November 2008
Accepted: 19 February 2009
This article is available from: />© 2009 Cooper et al; licensee BioMed Central Ltd.
This is an Open Access article distributed under the terms of the Creative Commons Attribution License ( />),
which permits unrestricted use, distribution, and reproduction in any medium, provided the original work is properly cited.
Implementation Science 2009, 4:7 />Page 2 of 16
(page number not for citation purposes)
via an interactive CD-ROM, with tailored feedback to address their individual communication skills
needs.
Conclusion: The Triple P study will provide new knowledge about how to improve patient
adherence, quality of care, and cardiovascular outcomes, as well as how to reduce disparities in
care and outcomes of ethnic minority and poor persons with hypertension.
Background
A compelling amount of evidence documents ethnic dis-
parities in health care and outcomes in the United States
[1]. Additionally, there is an inverse relationship between
socioeconomic status and health: the lower the socioeco-
nomic status, the higher the risk of morbidity and mortal-
ity from chronic disease [2,3]. It is uncertain how much of
these differences in health care and outcomes can be
explained by environmental, economic and social factors,
access to appropriate and effective health and social serv-
ices, or behavioral risk factors [4]. Health care profession-
als, researchers, and policymakers in the United States
have believed for some time that access to care is the
centerpiece in the elimination of disparities in health for
racial, ethnic, and social class groups [5-8]. However, dif-
ferences in traditional barriers of access (such as socioeco-
nomic status and health insurance coverage) between
patients only partially explain the observed differences in
health care [5,9,10]. Other patient factors that may play
an important role include patients' illness beliefs and
behavior [11-13], their degree of self-efficacy regarding
taking care of their health [14], language barriers [15,16],
low health literacy [17,18], preferences for care [19-21],
and their level of involvement in medical decision-mak-
ing [22,23]. All of these patient factors contribute to
patients' adherence to recommended therapies. Physician
factors that may play a role in disparities in care include
self-efficacy regarding care of ethnically and socially
diverse patient populations, communication style (e.g.,
patient-centeredness) [24,25], and biases in medical deci-
sion-making (intentional or unintentional) [26,27].
Health system factors other than reimbursement or payer
status that may contribute to disparities in care include
the degree of organizational focus on quality [28], patient
concerns [29-31], and cultural competence [11,32-34].
A recent review of the literature reveals that there are few
rigorously designed studies to determine which provider-
directed strategies are most effective in reducing dispari-
ties in healthcare quality between minority and white
populations, and that most of the studies that exist do not
target conditions, such as cardiovascular disease, known
to be a source of health disparities, nor do they collect
adequate data to link evidence-based healthcare processes
with patient outcomes [35]. Moreover, few studies have
simultaneously intervened to train patients to engage
more fully in the health care process while also providing
physicians with communication skills training to elicit,
activate, and support patient participation in the care dia-
logue. Because hypertension disproportionately affects
ethnic minorities and persons living in poverty, and
because patient-provider communication has a clear and
significant impact on patient outcomes such as adherence,
satisfaction, and health status, interventions to increase
patient-physician partnership are important strategies to
overcome disparities in hypertension care and outcomes.
Methods
Study design and specific aims
Specific aim one
Recruit 50 primary care physicians and 500 of their
patients who have uncontrolled hypertension into the
Patient-Physician Partnership (Triple P) study, a rand-
omized controlled trial with a two-by-two factorial
design, to simultaneously study the effect of a patient acti-
vation and/or a physician communication training inter-
vention on adherence to recommended treatment for
high blood pressure (Figure 1). Patients will include
adults, aged 18 and older, who receive care in several
urban community health clinics serving primarily African-
American and low socioeconomic status populations.
Specific aim two
Compare the relative effectiveness of the patient and phy-
sician interventions, separately, and in combination with
one another, with the effectiveness of minimal interven-
tions by evaluating their impact on the following out-
comes measured at enrollment, three months, and twelve
months: 1) patient adherence to medication and lifestyle
recommendations (appointment-keeping, prescription
refill rates, and patient self-reports); 2) patient and physi-
cian ratings of quality of care (physicians' participatory
decision-making (PDM) style and satisfaction); 3)
patient-physician communication behaviors, including
adherence-specific communication, measured pre- and
post-intervention; 4) health outcomes, including blood
pressure control; and 5) emergency room use and hospi-
talizations.
Specific aim three
Assess the moderating effects of patient and physician var-
iables on the relationships between the intervention and
the main outcomes. Important moderating patient varia-
bles include age, ethnicity, gender, health literacy, and
Implementation Science 2009, 4:7 />Page 3 of 16
(page number not for citation purposes)
physical and emotional health status. Moderating physi-
cian variables include age, ethnicity, gender, knowledge of
hypertension management, clinical experience, psychoso-
cial-mindedness, attitudes towards diversity, and previous
training in communication skills.
We hypothesize that the combined patient and physician
intervention will have the greatest effect on processes and
outcomes, the patient and physician interventions sepa-
rately will each have an intermediate effect, and the com-
bined patient and physician usual care group will have no
appreciable effect. Specifically, we hypothesize that com-
pared to patients and physicians in the usual care group,
patients and physicians in the intervention groups will
have higher rates of patient adherence to therapeutic rec-
ommendations; higher ratings of partnership with physi-
cians, quality of care, and satisfaction; more patient-
centered communication behaviors by physicians as
measured by audiotape; more communication across the
participation continuum by patients as measured by audi-
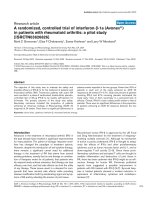
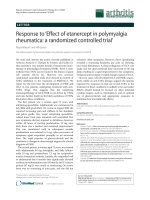
Patient-Physician Partnership study designFigure 1
Patient-Physician Partnership study design. The study uses a 2 by 2 factorial design to simultaneously study the effect of
physician communication skills training and/or patient activation by community health workers (CHWs). All physicians, includ-
ing those in the minimal intervention, receive a copy of hypertension treatment guidelines and are videotaped with a simulated
patient before randomization. The patient intervention includes coaching by CHWs and a photonovel. CHW contacts are 20
minutes at enrollment, 2 weeks, 3,6,9, and 12 months. All patients, including those in the minimal intervention, receive monthly
newsletters.
Communication Skills
Intervention
Physicians
N=25
Intervention
Patient
N=125
Intervention
Patient
N=125
Minimal Intervention
Physicians
N=25
Minimal
Intervention
Patient
N=125
Minimal
Intervention
Patient
N=125
Physicians are
randomized
Patients are
randomized
Implementation Science 2009, 4:7 />Page 4 of 16
(page number not for citation purposes)
otape; higher rates of blood pressure control; and lower
rates of emergency room use and hospitalizations.
Study population and settings
The Baltimore, Maryland metropolitan area has one of the
five highest percentages of African Americans of the
Standard Metropolitan Statistical Areas in the United
States (U.S. Census Bureau.
.
Accessed on 24 July 2007). The Triple P study occurs in
primary care sites affiliated with Baltimore Medical Sys-
tem (four sites), Johns Hopkins Community Physicians
(five sites), Total Health Care (two sites), Jai Medical
Group (three sites) and five other independent practice
locations. These sites were chosen because they are com-
munity-based and serve a patient population that is pri-
marily low income/and or ethnic minority (African-
American). Approximately 60 to 100% of the patients in
participating sites are African-American and 35 to 55%
earn below 200% of the federally defined poverty guide-
lines.
Recruitment strategies
Physicians
Letters co-signed by medical directors of each provider
organization and the principal investigator (PI) intro-
duced the study to physicians. The letter outlined the
goals of the study, gave a general description of the inter-
ventions, and described the responsibilities of physicians
caring for study patients. Physicians were also told that
they would receive continuing medical education credits,
tailored, individualized feedback regarding their inter-
viewing skills, and $200 paid to them either individually
or to their organization. The PI subsequently attended
staff meetings to present the study to physicians and to
answer any questions they had. After the presentation,
physicians were given a sign-up sheet they could return
immediately or by fax to the PI's office. Research staff
made follow-up phone calls to physicians who did not
respond by fax within two weeks of the presentation at
each site. Practice leaders facilitated communication with
the physicians at their sites.
Patients
Patients were recruited using two strategies. Initially, we
obtained approval from the Johns Hopkins Institutional
Review Board and the participating clinical sites to iden-
tify potentially eligible patients from claims data. All
patients aged 18 and older with an ICD-9 diagnosis of
hypertension (401.00 – 401.9), based on one or more
claims in the past 12 months were eligible for considera-
tion.
For each participating physician, if the physician's panel
size of potentially eligible patients was 200 or less, we
attempted to recruit all patients. If the panel size was
greater than 200 patients and more than 50% white, we
over-sampled ethnic minority patients by taking up to
140 minority patients and sampling white patients to add
up to a total pool of 200 patients per physician. If the
panel size was greater than 200 patients and less than 50%
white, we randomly sampled 200 patients per physician.
We obtained patients' name, race, gender, and contact
information, and compiled this information into an elec-
tronic database that was then used by research staff to
mail letters that invited patients to participate in the
study. The letter, sent on the letterhead of each participat-
ing clinical site, told patients that their primary care phy-
sicians had signed up for the project and that his/her
patients with hypertension were being invited to partici-
pate. The letter also included a postcard that could be
returned to study staff to indicate if the patient did not
wish to be contacted further. If a refusal was not received
from a given patient within two weeks, the letter was fol-
lowed by a telephone call to tell them about the study,
confirm eligibility and interest, and ask them if they
would be willing to speak further about the study with a
member of the study staff when they arrived at the clinic
for their next appointment. If they agreed, they were asked
to arrive one hour before their appointment, and the
research assistant (RA) called them one to two days prior
to their scheduled appointment to remind them.
Initially, we attempted to recruit at least 10 and no more
than 15 patients per physician. Recruiters were told to call
all of the patients in each physician's recruitment sample
until this goal was achieved. We aimed to complete
recruitment at certain sites prior to beginning recruitment
at other sites in order to maximize staff efficiency.
Towards the end of the recruitment phase, we adjusted
our recruitment target to a minimum of five patients per
physician.
After the enforcement of the Health Insurance Portability
and Accountability Act (HIPAA), we obtained a Waiver of
HIPAA privacy authorization from the Johns Hopkins IRB
and entered into agreements with many of the health
plans to allow data sharing for patient recruitment. How-
ever, some insurers were hesitant to share claims data with
the team for the purposes of recruitment, as described
above. Since this impacted our ability to recruit patients
by telephone, we sought and obtained approval from the
IRB to recruit patients onsite by sending research staff to
participating sites on recruitment days agreed upon by
research and clinical site staff. The recruitment process is
the same for either strategy, except that patients identified
by claims data and recruited by letter and telephone calls
were prepared to arrive early for their appointment, while
patients recruited onsite had less time before their
appointment to complete the recruitment process. In the
Implementation Science 2009, 4:7 />Page 5 of 16
(page number not for citation purposes)
latter situation, research staff were instructed to complete
data collection on only absolutely required items prior to
the patient's appointment and to avoid any interference of
routine clinical practice. We have recorded the recruit-
ment strategy that was used for each patient and will
examine its association with agreement to enter the study
and with baseline demographic and clinical characteris-
tics.
At the index visit, the RA assigned to data collection met
the patient, described the study, obtained consent, admin-
istered the baseline interview, checked patients' seated
blood pressures using standard techniques, and arranged
for the patient's visit to be audiotaped. Patients were then
randomized to a minimal intervention or a community
health worker (CHW) intervention. Those randomized to
the CHW intervention attended their first intervention
visit for pre-visit coaching, and patients assigned to the
minimal intervention group had a five-minute welcome
to the study in which the RA provided an educational
newsletter about hypertension.
Eligibility criteria
Physicians recruited for the Triple P study were general
internists and family physicians who saw patients at least
20 hours per week at one of the participating study sites.
Physicians were only excluded if they intended to leave
the practice within 12 months of the beginning of the
patient recruitment period. Patients recruited for the Tri-
ple P study were adults aged 18 years and older, had a
diagnosis of hypertension (at least one claim with the
ICD-9 code 401 in the preceding year), and were able to
provide contact information for themselves and at least
one other person and written consent to participate in the
randomized clinical trial. Patients were excluded if they:
1) refused to give informed consent; 2) appeared to be too
acutely ill, disoriented, or unresponsive to complete the
baseline assessment (interview, blood pressure, weight
measurement, and audiotaped visit), 3) stated that they
had not been told by their doctor that they were hyperten-
sive, 4) were likely to move away from the Baltimore area
in the next 12 months; 5) were planning to change where
they receive medical care within the next 12 months; 6)
were currently involved in a disease management pro-
gram, research program or study for hypertension, kidney
disease, heart disease, or diabetes; or 7) if they had a med-
ical condition that might limit their participation in the
study over the next five years (e.g., AIDS/HIV, schizophre-
nia, cancer (except skin), Alzheimer's or other form of
dementia; end-stage renal disease, congestive heart fail-
ure, or active tuberculosis). This information regarding
medical conditions was obtained from claims data, when
available, to exclude ineligible patients from the recruit-
ment database, and ascertained by patient self-report dur-
ing onsite recruitment.
Randomization
Randomization was conducted first at the physician level
and then randomizing patients within physician groups.
After obtaining informed consent and completing base-
line data collection (background questionnaire and vide-
otaped interview with the standardized patient),
physicians were randomly assigned to the minimal inter-
vention or communication skills intervention. The physi-
cian intervention was assigned stratifying by clinical site.
Random blocks of size two and four were used, and a list
of random numbers between zero and one was generated
in Stata version 7.0 (Stata corporation, Texas, USA).
Patients were randomly assigned to the minimal interven-
tion or the community health worker intervention after
confirming eligibility, obtaining informed consent, and
completing the baseline patient interview. The patient
intervention was assigned stratifying by physician using
random blocks of size four. The study statistician gener-
ated the allocation sequence for both physicians and
patients and placed the intervention assignment for each
subject in opaque envelopes to be opened by research
assistants after the subject had completed the baseline
assessment. The sequence was concealed until after inter-
ventions were assigned.
Due to the nature of the interventions, complete masking
of participants, investigators, and community health
workers was not possible. However, all interviewers and
community health workers (who collected data from
patients) were masked to physician intervention assign-
ment. Additionally, research interviewers at enrollment
were masked to patient intervention assignment until
after baseline data collection was complete, and research
interviewers at follow-up interviews (different staff) were
masked to patient intervention assignment until the end
of the interview (when patients were asked to evaluate the
intervention). Physicians were not informed of the inter-
vention assignment of their patients.
Interventions
Patient interventions
The intensive patient intervention was based on a model
of patient education, characterized by pre-visit coaching,
that has been shown to improve patients' communication
with providers and health outcomes [36,37], and includes
aspects of medical interviewing relevant to the participa-
tion continuum (engagement, activation, and empower-
ment). We chose community health workers to
administer the intervention and developed a mechanism
for ongoing reinforcement and support in order to
enhance the cultural appropriateness, and thereby the
sensitivity, credibility, relevance, and effectiveness of the
intervention for minority patients.
Implementation Science 2009, 4:7 />Page 6 of 16
(page number not for citation purposes)
The intervention integrates cognitive, behavioral, and
affective programmatic elements in two stages. The first
stage of the intervention is comprised of a 20-minute pre-
visit coaching session by a CHW in a room at the clinical
site immediately prior to the patient's index visit with his/
her physician, followed by a 10-minute exit or debriefing
session after the visit. The CHWs used a structured proto-
col in the pre-visit coaching session to accomplish the par-
ticipation (engagement, activation, and empowerment)
goals.
The second stage continues contact between the CHW and
the patient through a series of 10 to 15 minute check-in
telephone calls at two weeks, three months, six months,
nine months, and twelve months from baseline. In addi-
tion, the CHWs were available to patients by phone on an
'as needed' basis over the one-year follow-up period. A
specially crafted serial photonovel featuring an ongoing
drama was mailed to patients to coincide with their tele-
phone follow-up calls. In this photonovel, a CHW,
patient, and primary care physician are portrayed dealing
with the daily challenges of hypertension management
within the broader context of the patient's life. Each issue
of the photonovel conveys a specific theme common to
hypertensive patients as they attempt to meet everyday
challenges associated with the many aspects of hyperten-
sion self-management (e.g., stress, family and financial
issues, medication side effects, diet, exercise, alcohol use,
and adherence with appointments). The CHWs who were
hired for this study lived in the communities served by
some of the participating clinics, and they helped investi-
gators to create the storyline, write the script, and take
photographs for the photonovel. Use of photonovels in
diverse populations has demonstrated their superiority to
standard health education materials in terms of interest,
credibility, and readability [38-40].
In addition, all patients (intensive and minimal interven-
tion) receive a monthly newsletter that includes a ques-
tion and answer column, a recipe exchange, health tips,
and reminders to keep scheduled appointments. The
newsletters are designed to meet the needs of low literate
adult readers by not exceeding a fifth-grade reading level
and through the presentation of information through a
familiar engaging and friendly format.
Physician interventions
The intensive physician intervention is a continuing med-
ical education (CME) communication skills training pro-
gram based on models previously shown to be effective in
improving physicians' interviewing skills and patient out-
comes [41]. A critical component of this program is the
individualized feedback that intervention physicians
receive regarding their interview with a simulated patient.
The program includes those aspects of medical interview-
ing relevant to the participation continuum in the areas of
data-gathering, patient education and counseling, rap-
port-building, and facilitation and patient activation.
Although ambitious in its scope, the CME is designed for
convenience and ease of administration. The estimated
time for administration is approximately two hours, dur-
ing which the physician reviews his or her personal inter-
view with the simulated patient and completes workbook
exercises.
Briefly, the CME is comprised of an interactive CD-ROM
that is created using a videotape of each study physician's
interview with a simulated patient collected at baseline.
This patient is an African-American man with hyperten-
sion scripted to present common barriers and culturally
specific beliefs and expectations related to adherence with
hypertension therapy. The videotape is saved to the CD-
ROM within a software program that shows the categori-
zation of every statement spoken by either the patient or
the physician. The coding scheme, called the Roter Inter-
action Analysis System (RIAS), is a widely used approach
to the assessment of medical visit communication [41-
44]. The software allows the physician to navigate the
interview in an efficient manner and quickly review exam-
ples of specific skills. Specifically, physicians may go
directly to those parts of the visit that interest them; see a
visual summary of their conversation with the patient
over the course of the visit; review the different kinds of
talk that comprise the conversation and select samples of
the talk, by category, for review; and view and listen to
video-glossary examples of talk categories and proficien-
cies that are useful in improving patient adherence to
hypertension treatment.
A workbook that accompanies the CD-ROM directs phy-
sicians to the primary features of the software; provides an
orientation to the RIAS analysis approach; and includes
case-based exercises to be completed by the physician.
These exercises include a review of their skills in five areas
for improving patient adherence (eliciting the full spec-
trum of patient concerns; probing patients regarding their
knowledge and beliefs about hypertension; monitoring
patient adherence; assessing obstacles and resources, and
eliciting a commitment to the therapeutic plan). The
workbook and CD-ROM also review the four functions of
the medical interview (data-gathering, patient education
and counseling, rapport-building, and facilitation and
patient activation) with the corresponding communica-
tion skills. Completion of the workbook and an evalua-
tion form provides documentation of the physician's
completion of the CME program.
All physicians (intensive and minimal intervention
groups) receive a copy of the JNC-VII hypertension treat-
ment guidelines at baseline and a monthly newsletter
Implementation Science 2009, 4:7 />Page 7 of 16
(page number not for citation purposes)
with study updates and summaries of recent journal arti-
cles related to cardiovascular care and/or health dispari-
ties.
Data collection
In addition to the main outcome and process measures,
we collected data at baseline to define the characteristics
of the study subjects and to describe the characteristics of
experimental groups after randomization. While the inter-
vention status is the main predictor variable, we measured
other factors known to be predictors of adherence and
blood pressure control (potential confounders and effect
modifiers) and factors that could explain why the inter-
vention did or did not work. We selected instruments that
are generally relatively brief, have been used successfully
in primary care settings, and have been shown to be relia-
ble and valid in inner city ethnic minorities and persons
living in poverty. Table 1 shows the sociodemographic
and attitudinal variables, self-reported adherence, health
service utilization, healthcare process, and health out-
come measures collected from patients at baseline and
over follow-up. Table 2 shows the variables collected from
physicians at baseline, post-intervention, and the end of
the study.
Main outcome measures and statistical analysis plan
Randomly assigned treatment group (physician and
patient intervention, physician intervention only, patient
intervention only, or physician and patient minimal inter-
vention) is the main independent variable for this study.
All efficacy analyses will be performed using the 'inten-
tion-to-treat' principle. Clinic site was a stratification var-
iable for randomization and is expected to be balanced
across treatment groups by design. Descriptive statistics
are used to summarize patient and physician characteris-
tics at baseline. Comparability of patient groups after ran-
domization will be assessed with regard to pre-
intervention sociodemographics, health status measures,
use of medical services in the previous six months, patient
preferences for involvement in care, and other key varia-
bles. The comparability of physician groups after rand-
omization will be determined based on physician
sociodemographic data as well as pre-intervention meas-
ures of training and self-efficacy regarding management of
hypertension, non-adherence, and social and culturally
diverse patients.
The main study outcomes are measures of adherence to
recommended treatment. Because there is no gold stand-
ard for what defines satisfactory versus poor adherence,
measurement of adherence is multifaceted and includes
appointment-keeping, pharmacy records, and subjective
perceptions (patients', providers', and CHWs' report of
patient compliance). These indicators tap different
dimensions of the compliance challenge and reflect varied
levels of patient effort and commitment and measure-
ment rigor. Our primary outcome, upon which our sam-
ple size is calculated, is appointment-keeping. The
Table 1: Schedule of Variables Collected from Patients in Patient-Physician Partnership Study
Measurement/Collection Method Index visit 3 months 12 months
Questionnaires
Sociodemographics (age, sex, race/ethnicity, education, income, occupation, health insurance) X
Attitudes, beliefs, and behaviors (trust/mistrust, health behaviors, problem solving*, self-efficacy,
spirituality, self-reported adherence to medications and lifestyle recommendations
(HBS), perceived susceptibility to illness*, health literacy**)
XXX
Health Status (physical and mental, measured by MOS-SF12 & CES-D), Healthcare utilization* (emergency
room visits and hospitalizations), Healthcare process
(perceptions of biased care, trust, respect, PDM with physicians, visit-specific and overall satisfaction)
XXX
Physical Examination (BP, BMI) X X X
Blood laboratory measures (Cr, eGFR, HbA1c, Hb, CaPO4, lipids) X X
Urine laboratory measures (microalbuminuria) X X
Audiotapes (patient-physician communication)¶ X
HBS = Hill-Bone Adherence Scale, CES-D = Center for Epidemiologic Studies Depression Scale, PDM = participatory decision making; BP = blood
pressure; BMI = body mass index; Cr = creatinine; eGFR = estimated GFR using MDRD equation; Hb = hemoglobin;
* = not measured at baseline; ** = measured only at baseline; ¶collected after first patient intervention
contact and after physician intervention.
Implementation Science 2009, 4:7 />Page 8 of 16
(page number not for citation purposes)
number of primary care appointments scheduled and
kept will be tracked using clinic schedules and claims
data. Broken appointments that have been rescheduled
and kept within a two-week window are considered a kept
appointment; broken appointments that are rescheduled
but not kept, or rescheduled outside of the two-week win-
dow are considered a missed appointment. Patients are
also asked about the number of ambulatory visits (pri-
mary care and medical subspecialty) occurring within the
previous six months at their three- and twelve-month fol-
low-up interviews, and we will compare these self-reports
to the information obtained from administrative data.
Change in systolic and diastolic blood pressure and blood
pressure control status will be examined as secondary out-
comes. Blood pressure (BP) is measured by trained and
certified observers using an automatic oscillometric mon-
itor (Omron HEM 907). This device programs a five-
minute delay before activation and has a 30-second delay
between the triplicate measurements. We will use two
measures – the average of all three measurements and the
average of the last two measurements – obtained at each
time point (before randomization, at three months, and
at twelve months of follow-up). BP control is dichot-
omized as uncontrolled (SBP ≥ 140 mmHg or DB P ≥ 90
mmHg) or controlled (SBP <140 mmHg and DBP <90
mmHg).
The data on outcome variables fall into two broad catego-
ries: dichotomous data, such as blood pressure control,
yes or no; and continuous variables, such as the percent-
age of appointments scheduled and kept within a two-
week period), compliance score (from Hill-Bone Compli-
ance to High Blood Pressure Therapy Scale) [45], patient-
centered interviewing score (obtained from audiotape
analysis of patient-physician communication behaviors
using the RIAS) [42-44], or participatory decision-making
score [22]. In addition to the nature of the study variables,
two additional design factors need to be considered in the
data analysis stage. First, the trial naturally originates
repeated measurements over the one-year follow-up [46-
48]. Although we will compare study endpoints at the
Table 2: Schedule of Data Collected from Physicians in the Patient-Physician Partnership Study
Baseline End of study
Demographics
(age, gender, race, ethnicity, place of birth, residency training, board certification status, practice experience)
X
Specialty (Internal Medicine or Family Medicine) X
Previous Communication Skills CME Training X X
Previous Hypertension CME Training XX
Attitudes about Race* XX
Self-reported communication and PDM style X
Job stress and satisfaction X
Self-efficacy in managing adherence problems, hypertension, and patients from socially and culturally diverse
backgrounds
XX
Pre Intervention Post Intervention
Videotape with simulated patient X
Audiotapes with 5–10 hypertension patients X
Visit-Specific Satisfaction with each patient X
Perceptions of patients' social and behavioral characteristics X
Use/process evaluation of CD-ROM/Workbook ** X
*Explicit attitudes measured at baseline before index visit; implicit attitudes measured only at end of study using the Implicit Association Test (IAT);
** Intervention physicians only
Implementation Science 2009, 4:7 />Page 9 of 16
(page number not for citation purposes)
three- and twelve-month follow-up visit, this analysis is
inefficient because it does not simultaneously use all
available information, and at the same time it is subject to
the multiple comparison problem [46]. We will use two
approaches to analyze repeated measurement outcomes.
First, for variables such as appointments scheduled and
kept within a two-week period, we will compute a sum-
mary measure across time for each subject (in this case,
the percentage of appointments scheduled and kept)
[46,49]. This approach is, under a wide variety of circum-
stances, almost as efficient as other analyses of repeated
measurements, and it provides a simple descriptive out-
come for each participant that incorporates all time-
dependent information. From a conceptual perspective,
such summary measures are justified because all appoint-
ments are equally important throughout follow-up. In
addition, it is relatively straightforward to incorporate
data from losses to follow-up into summary measures for
the main outcome variable: for each subject lost to follow-
up, we can estimate that he should have had at least two
visits over a four-week interval to bring his blood pressure
under control, and then he should have had at least one
visit every three months for the rest of the study period.
This allows us to obtain a summary measure of adherence
from each study participant, even if he/she is lost to fol-
low-up shortly after randomization. Second, in addition
to obtaining summary measures over time of key depend-
ent variables, we will also use generalized estimating
equations (GEE) to model the marginal expectations of
the outcome variables as a function of randomized assign-
ment [46,50,51]. The GEE approach takes into account
the correlations of the data derived from the same partic-
ipant, but the model coefficients are consistent even if the
covariance structure of the outcome variable is incorrectly
specified.
The second methodological consideration in this study is
derived from the fact that one of the randomized factors
applies to participating physician, rather than to patients.
In practice, then, study patients are nested within physi-
cians. Because of this 'multilevel' structure and the poten-
tial importance of group-level attributes in influencing
individual-level outcomes, we will analyze the data using
hierarchical models, also known as multilevel, random-
coefficient, or covariance component models [52-54].
These models can be conceptualized as two-stage systems
of equations, in which the individual variation within
each group is explained by an individual-level equation,
and the variation across groups in the group-specific
regression coefficients is explained by a group-level equa-
tion. The main independent individual-level variable will
be the randomized patient assignment, and the main
independent group-level variable will be the randomized
physician assignment. The hierarchical models allow for
the simultaneous consideration of patient-specific and
physician-specific explanatory variables as well as for the
study of interactions between variables at patient and phy-
sician levels.
To guide our estimations of sample size and power, we
used the data from a previous meta-analysis of the evalu-
ation of effectiveness interventions to improve patient
adherence to estimate clinically relevant and feasible
treatment effects for the interventions and outcomes stud-
ied [55]. In this meta-analysis, the overall effect size for
interventions for appointment keeping, measured as a
function of the standard deviation of the outcome meas-
ure (Cohen's d), ranged from 0.40 to 0.70. We estimated
our sample size to detect as significant an effect size (in
standard deviation units) of 0.40, with 90% power and a
probability of type I error of 0.05 (two-sided). We also
assumed that the nesting of patients within physicians
would introduce some within physician correlation that
would decrease the efficiency of our estimators by about
30%. Under these assumptions, the estimated sample size
needed was 240 patients per group, for a total of 480
patients and 48 participating physicians. We planned to
enroll 50 physicians and 500 patients.
Ethics and Consent
The trial received approval from the Johns Hopkins Insti-
tutional Review Board. Informed written consent was
obtained from all participating physicians and patients.
Subjects were free to withdraw from the study at any time,
to refuse to answer any question, and to either stop audi-
otaping or to have audiotapes of any visit dropped from
the study. Confidentiality of the study data was main-
tained as follows: none of the patient information was
released to their physician, health care organization, or
any other party without the patients' permission. Phone
contacts to locate the study subject did not suggest the
content of the study. All study data were stored in locked
file cabinets at Johns Hopkins and not the clinical sites.
Personal identifiers were removed as soon as possible.
Audiotape data were transferred onto CD-ROMs for cod-
ing purposes, and stored in locked files after identifiers
were removed. A code key is kept in a separate location
restricted to the principal investigator and project director.
Each organization received an incentive of $200 per par-
ticipating physician and each patient received $25 for
completing each interview/exam (a maximum of $75 for
completing the baseline, three-month, and twelve-month
assessments).
Baseline characteristics of study sample
Baseline characteristics of the physicians
Physicians were enrolled between January 2002 and Janu-
ary 2003. We contacted 133 physicians, of whom 110
responded; 23 physicians did not respond despite several
phone calls, faxes, and emails from the study. Fifty-three
Implementation Science 2009, 4:7 />Page 10 of 16
(page number not for citation purposes)
physicians agreed and 57 refused, citing lack of time or
interest. Two of the 53 physicians who agreed to partici-
pate left their clinical site before baseline data collection,
and one physician was determined to be ineligible
because she had no primary care patients and delivered
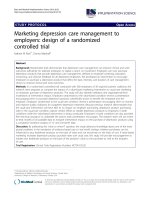
only urgent care.(Figure 2) Characteristics of the 50 physi-
cians recruited to the study are shown in Table 3. They
were mostly general internists (74%) with a mean age of
43.0 years and mean practice experience of 11.9 years. Just
over half (52%) were women, and they were ethnically
diverse. Most were very confident in their ability to care
for socially disadvantaged (60%), ethnic minority (70%),
and hypertensive patients (82%); however, only a third
(34%) were confident in their ability to care for non-
adherent patients.
Baseline characteristics of patients
Patients were enrolled between September 2003 and
August 2005. We sent letters to 9,077 patients who were
identified by claims data to be potentially eligible. Of
these patients, 287 letters were returned undelivered, and
908 patients refused by a mail-in post card. Research staff
attempted calls to or approached onsite 3,240 patients.
No attempt was made to call the remaining 4,642 of these
patients for several reasons, including: 1) their physician
withdrew from the study before patient recruitment was
complete; 2) the targeted number of patients for the tar-
geted physician was already scheduled; and 3) the health
plan to which the patient belonged would not allow
research staff to call until the patient had signed a HIPAA
privacy authorization form and returned it to the office
manager first. Of the 3,240 patients for whom calls or
contact was attempted, 1,375 patients were contacted (by
either by phone or in-person onsite), and 1,865 patients
were not contacted (e.g., patient was deceased, phone dis-
connected, no answer, left message, busy, or wrong
number). There were 395 patients for whom eligibility
was not assessed because the patient refused immediately
when approached. Eligibility was assessed for 980
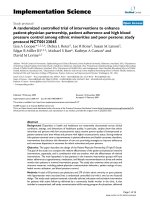
patients. Figure 3 shows the recruitment outcome for the
980 patients for whom eligibility was assessed. Table 4
shows baseline characteristics of the 279 patients who
enrolled in the study. These patients were 61.3 years on
average; 66% were women and 62% were African Ameri-
can. The average number of years of education was 11.8
years, but only 19% were employed full-time, and 70% of
the sample reported an annual household income of less
than $35,000. Ninety percent had health insurance and
92% had prescription drug coverage. Diabetes was the
most common co-morbid medical condition (44%), fol-
lowed by depression (24%), and coronary heart disease
(17%). The sample had a mean body mass index of 32.9,
and 48% had controlled blood pressure using JNC-7 crite-
ria. Table 5 shows patient reports of self-reported adher-
ence, physicians' participatory decision-making, and
satisfaction with care at baseline.
Discussion
This study has several strengths and as such, its expected
impact is significant. There is strong evidence that patient-
Table 3: Patient-Physician Partnership Study: Demographic and Baseline characteristics for n = 50 physicians
Characteristic No. of Physicians
(%)
Mean (standard deviation)
Age, years 43.0 (9.3)
Women 26 (52)
Ethnicity
African American 16 (32)
Asian 10 (20)
White 19 (38)
Hispanic/other 2 (4)
Practice experience, years 11.9 (8.4)
Internal medicine 37 (74)
U.S. medical graduate 37 (74)
Board certified 45 (90)
CME in communication skills 21 (42)
CME in hypertension 31 (63)
Very confident caring for:
Socially disadvantaged 30 (60)
Minority patients 35 (70)
Hypertensive patients 41 (82)
Non-adherent patients 17 (34)
Strongly agree:
Communicate effectively 15 (30)
Gain patients' trust 7 (14)
Patients as partners in treatment 8 (16)
Implementation Science 2009, 4:7 />Page 11 of 16
(page number not for citation purposes)
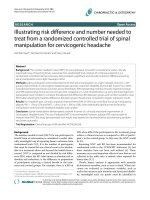
Patient-Physician Partnership study CONSORT flowchart for physiciansFigure 2
Patient-Physician Partnership study CONSORT flowchart for physicians.
Assessed for eligibility (n=133)
Excluded (n=83)
Not meeting inclusion criteria
(n=3)
Refused to participate
(n=57)
Other reasons
(n=23 did not respond)
Analyzed (n=22)
Excluded from analysis (n= 3 )
Illness, lost to follow-up,
withdrawal from study
Lost to follow-up
(n= 1)
Unable to contact
Discontinued intervention (n= 2)
Illness (1), Withdrew (1)
Allocated to intensive intervention
(n= 25)
Received allocated intervention
(n= 22)
Did not receive allocated intervention
(n=3)
Failed to complete workbook
Lost to follow-up
(n= 6)
Left clinical site
Discontinued intervention (n= 0)
Allocated to minimal intervention
(n= 25)
Received allocated intervention
(n= 25)
Did not receive allocated intervention
(n= 0)
Analyzed (n=19)
Excluded from analysis (n= 6 )
Left clinical site prior to patient
recruitment
Allocation
Analysis
Follow-Up
April- September 2006
Enr ollment
January 2002-January 2003
Randomized (n=50)
Implementation Science 2009, 4:7 />Page 12 of 16
(page number not for citation purposes)
centered communication behaviors impact upon patient
adherence, patient satisfaction, and important health out-
comes. Because racial, ethnic, and social class disparities
in health care exist across disease conditions and types of
care (preventive, diagnostic, and therapeutic procedures),
this suggests that fundamental aspects of healthcare, such
as patient-provider communication, may play a role. Fur-
thermore, studies show that ethnic minority patients
experience lower levels of patient-centered communica-
tion and greater verbal passivity with physicians than
whites and patients with higher levels of education
[56,57].
Communication skills programs that prepare health care
providers to deliver high quality interpersonal and techni-
cal health care to an ethnically and socially diverse popu-
lation are a promising mechanism by which disparities in
health care may be reduced. Additionally, culturally tar-
geted patient interventions that increase engagement, acti-
vation, and empowerment among ethnic minorities and
persons living in poverty are likely to increase patients'
ability to: 1) fully participate in the medical interview, 2)
negotiate treatment plans by engaging in joint problem-
solving and collaborative treatment decision-making with
physicians, 3) adhere to treatment and management rec-
ommendations, and 4) improve health outcomes. We
have incorporated several successful features of previous
interventions in ethnic minority and socio-economically
disadvantaged populations in our proposed study as well
as a number of novel elements. We propose the use of
multifaceted (educational, behavioral, and affective)
intervention approaches, incorporating culturally and lin-
guistically appropriate methods tailored to individuals'
needs (e.g., the use of community health workers as inter-
Table 4: The Patient-Physician Partnership Study: Baseline Demographic and Clinical Characteristics for 279 Patients
Characteristic No. of patients (%) Mean (standard deviation)
Age, years 61.3 (11.8)
Gender, female 184 (66.0)
Race
African American 173 (62.0)
Asian 3 (1.1)
White 101 (36.2)
Marital status, married 98 (35.4)
Education
< High school graduate 87 (31.3)
Years 11.8 (2.4)
REALM, ≥ 9
th
grade 173 (62.9)
Income
< $10,000 98 (37.7)
< $35,000 170 (70.0)
Employed
Full time 51 (18.6)
Part time 16 (5.8)
Retired 96 (35.0)
Disabled 59 (21.5)
Healthcare insurance 249 (90.0)
Medicaid 85 (30.7)
Medicare 107 (38.9)
Other 140 (50.9)
Prescription plan 257 (92.8)
MOS-SF-12 physical component 40.3 (12.2)
MOS-SF-12 mental component 50.5 (10.9)
Comorbid medical cond.
Diabetes 121 (44.0)
CVD 48 (17.4)
Angina 25 (9.2)
Heart failure 16 (5.9)
Stroke 15 (5.4)
Kidney failure 10 (3.7)
Depression 64 (23.5)
Body mass index 32.9 (8.1)
Systolic blood pressure 135.3 (19.4)
Diastolic blood pressure 75.9 (12.9)
Blood pressure control (JNC-7) 130 (48.0)
Implementation Science 2009, 4:7 />Page 13 of 16
(page number not for citation purposes)
ventionists to address common cultural beliefs and prac-
tices, the development of a participatory photonovel that
is engaging and user-friendly) to support the therapeutic
partnership from both the patient and physician perspec-
tive. It is also expected that involvement of practice lead-
ers in all aspects of study design, intervention
development and implementation, and participant
recruitment and follow up, will enhance the external
validity of this study.
Limitations of the study include: 1) loss to follow-up
among randomized physicians, which affected the
number of patients that could be enrolled into the study;
2) failure to reach the recruitment target among patients,
which may reduce the study's statistical power to detect
differences in the primary outcome, 3) the lack of
repeated exposures to the intervention for physicians and
the reliance on telephone follow-up for all contacts except
the first intervention contact for patients; 4) the relatively
small percentage of the sample that had uncontrolled
blood pressure at baseline (52%); and 5) variability in the
accessibility and quality of administrative data from the
large number of health plans.
Nonetheless, because it addresses many limitations of
previous studies, The Patient-Physician Partnership to
Improve High Blood Pressure Adherence will provide new
knowledge about how to improve patient adherence,
quality of care, and cardiovascular outcomes and how to
reduce disparities in care and outcomes of ethnic minority
and poor persons with hypertension.
Competing interests
The authors declare that they have no competing interests.
Authors' contributions
LC, DR, LB, EM, MB, and DL conceived of and designed
the study. LC, DR, SL, EM and KC participated in the anal-
ysis and interpretation of data. KC provided statistical
expertise. LC and DR drafted the article. All authors read
and approved the final manuscript.
Acknowledgements
The authors would like to thank all of the research staff (interviewers and
data collectors, community health workers, and administrative assistants)
at Johns Hopkins, the staff at all of the participating clinical sites, all of the
participating physicians, the organizational leaders, and the patients, for
making the successful completion of this study possible. The authors would
also like to thank Dr. Eliseo Guallar for his assistance with the design of the
analysis plan for the study, Dr. Martha Hill for her logistical support during
the early stages of the project, Drs. Jessica Yeh and Ana Navas-Acien for
their assistance with assembling data for the recruitment sample and with
the randomization scheme, and the DSMB members, Drs. Cynthia Rand,
Daniel Ford, Michael Klag, and Neil Powe for their valuable insights and sug-
gestions to optimize participant recruitment and retention and to focus on
the measurement of outcomes that would be of critical importance to the
fields of cardiovascular outcomes and healthcare disparities research. This
work was supported by a grant from the National Heart, Lung, and Blood
Institute (R01HL69403).
Table 5: Patient-Physician Partnership Study: Baseline Adherence, Participatory Decision Making and Satisfaction for 279 Patients
Characteristic No. of Patients
(%)
Mean (standard deviation)
Hill-Bone Scale
Sodium subscale 5.4 (1.6)
Appointment subscale 2.7 (1.0)
Medication subscale 10.3 (2.0)
Total 18.4 (3.0)
Medication non-adherence* 98 (36.4)
Participatory Decision Making 69.7 (23.3)
Satisfaction:
Satisfied with visit
Neutral to strongly disagree 4 (1.5)
Agree 139 (50.9)
Strongly agree 130 (47.6)
Would recommend MD
Neutral or disagree 3 (1.1)
Agree 187 (68.5)
Strongly agree 83 (30.4)
*Medication non-adherence (Morisky) = a positive response to at least one of four questions regarding forgetting to take medications, stopping
medications because of feeling better, stopping medications because of feeling worse, and missing medications because of carelessness.
** Participatory Decision-Making is measured using patient ratings of physicians' likelihood of giving the patient choice, control, responsibility in
decision-making and scored on a 0–100 point scale.
Implementation Science 2009, 4:7 />Page 14 of 16
(page number not for citation purposes)
Patient-Physician Partnership study CONSORT flowchart for patientsFigure 3
Patient-Physician Partnership study CONSORT flowchart for patients.
Assessed for eligibility (n= 980)
947 by phone
33 onsite
Excluded (n=701 )
Not meeting inclusion criteria
(n=375)
Refused to participate
(n= 43)
Other reasons
(n=283)
266 willing to participate but did not
show up for enrollment
17 willingness unknown
3-mo Lost to follow-up (n=50)
10 dropouts
40 unable to contact/schedule/no shows
12-mo Lost to follow-up (n=27)
Dropouts (12), Deceased (2), Unable to
contact/schedule (4), No shows (9)
Discontinued intervention (11 Withdrew)
No phone follow-up (18); 1 phone
(23); 2 phone (18)
;
3 phone (15); 4 phone
(27); 5 phone (39)
Allocated to intensive intervention
(n= 140)
Received allocated intervention
(n= 136)
Did not receive allocated intervention
(n= 4)
1 adverse event at the baseline visit
3 miscommunication with study staff
3-mo Lost to follow-up (n= 44)
4 dropouts
40 unable to contact or schedule
12-mo Lost to follow-up (n=21)
Dropouts (8), Deceased (3), Unable
to contact/schedule (4), No shows (6)
Discontinued intervention
(n= 0)
Allocated to minimal intervention
(n= 139)
Received allocated intervention
(n= 139)
Did not receive allocated intervention
(n= 0)
Allocation
Follow-Up
February 2004 - January 2007
Enr ollment
September 2003-August 2005
Randomized (n=279)
Implementation Science 2009, 4:7 />Page 15 of 16
(page number not for citation purposes)
References
1. Institute of Medicine: Unequal Treatment: Confronting Racial
and Ethnic Disparities in Health Care. National Academy Press,
Washington, DC; 2003.
2. Pappas G, Queen S, Hadden W, Fisher G: The increasing disparity
in mortality between socioeconomic groups in the united
states, 1960 and 1986. N Engl J Med 1993, 329 ER:103-109.
3. Williams DR: Black-white differences in blood pressure: The
role of social factors. Ethn Dis 1992, 2:126-141.
4. Benzeval M, Judge K, Whitehead M: Tackling Inequalities in Health: An
Agenda for Action London: King's Fund ER; 1995.
5. Weissman JS, Stern R, Fielding SL, Epstein AM: Delayed access to
health care: Risk factors, reasons, and consequences. Ann
Intern Med 1991, 114 ER:325-331.
6. Andrulis DP: Access to care is the centerpiece in the elimina-
tion of socioeconomic disparities in health. Ann Intern Med
1998, 129:412-416.
7. Penchansky R, Thomas JW: The concept of access: Definition
and relationship to consumer satisfaction. Med Care 1981,
19:127-140.
8. Andersen RM, McCutcheon A, Aday LA, Chiu GY, Bell R: Exploring
dimensions of access to medical care. HSR 1983, 18:49-74.
9. Rask KJ, Williams MV, Parker RM, McNagny SE: Obstacles predict-
ing lack of a regular provider and delays in seeking care for
patients at an urban public hospital. JAMA 1994,
271:1931-1933.
10. Hayward RA, Bernard AM, Freeman HE, Corey CR: Regular source
of ambulatory care and access to health services. Am J Public
Health 1990, 81 ER:434-438.
11. Cooper LA, Brown C, Vu HT, Ford DE, Powe NR: How important
is intrinsic spirituality in depression care? A comparison of
white and African-American primary care patients. J Gen
Intern Med 2001, 16:634-638.
12. Perez-Stable EJ, Marin G, Posner SF: Ethnic comparison of atti-
tudes and beliefs about cigarette smoking.
J Gen Intern Med
1998, 13:167-174.
13. Young DR, Miller KW, Wilder LB, Yanek LR, Becker DM: Physical
activity patterns of urban African Americans. J Community
Health 1998, 23:99-112.
14. Shaw BA, Krause N: Exploring race variations in aging and per-
sonal control. J Gerontol B Psychol Sci Soc Sci 2001, 56:S119-24.
15. Carrasquillo O, Orav EJ, Brennan TA, Burstin HR: Impact of lan-
guage barriers on patient satisfaction in an emergency
department. J Gen Intern Med 1999, 14:82-87.
16. Derose KP, Baker DW: Limited English proficiency and Lati-
nos' use of physician services. Med Care Res Rev 2000, 57:76-91.
17. Gazmararian JA, Baker DW, Williams MV, et al.: Health literacy
among medicare enrollees in a managed care organization.
JAMA 1999, 281:545-551.
18. Baker DW, Parker RM, Williams MV, Clark WS, Nurss J: The rela-
tionship of patient reading ability to self-reported health and
use of health services. Am J Public Health 1997, 87:1027-1030.
19. Boulware LE, Ratner LE, Cooper LA, Sosa JA, LaVeist TA, Powe NR:
Understanding disparities in donor behavior: Race and gen-
der differences in willingness to donate blood and cadaveric
organs. Med Care 2002, 40:85-95.
20. Ayanian JZ, Cleary PD, Weissman JS, Epstein AM: The effect of
patients' preferences on racial differences in access to renal
transplantation. N Engl J Med 1999, 341:1661-1669.
21. Cooper LA, Gonzales JJ, Gallo JJ, et al.: The acceptability of treat-
ment for depression among African-American, hispanic, and
white primary care patients. Med Care 2003, 41:479-489.
22. Kaplan SH, Gandek B, Greenfield S, Rogers W, Ware JE: Patient and
visit characteristics related to physicians' participatory deci-
sion-making style. results from the medical outcomes study.
Med Care 1995, 33:1176-1187.
23. Cooper-Patrick L, Gallo JJ, Gonzales JJ,
et al.: Race, gender, and
partnership in the patient-physician relationship. JAMA 1999,
282:583-589.
24. Wagner EH, Bennett SM, Austin BT, Greene SM, Schaefer JK, Vonko-
rff M: Finding common ground: Patient-centeredness and evi-
dence-based chronic illness care. J Altern Complement Med 2005,
11:s7-s15.
25. Shields CG, Epstein RM, Fiscella K, et al.: Influence of accompa-
nied encounters on patient-centeredness with older
patients. J Am Board Fam Pract 2005, 18:344-354.
26. van Ryn M, Burke J: The effect of patient race and socio-eco-
nomic status on physicians' perceptions of patients. Soc Sci
Med 2000, 50:813-828.
27. Weisse CS, Sorum PC, Sanders KN, Syat BL: Do gender and race
affect decisions about pain management? J Gen Intern Med
2001, 16:211-217.
28. Schneider EC, Cleary PD, Zaslavsky AM, Epstein AM: Racial dispar-
ity in influenza vaccination: Does managed care narrow the
gap between African Americans and Whites? JAMA 2001,
286:1455-1460.
29. Heaven C, Maguire P, Green C: A patient-centred approach to
defining and assessing interviewing competency. Epidemiol
Psichiatr Soc 2003, 12:86-91.
30. Berry LL, Seiders K, Wilder SS: Innovations in access to care: A
patient-centered approach. Ann Intern Med 2003, 139:568-574.
31. Anderson EB: Patient-centeredness: A new approach. Nephrol
News Issues 2002, 16:80-82.
32. Taylor R: Addressing barriers to cultural competence. J Nurses
Staff Dev 2005, 21:135-42. quiz 143–4
33. Doorenbos AZ, Schim SM, Benkert R, Borse NN: Psychometric
evaluation of the cultural competence assessment instru-
ment among healthcare providers. Nurs Res 2005, 54:324-331.
34. ASHP Ad Hoc Committee on Ethnic Diversity and Cultural Compe-
tence: Report of the ASHP ad hoc committee on ethnic diver-
sity and cultural competence. Am J Health Syst Pharm 2005,
62:1924-1930.
35. Beach MC, Gary TL, Price EG, et al.: Improving health care qual-
ity for racial/ethnic minorities: A systematic review of the
best evidence regarding provider and organization interven-
tions. BMC Public Health 2006, 6:104.
36. Kaplan SH, Greenfield S, Ware JE: Assessing the effects of physi-
cian-patient interactions on the outcomes of chronic dis-
ease. Med Care 1989, 27:S110-S127.
37. Roter DL: Patient participation in the patient-provider inter-
action: The effects of patient question asking on the quality
of interaction, satisfaction and compliance. Health Educ Monogr
1977, 50 ER:281-315.
38. Roter DL, Rudd RE, Frantz SC, Comings JP: Community-produced
materials for health education. Public Health Rep 1981,
96:169-172.
39. Roter DL, Rudd R, Keogh J, et al.: Worker produced health edu-
cation materials for health education materials for the con-
struction trades. International Quarterly of Community Health
Education 1987, 7 ER:109-121.
40. Levine DM, Bone LR, Hill MN, et al.: The effectiveness of a com-
munity-academic health center partnership to decrease the
level of blood pressure in an urban African-American popu-
lation. Ethn Dis 2003, Summer;13(3):354-61.
41. Roter DL, Larson S: The relationship between residents' and
attending physicians' communication during primary care
visits: An illustrative use of the Roter Interaction Analysis
system. Health Commun 2001, 13:33-48.
42. Mead N, Bower P: Measuring patient-centredness: A compari-
son of three observation-based instruments. Patient Educ Couns
2000, 39:71-80.
43. Roter D, Larson S: The Roter interaction analysis system
(RIAS): utility and flexibility for analysis of medical interac-
tions. Patient Educ Couns 2002, 46(4):
243-51.
44. Cooper LA, Roter DL, Johnson RL, Ford DE, Steinwachs DM, Powe
NR: Patient-centered communication, ratings of care, and
concordance of patient and physician race. Ann Intern Med
2003, 139(11):907-15.
45. Kim MT, Hill MN, Bone LR, Levine DM: Development and testing
of the Hill-Bone Compliance to High Blood Pressure Ther-
apy Scale. Prog Cardiovasc Nurs 2000, 15(3):90-6.
46. Diggle PJ, Liang K, Zeger SL: Analysis of Longitudinal Data Oxford:
Clarendon Press; 1994.
47. Albert PS: Longitudinal data analysis (repeated measures) in
clinical trials. Stat Med 1999, 18:1707-1732.
48. Senn S, Stevens L, Chaturvedi N: Repeated measures in clinical
trials: Simple strategies for analysis using summary meas-
ures. Stat Med 2000, 19:861-877.
49. Frison L, Pocock SJ: Repeated measures in clinical trials: Anal-
ysis using mean summary statistics and its implications for
design. Stat Med 1992, 11:1685-1704.
Publish with BioMed Central and every
scientist can read your work free of charge
"BioMed Central will be the most significant development for
disseminating the results of biomedical research in our lifetime."
Sir Paul Nurse, Cancer Research UK
Your research papers will be:
available free of charge to the entire biomedical community
peer reviewed and published immediately upon acceptance
cited in PubMed and archived on PubMed Central
yours — you keep the copyright
Submit your manuscript here:
/>BioMedcentral
Implementation Science 2009, 4:7 />Page 16 of 16
(page number not for citation purposes)
50. Zeger SL, Liang K: Longitudinal data analysis for discrete and
continuous outcomes. Biometrics 1986, 42 ER:121-130.
51. Liang K, Zeger SL: Longitudinal data analysis using generalized
linear models. Biometrika 1986, 73 ER:13-22.
52. Goldstein H: Multilevel Statistical Models New York: Halsted ER; 1995.
53. Kreft I, deLeeuw J: Introducing Multilevel Modeling London: Sage ER;
1998.
54. Diez-Roux AV: Multilevel analysis in public health research.
Annu Rev Public Health 2000, 21:171-192.
55. Roter DL, Hall JA, Merisca R, Nordstrom B, Cretin D, Svarstad B:
Effectiveness of interventions to improve patient compli-
ance: a meta- analysis. Med Care 1998, 36:1138-1161.
56. Johnson RL, Roter DL, Powe NR, Cooper LA: Patient race and the
quality of patient-physician communication during medical
visits. Am J Public Health 2004, 94:2084-2090.
57. Williams MV, Davis T, Parker RM, Weiss BD: The role of health lit-
eracy in patient-physician communication. Fam Med 2002,
34:383-9.