Báo cáo y học: " A controlled trial of value-based insurance design – The MHealthy: Focus on Diabetes (FOD) trial" docx
Bạn đang xem bản rút gọn của tài liệu. Xem và tải ngay bản đầy đủ của tài liệu tại đây (389.77 KB, 10 trang )
BioMed Central
Page 1 of 10
(page number not for citation purposes)
Implementation Science
Open Access
Study protocol
A controlled trial of value-based insurance design – The MHealthy:
Focus on Diabetes (FOD) trial
Alicen Spaulding
1,2
, A Mark Fendrick
1,3
, William H Herman
1,4
,
James G Stevenson
5
, DeanGSmith
3
, Michael E Chernew
6
,
Dawn M Parsons
7
, Keith Bruhnsen
7
and Allison B Rosen*
1,3,8
Address:
1
Department of Internal Medicine, University of Michigan School of Medicine, Ann Arbor, MI, USA,
2
Division of Epidemiology and
Community Health, University of Minnesota School of Public Health, Minneapolis, MN, USA,
3
Department of Health Management and Policy,
University of Michigan School of Public Health, Ann Arbor, MI, USA,
4
Department of Epidemiology, University of Michigan School of Public
Health, Ann Arbor, MI, USA,
5
Department of Clinical, Social and Administrative Sciences, University of Michigan College of Pharmacy, Ann Arbor,
MI, USA,
6
Department of Health Care Policy, Harvard University School of Medicine, Boston, MA,
7
University of Michigan Benefits Office, Ann
Arbor, MI, USA and
8
Ann Arbor VA HSR&D Center of Excellence, Ann Arbor Veterans Affairs Medical Center, Ann Arbor, MI, USA
Email: Alicen Spaulding - ; A Mark Fendrick - ; William H Herman - ;
James G Stevenson - ; Dean G Smith - ; Michael E Chernew - ;
Dawn M Parsons - ; Keith Bruhnsen - ; Allison B Rosen* -
* Corresponding author
Abstract
Background: Diabetes affects over 20 million Americans, resulting in substantial morbidity, mortality, and costs.
While medications are the cornerstone of secondary prevention, many evidence-based therapies are
underutilized, and patients often cite out-of-pocket costs as the reason. Value-based insurance design (VBID) is a
'clinically sensitive' refinement to benefit design which links patient cost-sharing to therapy value; the more
clinically beneficial (and valuable) a therapy is for a patient, the lower that patient's cost-sharing should be. We
describe the design and implementation of MHealthy: Focus on Diabetes (FOD), a prospective, controlled trial of
targeted co-payment reductions for high value, underutilized therapies for individuals with diabetes.
Methods: The FOD trial includes 2,507 employees and dependents with diabetes insured by one large employer.
Approximately 81% are enrolled in a single independent-practice association model health maintenance
organization. The control group includes 8,637 patients with diabetes covered by other employers and enrolled
in the same managed care organization. Both groups received written materials about the importance of
adherence to secondary prevention therapies, while only the intervention group received targeted co-payment
reductions for glycemic agents, antihypertensives, lipid-lowering agents, antidepressants, and diabetic eye exams.
Primary outcomes include medication uptake and adherence. Secondary outcomes include health care utilization
and expenditures. An interrupted time series, control group design will allow rigorous assessment of the
intervention's impact, while controlling for unrelated temporal trends. Individual patient-level baseline data are
presented.
Discussion: To our knowledge, this is the first prospective controlled trial of co-payment reductions targeted
to high-value services for high-risk patients. It will provide important information on feasibility of implementation
and effectiveness of VBID in a real-world setting. This program has the potential for broad dissemination to other
employers and insurers wishing to improve the value of their health care spending.
Published: 7 April 2009
Implementation Science 2009, 4:19 doi:10.1186/1748-5908-4-19
Received: 3 November 2008
Accepted: 7 April 2009
This article is available from: />© 2009 Spaulding et al; licensee BioMed Central Ltd.
This is an Open Access article distributed under the terms of the Creative Commons Attribution License ( />),
which permits unrestricted use, distribution, and reproduction in any medium, provided the original work is properly cited.
Implementation Science 2009, 4:19 />Page 2 of 10
(page number not for citation purposes)
Background
Medication adherence in diabetes
As health care costs continue to increase, payers are
searching for innovative interventions to strike a balance
between containing costs and improving health out-
comes, particularly for those with chronic conditions such
as diabetes mellitus. An estimated 7% of Americans, rep-
resenting 20.8 million people, have diabetes [1] and the
prevalence continues to rise [2]. The micro- and macro-
vascular complications of diabetes result in substantial
morbidity and mortality [3] and contribute significantly
to health care spending in the United States [4].
Medications are the cornerstone of secondary prevention
for individuals with diabetes. Randomized controlled tri-
als and national guidelines support the use of intensive
glucose, blood pressure, and lipid management to reduce
rates of serious complications and death [5]. Yet, medica-
tion adherence remains suboptimal [6,7]. In turn, poor
adherence is associated with disease progression and com-
plications, avoidable hospitalizations, increased health
care costs, lost productivity, premature disability, and
even increased mortality [8-12]. Further, it appears that
depression, which often co-exists with diabetes, is associ-
ated with worse adherence, poorer health outcomes, and
higher costs in individuals with diabetes [12-15].
Impact of co-payments on adherence
While improving medication adherence is critical to
improving diabetes outcomes, systematic reviews have
shown little effect of informational, behavioral, and social
interventions to improve adherence [16,17]. In contrast, a
recent systematic review demonstrated the substantial
impact co-payments have on medication adherence [18].
Cost sharing is generally applied in a non-targeted way,
without regard to the medication's therapeutic benefit.
Yet, this may create financial barriers to the very medica-
tions which would most benefit patients, raising two crit-
ical questions. First, can patients determine which drugs
are most valuable to their own health? Second, will they
choose to prioritize their medications accordingly to max-
imize health outcomes? Unfortunately, the evidence sug-
gests that cost sharing indiscriminately reduces the use of
both excess and essential (clear mortality and/or quality
of life benefit) medications [18-24]. In turn, growing evi-
dence suggests that individuals who decrease medication
utilization due to cost have poorer health outcomes
[18,21,22,24-27] and often incur higher health care costs
[18,23,27].
Value-based insurance design (VBID)
In response to growing evidence that 'one-size fits all' co-
payments harm patients, a more nuanced approach to
benefit design has been proposed. In this approach, co-
payments are based on the expected clinical benefit from
a drug, rather than solely on its acquisition cost [28-31].
Under such value-based insurance designs (VBID) the
more beneficial the medication, the lower the co-pay-
ment. VBID effectively realigns the incentives faced by
patients to increase utilization of and adherence to the
most beneficial and valuable medications.
Interestingly, the appeal of VBID has taken root primarily
outside of medicine – in the business world. In an effort
to slow health care cost growth, Fortune 500 employer
(and self-insurer) Pitney Bowes lowered co-payments for
asthma and diabetes medications in 2001. While no rigor-
ous evaluation was performed, they reported a one-year
one-million dollar savings to the Wall Street Journal [32].
Following Pitney Bowes' lead, several other employers
(e.g., Marriott, Procter & Gamble, Florida Power and
Light) have implemented VBID programs. Employer ben-
efit consultants (e.g., Hewitt, Mercer), disease manage-
ment companies (e.g., ActiveHealth Management),
pharmacy benefit managers (e.g., SXC Health Solutions,
Prime Therapeutics) and health plans (e.g., Aetna) have
also launched VBID-related products. While these benefit
designs hold promise for improving value of care, there
have been few controlled evaluations, and none that tar-
get co-payment reductions to specific services for specific
patient populations. Yet, 'targeting' is critical to improving
health care value. Patient risk and, therefore, benefit from
health services, is heterogeneous, with most services pro-
viding significantly higher value for patients at highest
risk. By altering co-payments so that the strongest incen-
tive to take a medication is targeted to those who will
most benefit from that therapy, the more likely the system
will be to maximize the health returns to spending,
thereby maximizing value.
Impetus for intervention trial
Institutional environment
In 2004, amidst pervasive gaps in both quality and access
to health care and continually increasing health care costs
(particularly for employers in Michigan), the University of
Michigan (UM) announced a major initiative to develop,
implement, and evaluate new models of care to improve
the health and well-being of the UM workforce in a cost-
effective manner. As part of this initiative, the MHealthy:
Focus on Diabetes (FOD) trial was designed and imple-
mented as a targeted co-payment reduction intervention
for UM employees and their dependents with diabetes.
The intervention was designed as a prospective controlled
study to allow for rigorous evaluation of the program's
impact.
Needs assessment
Diabetes was chosen for the focus of this intervention fol-
lowing a needs assessment which identified diabetes as
prevalent and adherence to evidence-based pharmaco-
Implementation Science 2009, 4:19 />Page 3 of 10
(page number not for citation purposes)
therapies as suboptimal in the UM population. While the
average patient with diabetes requires multiple medica-
tions for adequate glycemic control [5], over half the UM
employees and dependents with diabetes were using only
one hypoglycemic agent, suggesting a potential opportu-
nity for improvement. In turn, fewer than half were on an
angiotensin converting enzyme inhibitor or angiotensin
receptor blocker (ACE/ARB), and only half were on HMG-
CoA reductase inhibitors (statins). The critical role of co-
payments was documented in a prior investigation in M-
CARE (the setting of the current study), in which Ellis and
colleagues found two-year statin discontinuation rates of
50% to 100%, with the highest co-payments associated
with a four-fold increase in discontinuation [19].
Therapies selected for co-payment reductions
Interventions were selected based on evidence of health
benefits, guideline indications for use [5], and docu-
mented underutilization in clinical practice. They
included statins, ACE/ARBs, other antihypertensives, and
all hypoglycemic agents. Co-payments were also reduced
for antidepressants, as evidence suggests that diabetes self-
management practices (including medication adherence)
are better when comorbid depression is adequately
treated [33].
Methods
Study overview
The aim of this study was to examine the impact of tar-
geted co-payment reductions (targeted to high-value but
underutilized services) for an employed population with
diabetes. The intervention, initiated on 1 July 2006, com-
prised two elements: an educational letter detailing the
importance of medication adherence in diabetes, and tar-
geted co-payment reductions for several high-value thera-
pies. The intervention group received both elements
(detailed below), while a control group received the edu-
cational letter alone.
Hypotheses
We hypothesized that the removal of financial barriers to
evidence-based, high-value therapies will result in
improved uptake and adherence, and a more efficient use
of resources. Specific hypotheses are:
1. Compared to individuals with diabetes with usual co-
pays, those receiving targeted co-payment reductions for
high-value therapies will increase uptake of these thera-
pies and improve adherence to these therapies (condi-
tional upon their use).
2. Compared to payers for individuals with diabetes with
usual co-pays, payers for those receiving value-based co-
payment reductions will incur higher pharmaceutical
spending, lower non-pharmaceutical cost growth, and
lower overall cost growth. Importantly, we do not hypoth-
esize an absolute financial savings over previous years.
Rather, we posit that the rate of non-pharmaceutical cost
growth will be slower in the intervention group than in
the controls.
3. Among individuals with diabetes and depression, com-
pared to individuals with usual co-pays, individuals
receiving value-based co-payment reductions for high-
value therapies will have improved uptake and adherence
to antidepressants and improved uptake and adherence to
other study medications (statins, ACE/ARBs, other antihy-
pertensives and glycemic agents).
Study setting
The University of Michigan is a large Midwestern univer-
sity with an enrollment of nearly 50,000 students. The
university contracts with a single pharmacy benefits man-
ager (PBM), SXC Health Solutions, for all of its employ-
ees, dependents, and retirees. Retirees were excluded from
this study, however, because Medicare Part D and the
FOD intervention were implemented in close proximity,
making it difficult to isolate the effects of each from the
other. The approximately 70,000 active UM employees
and dependents are enrolled in several different health
plans. The most frequently chosen plan is M-CARE,
which, in 2006, enrolled approximately 81% of active UM
employees and dependents.
M-CARE is a UM-owned non-profit independent-practice
association model health maintenance organization
(HMO) with approximately 200,000 enrollees through-
out Southeastern Michigan in 2006. While UM enrollees
use the university-contracted PBM (SXC Health Solu-
tions), all other M-CARE enrollees receive pharmacy serv-
ices through CatalystRx, the M-CARE-contracted PBM at
the time the FOD intervention was initiated. Both SXC
and CatalystRx use the same claims processing platform,
allowing for acquisition of comparable data for both the
intervention and control groups in this study.
M-CARE has a diabetes disease management program
designed to improve patient adherence to recommended
diabetes care processes. Therefore, any measured effect of
targeted co-payment reductions is actually the incremen-
tal additional effect beyond the impact of the disease
management program.
Study population identification
The initial intervention population included 2,507 UM
employees and dependents enrolled in UM's pharmacy
benefits plan and identified as individuals with diabetes
based on at least one pharmacy claim for a diabetic
hypoglycemic medication (oral, injectable, or inhaled)
within the 12 months prior to intervention.
Implementation Science 2009, 4:19 />Page 4 of 10
(page number not for citation purposes)
The initial control population included 8,637 M-CARE
enrollees receiving coverage through other employers and
identified as individuals with diabetes using the same
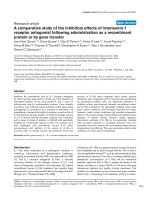
pharmacy claims criteria. Figure 1 depicts the intervention
and control groups and their relationship to the Univer-
sity and M-CARE.
While UM employee turnover is low, the population eligi-
ble for the intervention is not static. Both new UM
employees with pre-existing diabetes and current employ-
ees newly diagnosed with diabetes are automatically
enrolled in the intervention upon having an eligible phar-
maceutical claim filed. The automatic enrollment design
was chosen to reduce the burden of action required for
individuals to benefit from the co-payment reductions.
Participants could choose to opt-out of the program at any
time. Further, UM employees and dependents not identi-
fied from pharmacy claims can opt-in to the program by
contacting the Focus on Diabetes program coordinator
and self-identifying that they have diabetes. While eligible
for the full intervention, these 'opt-in' individuals will be
excluded from analyses because there is no comparable
control group.
Approvals and data safety and monitoring
The study was approved by the University of Michigan
Institutional Review Board and the Research Review Com-
mittee of M-CARE. All data are obtained and managed by
the UM pharmacy benefits manager, SXC Health Solu-
tions, and by M-CARE, both of which require personal
health information (PHI) in the course of their usual
activities. To ensure protection of confidentiality, unique
study identifiers are assigned to each patient and data are
stripped of PHI prior to transmission to the evaluation
team. Because the intervention constitutes a quality
improvement initiative (taking place regardless of evalua-
tion) and data are provided in limited datasets, informed
consent requirements were waived. However, individuals
were given the option to opt-out of the intervention at any
time.
Because the intervention involved a benefit change, addi-
tional approvals were obtained from the three unions rep-
resenting UM employees.
Study design
The study employs an interrupted time series design, with
medication adherence rates assessed at three-month inter-
vals (unit of observation is the patient-quarter), beginning
30 months prior to the intervention (the 'pre' period) and
continuing through the duration of the 30-month inter-
vention (the 'post' period). This study design provides a
strong test of the intervention's impact on medication
adherence, separate from other ongoing temporal changes
in adherence [34]. The advantage of this 'difference-in-dif-
ference' design is that any change in the control group val-
ues may reflect naturally occurring changes over time
(perhaps due to policy or medical care changes), while
any change in the UM intervention group values will
reflect both the same naturally occurring trends, as well as
the impact of the value-based co-payment reductions.
Procedures
Intervention
Educational letter
One month prior to the co-payment reductions, an educa-
tional letter was sent out, with information on the general
health benefits of medication adherence and the specific
benefits of ACE/ARBs, statins, and tight glycemic and
blood pressure control in diabetes. A phone number for a
nurse case manager was provided for questions. A brief
description of the impending co-payment reductions was
provided, as well as a statement allowing individuals to
opt-out of the study. A parallel educational letter was sent
to the control group, differing from the UM letter only in
exclusion of information about the co-payment reduc-
tions. The control group was also provided with a phone
number for a nurse case manager available for questions
[35,36].
Co-payment reductions
While the intervention was designed to reduce financial
barriers to effective therapies, it was not meant to preclude
Identification of intervention and control groupsFigure 1
Identification of intervention and control groups. The
large circle on the left (labeled 'U of M') depicts University of
Michigan employees and dependants. The large circle on the
right (labeled M-CARE) depicts M-CARE enrollees, with the
central area of overlap representing UM employees enrolled
in M-CARE. The subset of individuals with diabetes is
depicted by the shaded circle labeled 'Diabetes.' The inter-
vention group includes UM employees and dependents with
at least one pharmacy claim for a glycemic medication (oral,
injectable, or inhaled) within the 12 months prior to the
study timeframe. The control group consists of M-CARE
enrollees who are employees and dependents of other, non-
UM employers with at least one pharmacy claim for a glyc-
emic medication within the 12 months prior to the study
timeframe.
Implementation Science 2009, 4:19 />Page 5 of 10
(page number not for citation purposes)
the concomitant use of other incentive structures already
in place. When the intervention went into effect, UM had
a three-tiered formulary with co-pays of $7, $14, and $24
for generic (tier one), preferred brand (tier two), and non-
preferred brand (tier three) medications, respectively. This
underlying benefit structure was left intact with the value-
based benefit laid on top. To maintain the underlying
incentives to use lower cost drugs within a class, the inter-
vention lowered co-pays in a graded fashion (tier one co-
pays decreased by 100%, tier two by 50% and tier three by
25%) to a new three-tiered benefit structure of $0, $7, and
$18 co-payments, respectively.
Data collection
Pharmacy claims were obtained for the intervention
group from SXC Health Solutions, and for the control
group from CatalystRx. Non-pharmacy claims were
obtained from M-CARE for both groups. All data were
transferred to the M-CARE claims administration office,
which assigned unique study identifiers, managed the
linkage of patient data across data sources and over time,
and stripped the data of PHI prior to transfer to the evalu-
ation team.
Measures
Primary outcomes
The primary outcomes include medication utilization and
medication adherence. We define medication utilization
(or uptake) as at least one pharmacy fill of a medication
in the drug class of interest during each one-year time win-
dow (two pre- and two post-intervention); this is analo-
gous to the calculation of many performance measures,
including several Healthcare Effectiveness Data and Infor-
mation Set (HEDIS) measures [37]. For statins and ACE/
ARBs, medication uptake rates will be explored in the sub-
set of individuals identified by claims or laboratory data
to have a clear clinical indication for use (e.g., statins for
individuals with diagnosed hyperlipidemia or LDL cho-
lesterol above guideline recommended levels [5]).
We define medication adherence using medication pos-
session ratios (MPRs). The MPR is the ratio of the cumu-
lative days of medication supply obtained, divided by the
number of days supply which would be needed for perfect
adherence. To calculate the MPR, each day in a quarter
will be evaluated as 'covered' or 'not covered' by a refill; if
all days are 'covered' by a refill then the MPR will be
100%. MPRs will be calculated separately for each medi-
cation class (listed in Table 1) for each quarter. Rules for
handling early refills, dosage increases, and within-class
drug switches will be applied and have previously been
described [38]. For hospitalizations, we assume medica-
tions are hospital-supplied until discharge, at which time
the home supply is resumed. While the MPR is a measure
of refill adherence rather than a direct measure of medica-
tion taking behavior, it has been shown to correlate well
with patient outcomes [39].
Secondary outcomes
Secondary outcomes include health care utilization rates
(e.g., counts of outpatient visits, ER visits, hospitaliza-
tions) and health care spending. Pharmaceutical and non-
pharmaceutical expenditures will be examined both over-
all and disaggregated into the costs borne by the payer and
those assumed by the patient (i.e., out-of-pocket costs).
Model covariates
To ensure findings are due to the co-payment reductions
and not to underlying differences between the two groups,
models will adjust for age, gender, comorbidity, member
status (employee, spouse or dependent), and number of
medications taken. Comorbidity is assessed using the
Deyo modification to the Charlson comorbidity index
[40], a well-validated measure of the burden of comorbid
illness that was developed specifically for use with claims
data.
Statistical power
The intervention can increase appropriate medication use
in two ways: by increasing use in those currently not on
the medications of interest (i.e., increasing uptake), and
by increasing the adherence of patients who are taking the
medications. Based upon our original estimated sample
sizes of 2,131 in the intervention group and 4,000 in the
control group, and an average initial uptake rate of 50%
(based upon statins and ACE/ARBs), we will have 80%
power to detect an effect of 3.8% change in medication
utilization at a p = 0.05 significance level. In turn, based
Table 1: Drug classes receiving co-payment reductions: focus on
diabetes trial
Glycemic Agents
Metformin
Sulfonylureas
Thiazolidinediones
All other glycemic agents (except insulin*)
Antihypertensive Agents
ACE-Inhibitors & Angiotensin Receptor Blockers (ACE/ARB)
Beta blockers
Calcium Channel Blockers
Diuretics
Other antihypertensives
Lipid-Lowering Agents
HMG-CoA Reductase Inhibitors (statins)
Zetia
Other lipid lowering agents
Antidepressants
SSRSs/SNRIs
Tricyclic agents
Other antidepressants
*At the time of the intervention, M-CARE already waived copayments
for Insulin.
Implementation Science 2009, 4:19 />Page 6 of 10
(page number not for citation purposes)
upon average pre-intervention medication adherence
rates of 65% (based on statins and ACE/ARBs), we will
have 80% power to detect an effect of 3.5% change in
MPR (i.e., adherence) at the p = 0.05 significance level.
Statistical analyses
Medication utilization (or uptake)
We classify an individual as utilizing therapy if any of
their dispensed medications include a drug within the
drug class of interest, either alone or in combination with
another drug during each of the two one year windows in
the pre-period and two one-year windows in the post-
period. For analysis purposes, ACE-Inhibitors and ARBs
are considered one drug class.
Medication adherence
Analyses will assess both for a one-time effect of the inter-
vention on adherence and for a change in the rate of
change in adherence over time. Appropriate statistical
adjustments will be made to account for multiple obser-
vations (at each three-month interval) on the same indi-
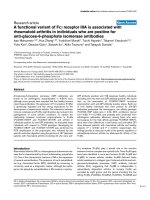
viduals. Our basic model will be a segmented multiple
time series regression, as specified in figure 2.
Health care expenditures
To implement the 'difference in difference' approach to
examining health care costs, we will use the same multiple
time-series regression approach specified above. Initial
cost models will use ordinary least squares with a log
transformation of costs to account for the skewness of the
distribution of health care expenditures. We will test two-
part econometric models against the one-part model
because the unit of analysis is the patient quarter, and
there may be several individuals with no spending in any
given quarter. The first part model will be a logit/probit
modeling the probability of non-zero expenditure, and
the second part will model expenditure conditional on
non-zero spending [41].
Subgroup analyses
Because depression is associated with worse adherence
and higher costs in individuals with diabetes [12-15], sub-
group analyses will be performed to explore for a differen-
tial effect of the intervention in those with depression. In
turn, because there may be important differences between
UM employees who enroll in M-CARE and those who
enroll in other health plans, analyses will be repeated with
and without the small subset enrolled in other health
plans.
Results
Sample characteristics
Over the first year, a total of 2,507 UM employees and
dependents with diabetes were included in the interven-
tion program, while 8,637 employees with diabetes and
dependents with diabetes of other employers were identi-
fied for the control group. Table 2 shows the baseline
characteristics of both groups. The mean age was 45.1
years in the intervention group and 47.5 years in the con-
trol group. The intervention group had slightly more
women than the control group (57.7% versus 53.1%), but
health was comparable between the two groups, with
Charlson scores of 1.43 and 1.46 in the intervention and
control groups, respectively. The baseline rates of met-
formin and statin use were similar between the two
groups. In contrast, baseline SSRI use was significantly
higher (21.7% versus 18.9%), and ACE/ARB use signifi-
cantly lower (48.7% versus 43.4%, P < 0.01) in the inter-
vention group relative to the controls.
Acceptability of intervention
The FOD Trial was successfully implemented on 1 July
2006. Comprehensive data is currently being collected
and will be fully analyzed upon completion of the 30-
month intervention window. The automatic enrollment
design was well-received, with very few individuals choos-
ing to opt-out of the program. Numerous e-mail testimo-
nials have been received from employees and dependents
that have benefited from the program. In addition, the
intervention has been very well-received by various stake-
holders including those at the University of Michigan
[35,42] and the Michigan state legislature [43], who have
expressed interest in expanding such programs to other
chronic diseases, pending the results of this trial.
Discussion
As health care costs continue to rise, payers are increas-
ingly shifting costs to patients through higher deductibles
and co-payments [32]. Yet, uniform increases in co-pay-
ments may curb the use of both low-value and high-value
therapies alike, potentially resulting in adverse health
consequences in individuals with chronic diseases
[18,44]. VBID has been proposed specifically to offset the
adverse clinical effects of rising out-of-pocket costs, by set-
ting the patient co-payment amount relative to the value
– not exclusively the cost – of the therapy [28-31]. While
several large employers and insurers are experimenting
with VBID type programs, there have been no prospective
controlled evaluations of the impact of such programs in
actual practice.
This trial is the first of its kind – an intervention of tar-
geted co-payment reductions for specific high-value ther-
apies in specific high-risk patients – designed both to
improve adherence to evidence-based therapies by
patients with diabetes in the workforce, but also to allow
for rigorous evaluation of the program's effectiveness. The
trial's progress to date has demonstrated the feasibility of
implementing targeted, value-based benefit design
changes in practice. The automatic opt-in design of the
Implementation Science 2009, 4:19 />Page 7 of 10
(page number not for citation purposes)
Segmented multiple time series regression modelFigure 2
Segmented multiple time series regression model.
$
ȕ
F
LW
&ȕ;
LW
ȕ
80
LW
ȕ
3RVW
LW
ȕ
7LPH
L
ȕ
7LPHSRVW
L
80
LW
7LPH
L
ȕ
80
LW
3RVW
LW
ȕ
80
LW
7LPHSRVW
L
İ
LW
where:
$
LW
$GKHUHQFHRIHQUROOHHµL¶DWWLPHµW¶L WKHLQGLYLGXDO
W WLPHLQTXDUWHUV& DFRQVWDQW
;
LW
$YHFWRURIFRQWUROYDULDEOHVDJHJHQGHUHWF
80
LW
$QLQGLFDWRUVHWWRLIWKHLQGLYLGXDOLVD80HPSOR\HHLQWKHLQWHUYHQWLRQJURXS
DVRSSRVHGWRDFRQWURO
3267
LW
DQLQGLFDWRUVHWWRLIWKHREVHUYDWLRQLVSRVWLQWHUYHQWLRQWRDGMXVWIRUVHFXODU
WUHQGV
7LPH
L
7LPHLQTXDUWHUVIURPWKHVWDUWRIWKHSUHLQWHUYHQWLRQSHULRGVHWWRIRUDOO
SRVWLQWHUYHQWLRQWLPHV
7LPHSRVW
L
7LPHLQTXDUWHUVDIWHUWKHLQWHUYHQWLRQ
İ
LW
DVWRFKDVWLFHUURUWHUP
7KHFRHIILFLHQWRQWKHLQWHUDFWLRQWHUP80
LW
7LPH
L
DVVHVVHVDGLIIHUHQFHLQVORSH
EHWZHHQWKHLQWHUYHQWLRQDQGFRQWUROJURXSVSULRUWRLQWHUYHQWLRQ7KHFRHIILFLHQWRQWKH
LQWHUDFWLRQWHUP80
LW
3RVW
LW
PHDVXUHVDRQHWLPHHIIHFWRIWKHLQWHUYHQWLRQRQ
DGKHUHQFH7KHFRHIILFLHQWRQWKHLQWHUDFWLRQWHUP80
LW
7LPHSRVW
L
PHDVXUHVDFKDQJH
LQWKHVORSHRIDGKHUHQFHGXHWRWKHLQWHUYHQWLRQWKDWLVDERYHDQGEH\RQGDQ\HFRORJL
FKDQJHVRFFXUULQJLQDGKHUHQFH$QDO\VHVZLOOEHEDVHGRQLQGLYLGXDOOHYHOGDWDDQGD
YHFWRURIFRYDULDWHV;
LW
ZLOOEHLQFOXGHGLQWKHPRGHOWRHQVXUHWKDWFRQWUROVDUHDVOLNH
WRWKHLQWHUYHQWLRQJURXSDVSRVVLEOH
Implementation Science 2009, 4:19 />Page 8 of 10
(page number not for citation purposes)
intervention has created near unanimous participation.
No significant barriers to implementation have been
encountered to date, and the intervention continues to
receive strong employee-level and institutional-level sup-
port at UM. Planned analyses will determine the interven-
tion's impact on the uptake of and adherence to evidence-
based medications, as well as the impact on the use and
cost of both pharmaceutical and non-pharmaceutical
health services.
This study has some limitations. First, determining the
effect of the co-payment reductions above any effects due
to secular trends in adherence can be difficult. Second,
although the control group was identified from the same
health plan using the same selection criteria used to iden-
tify the intervention group, differences remain between
these two groups because randomization was not part of
the study design. That noted, the interrupted time series,
control group design was specifically chosen because it
provides a strong test of whether the copayment reduc-
tions impact on medication adherence, separate from
other ongoing temporal changes in adherence or baseline
differences between the two groups [34].
Third, this trial is taking place in an evolving health care
marketplace, which may make it more difficult to isolate
the effect of the intervention from other ongoing benefit
design changes or quality-improvement initiatives. Again,
FOD's interrupted time series control group design offsets
this concern, to the extent possible, and is a key method-
ological strength of the trial. By assessing outcomes for an
intervention and a control group at multiple times both
before and after the intervention, we capture and can con-
trol for temporal trends due to other market factors, pro-
vided they do not occur in only one of the two groups at
the same time as the intervention is implemented.
Fourth, adherence is estimated using medication posses-
sion ratios, which assume that the supply of medication
dispensed is an adequate proxy for patient adherence.
However, because the intervention should have a direct
effect on pill-buying but only an indirect effect on pill-tak-
ing, MPR is likely to modestly overestimate actual adher-
ence, by causing some unknown number of patients to
buy but not take their medications. Further, if physicians
instruct patients to take medications differently than pre-
scribed, or if medications are stockpiled or conversely lost,
MPR may be an imperfect measure. However, the use of
MPR as a measure of adherence for controlled trials has
been validated by Steiner and colleagues and is used
extensively in clinical research [45]. Fifth, the trial focuses
on individuals with diabetes with employer-based health
insurance. While over 62% of the non-elderly U.S. popu-
lation has employer-based coverage [46], there is tremen-
Table 2: Baseline characteristics of the MHealthy: focus on diabetes sample
Characteristics Reduced Co-payments (Intervention) Standard Co-payments (Control)
Number of respondents enrolled 2,507 8,637
Mean age in years (SD) 45.1 (13.06) 47.5 (12.83)*
Female 57.7% 53.1%*
Basis for insurance coverage
Employee 62.3% 66.3%*
Spouse 31.1% 29.1%
Child 4.7% 4.0%
Other 1.9% 0.6%
Median Household Income
†
$55,086 $54,758
Charlson Comorbidity Score
‡
(SD) 1.43 (0.65) 1.46 (0.69)
Baseline Medication Utilization
Metformin 53.9% 53.6%
ACE/ARBs 43.4% 48.7%*
Statins 44.7% 44.5%
SSRIs 21.7% 18.9%*
*Significant at P < 0.05
†
Based-upon zip-code level median household income data
‡
Estimates based on the Deyo modification to the Charlson Index [40].
Implementation Science 2009, 4:19 />Page 9 of 10
(page number not for citation purposes)
dous heterogeneity in employer benefit packages and in
the health risk profiles of employees, potentially limiting
generalizability.
Sixth, a common difficulty with any policy intervention is
assessing for unintended consequences (or externalities)
which may arise as a result of the intervention. To the
extent we have anticipated them, we will examine for
potential externalities, such as formulary tier-shifting, in
which individuals shift from lower to higher tier drugs in
response to the co-payment reductions. Our intervention
maintained a cost advantage for using lower tiers, but the
extent of tier-shifting remains an empirical issue that we
will explore.
Finally, a practical issue related to the likely uptake of
VBID-type interventions merits mention. With health care
costs rising rapidly, payers are looking for ways to con-
strain cost growth, potentially limiting the appeal of ben-
efit design alterations which shift pharmaceutical costs
back to the employer from the patient. For the most part,
employers want to see a positive return on investment,
which is unlikely when framed solely in financial terms.
However, the true return on investment in health care is
health. When framed in these terms, employers should
expect and even demand a positive return on investment.
In conclusion, we have described the rationale, design,
and implementation of a prospective controlled trial
designed to test the effectiveness of targeted, value-based
co-payment reductions in improving medication adher-
ence among a population of individuals with diabetes
covered by employer-sponsored health insurance. Find-
ings from this study should provide needed insight into
the responsiveness of patients' medication-taking behav-
iors to targeted reductions in out-of-pocket costs, as well
as the impact on both pharmaceutical and overall health
care utilization and spending. This study is quite timely
given rapidly rising health care costs, increasing use of
consumer-directed health care (with its high cost-sharing
requirements), and continuing pervasive quality gaps
between the optimal use of high-value chronic disease
therapies and their actual use in practice [47,48]. Data
from this study will provide payers with needed insights
into the role of VBID to mitigate the adverse health conse-
quences of underuse due to high out-of-pocket expendi-
tures, while continuing to use cost-sharing to discourage
overuse.
Competing interests
The authors declare that they have no competing interests.
Authors' contributions
ABR had full access to all study data and takes responsibil-
ity for the integrity of the data and accuracy of the data
analysis. AS, AMF, WHH, JGS, DGS and ABR were respon-
sible for study concept and design. KB and DP acquired
the data. AMF, WHH, JGS, DGS, MEC and ABR analyzed
and interpreted the data. AS, AMF, WHH, MEC and ABR
drafted the manuscript. JGS, DGS, and KB critically
reviewed the manuscript for important intellectual con-
tent. ABR and AMF supervised the study. WHH, DP and
KB offered administrative, technical, or logistic support.
Acknowledgements
The authors would like to thank Beth Plachta, Jennifer Goewey, Laura Mor-
ris, Betsy Nota-Kirby, and Thomas Spafford for their hard work implement-
ing and managing the FOD intervention.
This study was funded by the University of Michigan Healthy Community
Initiative. Dr. Rosen was supported by NIH grant number K12-RR17607.
Drs. Rosen and Herman were supported by the Michigan Diabetes
Research and Training Center funded by the National Institute of Diabetes
and Digestive and Kidney Diseases (NIH Grant DK20572). Dr. Herman
also received support from the Centers for Disease Control and Preven-
tion.
References
1. National Diabetes Factsheet [ />template/ndfs_2005.pdf]
2. Mokdad AH, Bowman BA, Ford ES, Vinicor F, Marks JS, Koplan JP:
The continuing epidemics of obesity and diabetes in the
United States. Mokdad AH, Bowman BA, Ford ES, Vinicor F,
Marks JS, Koplan JP. JAMA 2001, 286:1195-1200.
3. Donahue RP, Orchard TJ: Diabetes mellitus and macrovascular
complications: An epidemiological perspective. Diabetes Care
1992, 15:1141-1155.
4. Thorpe KE: Factors accounting for the rise in health-care
spending in the United States: the role of rising disease prev-
alence and treatment intensity. Public Health 2006,
120:1002-1007.
5. American Diabetes Association: Standards of medical care in
diabetes – 2008. Diabetes Care 2008, 31:S12-S54.
6. Osterberg L, Blaschke T: Adherence to medication. N Engl J Med
2005, 353:487-497.
7. Cramer JA: A systematic review of adherence with medica-
tions for diabetes. Diabetes Care 2004, 27:1218-1224.
8. McDonnell PJ, Jacobs MR: Hospital admissions resulting from
preventable adverse drug reactions. Ann Pharmacother 2002,
36:1331-1336.
9. Schiff GD, Fung S, Speroff T, McNutt RA: Decompensated heart
failure: symptoms, patterns of onset, and contributing fac-
tors. Am J Med 2003, 114:625-630.
10. Senst BL, Achusim LE, Genest RP, Cosentino LA, Ford CC, Little JA,
Raybon SJ, Bates DW: Practical approach to determining costs
and frequency of adverse drug events in a health care net-
work. Am J Health Syst Pharm 2001, 58:1126-1132.
11. Rasmussen JN, Chong A, Alter DA: Relationship between adher-
ence to evidence-based pharmacotherapy and long-term
mortality after acute myocardial infarction. JAMA 2007,
297:177-186.
12. Rizzo JA, Abbott TA, Pashko S: Labour productivity effects of
prescribed medicines for chronically ill workers. Health Econ
1996, 5:249-265.
13. Ciechanowski PS, Katon WJ, Russo JE:
Depression and diabetes:
impact of depressive symptoms on adherence, function, and
costs. Arch Intern Med 2000, 160:3278-3285.
14. Hogan P, Dall T, Nikolov P, American Diabetes Association: Eco-
nomic costs of diabetes in the US in 2002. Diabetes Care 2003,
26:917-932.
15. DiMatteo MR, Lepper HS, Croghan TW: Depression is a risk fac-
tor for noncompliance with medical treatment: meta-analy-
sis of the effects of anxiety and depression on patient
adherence. Arch Intern Med 2000, 160:2101-2107.
Publish with BioMed Central and every
scientist can read your work free of charge
"BioMed Central will be the most significant development for
disseminating the results of biomedical research in our lifetime."
Sir Paul Nurse, Cancer Research UK
Your research papers will be:
available free of charge to the entire biomedical community
peer reviewed and published immediately upon acceptance
cited in PubMed and archived on PubMed Central
yours — you keep the copyright
Submit your manuscript here:
/>BioMedcentral
Implementation Science 2009, 4:19 />Page 10 of 10
(page number not for citation purposes)
16. Haynes RB, Yao X, Degani A, Kripalani S, Garg A, McDonald HP:
Interventions to enhance medication adherence. Cochrane
Database Syst Rev 2005, 4:CD000011.
17. Kripalani S, Yao X, Haynes RB: Interventions to enhance medi-
cation adherence in chronic medical conditions: a systematic
review. Arch Intern Med 2007, 167:540-550.
18. Goldman DP, Joyce GF, Zheng Y: Prescription drug cost sharing:
associations with medication and medical utilization and
spending and health. JAMA 2007, 298:61-69.
19. Ellis JJ, Erickson SR, Stevenson JG, Bernstein SJ, Stiles RA, Fendrick
AM: Suboptimal statin adherence and discontinuation in pri-
mary and secondary prevention populations. J Gen Intern Med
2004, 19:638-645.
20. Goldman DP, Joyce GF, Escarce JJ, Pace JE, Solomon MD, Laouri M,
Landsman PB, Teutsch SM: Pharmacy benefits and the use of
drugs by the chronically ill. JAMA 2004, 291:2344-2350.
21. Johnson RE, Goodman MJ, Hornbrook MC, Eldredge MB: The
impact of increasing patient prescription drug cost sharing
on therapeutic classes of drugs received and on the health
status of elderly HMO members. Health Serv Res 1997,
32:103-122.
22. Piette JD, Wagner TH, Potter MB, Schillinger D: Health insurance
status, cost-related medication underuse, and outcomes
among diabetes patients in three systems of care. Med Care
2004, 42(2):102-109.
23. Soumerai SB, Avorn J, Ross-Degnan D, Gortmaker S: Payment
restrictions for prescription drugs under Medicaid. Effects on
therapy, cost, and equity. N Engl J Med 1987, 317:550-556.
24. Tamblyn R, Laprise R, Hanley JA, Abrahamowicz M, Scott S, Mayo N,
Hurley J, Grad R, Latimer E, Perreault R, et al.: Adverse events
associated with prescription drug cost-sharing among poor
and elderly persons. JAMA 2001, 285(4):421-429.
25. Heisler M, Langa KM, Eby EL, Fendrick AM, Kabeto MU, Piette JD:
The health effects of restricting prescription medication use
because of cost. Med Care 2004, 42:626-634.
26. Schoen MD, DiDomenico RJ, Connor SE, Dischler JE, Bauman JL:
Impact of the cost of prescription drugs on clinical outcomes
in indigent patients with heart disease. Pharmacotherapy 2001,
21:1455-1463.
27. Soumerai SB, Ross-Degnan D, Avorn J, McLaughlin T, Choodnovskiy
I: Effects of Medicaid drug-payment limits on admission to
hospitals and nursing homes. N Engl J Med 1991, 325:1072-1077.
28. Fendrick AM, Smith DG, Chernew ME, Shah SN: A benefit-based
copay for prescription drugs: patient contribution based on
total benefits, not drug acquisition cost. Am J Manag Care 2001,
7:861-867.
29. Chernew ME, Rosen AB, Fendrick AM: Value-Based Insurance
Design. Health Affairs 2007, 26:w195-w203.
30. Rosen AB: Grounding Coverage in Value: A Paradigm to
Improve Quality and Contain Costs. Med Care 2006,
44:389-391.
31. Braithwaite RS, Rosen AB: Linking cost-sharing to value: an unri-
valed yet unrealized public health opportunity. Annals of Inter-
nal Medicine 2007, 146:602-605.
32. Hensley S: From 'one size fits all' to tailored co-payments.
Wall Street Journal. New York City 2004.
33. Pirraglia PA, Gupta S: The interaction of depression and diabe-
tes: a review. Curr Diabetes Rev 2007, 3:249-251.
34. Wagner AK, Soumerai SB, Zhang F, Ross-Degnan D: Segmented
regression analysis of interrupted time series studies in med-
ication use research. J Clin Pharm Ther 2002, 27:299-309.
35. MHealthy: Focus on Diabetes [ />mhealthy/improve/diabetes/index.html]
36. MHealthy: Focus on Diabetes Questions and Answers [http:/
/www.hr.umich.edu/mhealthy/improve/diabetes/diabetesqa.html]
37. HEDIS & Quality Measurement [ />Default.aspx]
38. Chernew ME, Shah MR, Wegh A, Rosenberg SN, Juster IA, Rosen AB,
Sokol MC, Yu-Isenberg K, Fendrick AM: Impact of decreasing
copayments on medication adherence within a disease man-
agement environment. Health Affairs 2008, 27:103-112.
39. Stroupe KT, Teal EY, Weiner M, Gradus-Pizlo I, Brater DC, Murray
MD: Health care and medication costs and use among older
adults with heart failure. Am J Med 2004, 116:443-450.
40. Deyo RA, Cherkin DC, Ciol MA: Adapting a clinical comorbidity
index for use with ICD-9-CM administrative databases. J Clin
Epidemiol 1992, 45:613-619.
41. Newhouse JP: An Iconoclastic View of Health Cost Contain-
ment. Health Affairs 1993, 12(Supp):152-171.
42. University of Michigan unveils innovative medication pro-
gram for employees and dependents with diabetes [http://
www.med.umich.edu/opm/newspage/2006/diabetes.htm]
43. State lawmakers honor University for employee health pro-
grams [ />]
44. Rosen AB, Hamel MB, Weinstein MC, Cutler DM, Fendrick AM, Vijan
S: Cost-effectiveness of full Medicare coverage of Angi-
otensin-Converting Enzyme Inhibitors for beneficiaries with
diabetes. Ann Intern Med 2005, 143:89-99.
45. Steiner JF, Koepsell TD, Fihn SD, Inui TS: A general method of
compliance assessment using centralized pharmacy records:
Description and validation. Med Care 1988, 26:814-823.
46. Blumenthal D: Employer-sponsored health insurance in the
United States-origins and implications. N Engl J Med 2006,
355:82-88.
47. McGlynn EA, Asch SM, Adams J, Keesey J, Hicks J, DeCristofaro A,
Kerr EA: The Quality of Health Care Delivered to Adults in
the United States. N Engl J Med 2003, 348:2635-2645.
48. Committee on Quality of Health Care in America, Institute of Medi-
cine: Crossing the Quality Chasm: A New Health System for the 21st Cen-
tury Washington, D.C.: National Academy Press; 2001.