báo cáo khoa học: " Rational Prescribing in Primary care (RaPP): process evaluation of an intervention to improve prescribing of antihypertensive and cholesterol-lowering drugs" ppsx
Bạn đang xem bản rút gọn của tài liệu. Xem và tải ngay bản đầy đủ của tài liệu tại đây (285 KB, 9 trang )
BioMed Central
Page 1 of 9
(page number not for citation purposes)
Implementation Science
Open Access
Research article
Rational Prescribing in Primary care (RaPP): process evaluation of
an intervention to improve prescribing of antihypertensive and
cholesterol-lowering drugs
Atle Fretheim*, Kari Håvelsrud and Andrew D Oxman
Address: Norwegian Knowledge Centre for the Health Services, PB 7004 St. Olavs plass, N-0130 Oslo, Norway
Email: Atle Fretheim* - ; Kari Håvelsrud - ; Andrew D Oxman -
* Corresponding author
Abstract
Background: A randomised trial of a multifaceted intervention for improving adherence to clinical
practice guidelines for the pharmacological management of hypertension and hypercholesterolemia
increased prescribing of thiazides, butdetected no impact onthe use of cardiovascular risk
assessment toolsor achievement of treatment targets. We carried out a predominantly quantitative
process evaluation to help explain and interpret the trial-findings.
Methods: Several data-sources were used including: questionnaires completed by pharmacists
immediately after educational outreach visits, semi-structured interviews with physicians subjected
to the intervention, and data extracted from their electronic medical records. Multivariate
regression analyses were conducted to explore the association between possible explanatory
variables and the observed variation across practices for the three main outcomes.
Results: The attendance rate during the educational sessions in each practice was high; few
problems were reported, and the physicians were perceived as being largely supportive of the
recommendations we promoted, except for some scepticism regarding the use of thiazides as first-
line antihypertensive medication. Multivariate regression models could explain only a small part of
the observed variation across practices and across trial-outcomes, and key factors that might
explain the observed variation in adherence to the recommendations across practices were not
identified.
Conclusion: This study did not provide compelling explanations for the trial results. Possible
reasons for this include a lack of statistical power and failure to include potential explanatory
variables in our analyses, particularly organisational factors. More use of qualitative research
methods in the course of the trial could have improved our understanding.
Background
From April 2002 to December 2003, we conducted a clus-
ter randomised-controlled trial with 146 general practices
in Norway – the Rational Prescribing in Primary care
(RaPP) trial [1]. We tested the effectiveness of a multifac-
eted intervention we had developed for improving adher-
ence to clinical practice guidelines for the
pharmacological treatment of hypertension and hyperc-
holesterolaemia. The main recommendations we set out
to implement were:
Published: 25 August 2006
Implementation Science 2006, 1:19 doi:10.1186/1748-5908-1-19
Received: 16 May 2006
Accepted: 25 August 2006
This article is available from: />© 2006 Fretheim et al; licensee BioMed Central Ltd.
This is an Open Access article distributed under the terms of the Creative Commons Attribution License ( />),
which permits unrestricted use, distribution, and reproduction in any medium, provided the original work is properly cited.
Implementation Science 2006, 1:19 />Page 2 of 9
(page number not for citation purposes)
• assessment of cardiovascular risk before deciding to start
antihypertensive or cholesterol-lowering treatment,
• use of thiazides as the first-line antihypertensive drug,
and
• achievement of treatment goals among patients started
on medication
The intervention was multifaceted and included an out-
reach visit conducted by one of four pharmacists recruited
and trained specifically for this purpose. The pharmacist
extracted information from the electronic medical records
on the practice's prescribing of antihypertensives, the level
of cardiac risk among patients started on treatment, and
the proportion of patients that had reached recom-
mended treatment goals. The pharmacist then met with
the physicians in their practice environment and pre-
sented recommendations on the prescribing of antihyper-
tensive and cholesterol-lowering therapy. The physicians
were invited to comment on the recommendations, and
data that had been extracted from their medical records
were fed back to them.
During the outreach visit, the pharmacist also installed
software, which triggered reminders on the computer
screens when physicians were seeing patients relevant to
the recommendations. The software also enabled the phy-
sicians to estimate cardiovascular risk and to print out
patient information.
The results from the trial demonstrated that the interven-
tion effectively increased the prescribing of thiazides, but
no effect was demonstrated on the assessment of cardio-
vascular risk or on the extent to which treatment goals
were achieved [1].
Prospectively, we decided to carry out a process evaluation
of the implementation of the intervention. This was moti-
vated by the belief that recording various process meas-
ures can provide insight into how the intervention was
perceived and implemented in clinical practice, and that
exploring this information could aid the interpretation of
trial-results [2]. We had hypothesised that the impact of
the intervention would be correlated to several variables,
including practice specific factors such as the attitude
among the physicians toward the recommendations, and
process measures, such as the proportion of physicians
attending the educational outreach visit. Thus, the main
objective of this analysis was to identify factors that could
explain variation in outcomes across practices.
Methods
Data collection
A logbook was kept throughout the project, and the two
lead investigators (AF and KH) made notes each time
there was contact with participating practices.
After each outreach visit the pharmacists completed a
questionnaire addressing various aspects of the visit, such
as the number of physicians attending the educational
session and the pharmacist's impression of how the phy-
sicians reacted to the clinical practice guidelines (table 2).
For most responses we used 5-point scales, ranging from
"negative" to "positive."
All practices in the intervention-group were telephoned by
one of the investigators (KH) 1–3 days after the visit, to
enquire about any difficulties that had been encountered.
Within three months after the outreach visit, we con-
ducted semi-structured telephone interviews with physi-
cians in the intervention-practices, asking about how the
intervention was perceived and their attitudes towards the
recommendations we were trying to implement (table 3).
The response options were "yes" or "no," or on a 3-point
scale (usually "negative," "neutral," "positive"), followed
up by an open question, such as "Why?". The interviews
were done by one of the investigators (AF or KH) or one
of the pharmacists who also conducted the outreach visits.
Responses to open-ended questions were coded in catego-
ries independently by AF and KH. Disagreements were
resolved by discussion. We offered a small compensation
to the physicians for participating (NOK 350).
Data on prescribing and achievement of treatment goals
were extracted from the electronic medical records. The
data on prescribing enabled us to identify patients that
had been started on medication, and we asked physicians
(by telephone) about whether they had conducted cardi-
ovascular risk assessment first.
Table 1: Characteristics of practices randomised to receiving
intervention
n (%)
Location
• Oslo-area 63 (86)
• Tromsø-area 10 (14)
Number of physicians per practice*
• One 16 (23)
• Two 22 (31)
• Three 15 (21)
• Four 7 (10)
• Five or more 11 (15)
*Data missing from two practices
Implementation Science 2006, 1:19 />Page 3 of 9
(page number not for citation purposes)
Analyses
We selected potential explanatory variables for each main
outcome based on our own judgement and discussion
with a general practitioner. We conducted initial, univari-
ate regression analyses to explore the association between
the selected variables and the observed variation across
practices. The variables that predicted the dependant vari-
able at a statistical significance-level of p < 0.30 were
included in the main analysis, which was a multivariate
regression model for each main outcome. Units of analy-
sis were the practices, and the calculations were done
using the enter-command in SPSS 12.
For two outcomes (prescribing of thiazides and achieve-
ment of treatment-goals) we had measurements from
before and after the intervention, and we used difference
as the dependant variable. For assessment of cardiovascu-
lar risk we only had post-intervention data, which we used
as the dependant variable.
Results
Out of 388 invited practices, 146 agreed to participate by
returning a signed informed consent document. In most
cases, no specific reason was stated for not wanting to take
part. The location and size (number of physicians) of the
73 practices randomised to the intervention group are
summarised in Table 1. We managed to collect outcome-
data from 70 of the 73 intervention practices. For three of
the 70 practices, we were unable to complete outreach vis-
its to, and the pharmacist questionnaire was missing for
one visit. Thus, completed questionnaires by pharmacists
were available for 66 outreach visits.
On average, 2.3 physicians per practice attended the meet-
ing with the pharmacist (interquartile range 1 to 3), corre-
sponding to an average attendance rate of 85%
(interquartile range 67 to 100). The meetings lasted an
average of 33 minutes (interquartile range: 30 to 40).
Seven individual physicians declined having software for
reminders installed on their computer.
The pharmacists' perceptions of physician-attitudes dur-
ing the outreach visits are shown in Table 2. In general, the
physicians were perceived as being agreeable to all aspects
of the outreach visit, except for the recommendation that
thiazides should be used as first-line medication.
The practices rarely reported problems when we tele-
phoned them 1–3 days after the outreach visit had taken
place.
Feed-back from physicians
An estimated 195 physicians were eligible for the survey,
out of which we managed to interview and complete the
questionnaire for 149 (76%).
Summaries of the responses are presented in Table 3. The
physicians were generally positive to receiving reminders
about treatment goals and of assessing cardiovascular risk.
A majority also stated that they usually assessed the cardi-
ovascular risk and that they believed most of their patients
achieved recommended treatment goals. However, eighty-
six respondents (58%) reported not using thiazides as the
first-choice medication. When asked why, the most com-
mon responses were fear of side-effects (19 respondents),
Table 2: Pharmacists' perception of outreach visit with physicians
1 Very
negative n (%)
2 Negative
n (%)
3 Neutral
n (%)
4 Positive
n (%)
5 Very
positive n (%)
Do not
know n (%)
Mean
score
What was their attitude toward using the
software?
0 0 3 (5) 25 (38) 38 (58) 0 4.5
What was their attitude toward printing out
patient information?
0 0 28 (42) 29 (44) 7 (11) 2 (3) 3.7
How did they respond to receiving the full
version of the guidelines?
0 0 12 (18) 43 (65) 11 (17) 0 4.0
How did they respond to receiving the short-
version of the guidelines?
0 0 9 (14) 44 (67) 13 (20) 0 4.1
To what extent were they interested in the
topic?
0 0 4 (6) 23 (35) 39 (59) 0 4.5
What was their attitude toward you? 0 0 1 (2) 47 (71) 17 (26) 1 (2) 4.2
What was their attitude to the use of
cardiovascular risk assessment?
0 1 (2) 0 17 (26) 47 (71) 1 (2) 4.7
What was their attitude toward the
recommendation of thiazides as first-choice
drug?
1 (2) 10 (15) 24 (37) 28 (43) 2 (3) 0 3.3
What was their attitude toward the treatment
goals?
0 2 (3) 8 (12) 42 (65) 10 (15) 3 (5) 4.0
How do you rate your own performance during
the presentation?
0 1 (2) 7 (11) 55 (85) 1 (2) 1 (2) 3.9
Implementation Science 2006, 1:19 />Page 4 of 9
(page number not for citation purposes)
insufficient blood-pressure lowering effect (15), and
influence from pharmaceutical industry (11). Many
respondents did not give a reason for not using thiazides
other than old habit and tradition (6), that the drugs are
considered old-fashioned (5), or simply having a prefer-
ence for other drug classes (25).
The final question in the interview was about general
aspects of participating in the research project: What was
good? How could it have been more useful? In response
to this, 58 (39%) of the physicians mentioned reminders
as a useful tool. However, 21 (14%) brought up the issue
that reminders interrupted them in their work. Eight
respondents (5%) mentioned that the risk assessment
tools were helpful when used jointly with patients.
Regression analyses
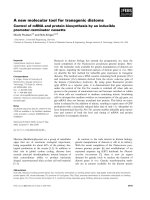
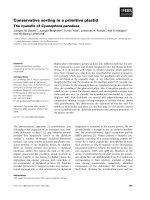
The degree of change in thiazide-prescribing varied con-
siderably across practices (figure 1), while the change in
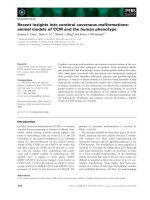
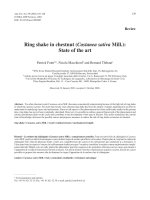
achievement of treatment goals was more uniform, and in
most cases close to zero (figure 2). There was wide varia-
tion across practices in the extent to which doctors were
using cardiovascular risk assessment tools. Proportions
ranged from zero to 100% (median 5%, mean 17%). We
did not have baseline measurements for this outcome,
thus we could not estimate whether there had been a
change in performance from before to after the interven-
tion.
The results from the initial univariate regression exercises
are listed in Table 4. The resulting multivariate regression
models with changes in thiazide-prescribing and achieve-
ment of treatment goals as dependant variables are found
in Table 5. The multivariate regression model with rates of
cardiovascular risk assessment as dependant variable is
found in Table 6. The basis population for all analyses
included the 66 practices for which we had completed
questionnaires by pharmacists.
The models could only explain a small proportion of the
observed variation in outcomes across practices (R2 less
than 25% for all models). There was not much overlap of
explanatory variables for the different dependant varia-
bles. Only one explanatory variable came out statistically
significant (p < 0.05) in the multivariate models – the
association between doctors' self-reported attitude toward
reminders about treatment goals, and achievement of
treatment goals. If the doctors were positive, this was asso-
ciated with a 7% absolute increase in achievement of
treatment goals compared to doctors who were negative.
Discussion
In general, we have found that the participating physi-
cians had a positive attitude toward most aspects of the
intervention. The attendance rate during the educational
sessions in each practice was high, few problems were
reported, and the physicians were perceived as being
Table 3: Feed-back from physicians (telephone interviews)*
Yes n (%) No n (%) Partly n (%)
Are the reminders working as they should? 104 (70) 19 (13) 26 (17)
Negative n (%) Neutral n (%) Positive n (%) Do not know n (%)
What is your attitude toward receiving reminders about cardiovascular
risk assessment?
14 (9) 33 (22) 95 (64) 4 (3)
What is your attitude toward receiving reminders about treatment
goals?
15 (10) 29 (20) 95 (64) 5 (3)
Yes n (%) No n (%) Yes and No n (%)
Do you usually estimate cardiovascular risk before starting
antihypertensive or cholesterol-lowering therapy?
92 (62) 48 (32) 7 (5)
Are thiazides your first choice for the treatment of uncomplicated
hypertension?
52 (35) 86 (58) 9 (6)
Few n (%) Some n (%) Most n (%) Do not know n (%)
Do you have the impression that your patients achieve recommended
treatment goals?
4 (2) 34 (23) 105 (71) 6 (4)
* N = 149. Not all physicians responded to all questions.
Implementation Science 2006, 1:19 />Page 5 of 9
(page number not for citation purposes)
largely supportive of the recommendations we promoted,
except for widespread scepticism about the use of thi-
azides as the first-line antihypertensive medication.
In the trial, the intervention was shown to have an impact
on the rate of thiazide-prescribing, but no effects were
demonstrated on the use of cardiovascular risk assessment
before initiating antihypertensive or cholesterol-lowering
medication, or on the degree to which patients achieved
recommended treatment goals. This was surprising con-
sidering the lack of enthusiasm regarding the use of thi-
azides and the unanimous support of cardiovascular risk
assessment and recommended treatment goals. However,
doctors' attitudes had been identified as a likely reason
why it could be difficult to increase the use of thiazides,
and our multifaceted intervention was specifically tai-
lored to target barriers to change, including attitudes [3].
There was a high level of agreement between the way the
physicians' attitudes were perceived by the pharmacists
during outreach visits, and what the physicians them-
selves reported during interviews. This indicates that our
assessments of physician-attitudes were likely valid. How-
ever, there was a weaker relationship between how doc-
tors perceived their own behaviour and what we found
using data from medical records. For instance, we found
that risk assessment had been done in 17% of cases before
patients were started on medication, while 62% of the
physicians claimed that they usually did this. This discrep-
ancy may be partly due to social desirability bias: The
interviews were conducted by a member of the research
team, often by the same pharmacist that had visited the
practice a few months earlier.
Our findings shed only limited explanatory light on the
trial-results. Multivariate regression models could only
explain a small part of the observed variation, and we did
not identify key predictive factors for the design or imple-
mentation of a successful intervention.
A weakness of our process evaluation is the lack of more
in-depth qualitative methods, e.g. in-depth interviews or
focus-groups with general practitioners that could have
increased our understanding of the trial-results [4].
Variation in change in thiazide-prescribing among all practices in trialFigure 1
Variation in change in thiazide-prescribing among all practices in trial.
0
0.1
0.2
0.3
0.4
0.5
0.6
0.7
0.8
0 0.1 0.2 0.3 0.4 0.5 0.6 0.7
Proportion of thiazide-prescribing during baseline period
Proportion of thiazide-prescribing during
intervention period
Control practices
Intervention practices
Implementation Science 2006, 1:19 />Page 6 of 9
(page number not for citation purposes)
Another weakness is that we did not have baseline data for
the outcome measure for the use of risk assessment tools,
which meant that we could not estimate change in per-
formance in relation to the intervention. Whether the
post-intervention rate is a valid effectiveness measure is
highly questionable.
The attitudes among doctors, as perceived by the pharma-
cists, were rarely negative; thus our models are not neces-
sarily applicable to practices where more negative
attitudes dominate
More use of theory-based approaches has been suggested
for the design of interventions to improve professional
practice [5]. We applied our own OFF-theory [6] in the
design of this intervention, but we did not find it to be of
much use. Thus, we maintain our scepticism to theory-
based approaches [6].
There are several possible reasons why we failed to find
good explanations for the trial results. Many of the explan-
atory variables we used were based on pharmacists'
impressions during outreach visits or self-reporting from
physicians, and these may be inaccurate. In addition, we
may simply have had too little statistical power to detect
important factors. Finally, it is possible that key explana-
tory variables have not been included in our analysis.
Some possible explanations that we have not explored
include:
• Turn-over of doctors that could be expected to negatively
influence the trial results;
• Impact of patient expectations;
• Organisational factors, e.g. lack of time during appoint-
ments to carry out risk assessment, or lack of systems to
ensure appropriate follow-up of patients; and
• Lack of specific incentives for physicians to adhere to
recommendations, e.g. compensation for extra time spent
on risk assessment.
Variation in change in achievement of treatment goals among all practices in trialFigure 2
Variation in change in achievement of treatment goals among all practices in trial.
0
0.1
0.2
0.3
0.4
0.5
0.6
0.7
0.8
0 0.2 0.4 0.6 0.8
Proportion of patients achieving treatment goals during baseline period
Proportion of patients achieving treatment goals
during intervention period
Control practices
Intervention
practices
Rt bf / t
Implementation Science 2006, 1:19 />Page 7 of 9
(page number not for citation purposes)
Why was the intervention more effective in terms of influ-
encing decisions on prescribing than for the other out-
comes? Firstly, we believe that selecting a drug is a fairly
straightforward process that is mainly influenced by
knowledge and attitudes, both of which can be addressed
through an educational intervention. Secondly, assess-
ment of cardiovascular risk may be perceived as time-con-
suming, and many doctors may have had a threshold for
starting to use a new tool. Finally, achievement of treat-
ment goals probably depends as much on patient behav-
iour as on the actions taken by doctors. The mixed
effectiveness cannot be explained by baseline perform-
ance, which was low for all outcomes.
Our trial-results are relatively consistent with the findings
from a systematic review of randomised trials, where out-
reach visits were found to be effective for changing pre-
scribing, while the impact on other aspects of professional
behaviour was more variable [7]. Similarly, the results of
a systematic review of interventions to improve control of
blood pressure indicated that educational interventions
were "unlikely to be associated with large net reductions
in blood pressure by themselves [8]. " The authors con-
cluded that it is necessary to have "an organized system of
regular follow-up and review" of hypertensive patients.
Others also have attempted to explain findings from trials
of interventions to improve professional practice using
process evaluations. Nazareth and colleagues studied the
various processes that may lead to change in prescribing
habits within the framework of the Evidence Based Out
Reach trial [9]. The experiences and views of the pharma-
cists that conducted the outreach visits were collected
using semi-structured assessment sheets and nominal
group techniques. Feedback from physicians subjected to
the educational outreach visits were gathered using
mailed questionnaires. The authors observed a smaller
effect on the uptake of the guideline in practices where the
pharmacists were unable to meet all the doctors at the out-
reach visit, which is consistent with our own observation
(table 5). The authors also noted that "Despite the posi-
tive views expressed by both the pharmacists and the GPs,
we only observed a modest effect," which is comparable
to what we have found.
Flottorp and colleagues also conducted a trial of a multi-
faceted intervention for guideline implementation in pri-
mary care, without educational outreach visits [10]. They
found little or no effect from the intervention. However
there was large variation among practices with regards to
the degree of change. In attempting to explain this varia-
tion, the researchers used several data sources, including
Table 4: Univariate regression analyses: Statistical significance (p-values) of explanatory variables
Explanatory variable Dependant variable
Change in
rate of
thiazide-
prescribing
Change in rate of
achievement of
treatment goals
Rate of
assessment of
cardiovascular
risk
Geographical area (Oslo- or Tromsø-area) 0.89 0.42 0.74
Size of practice (number of doctors) 0.36 0.046 0.95
Proportion of doctors present at meeting 0.04 0.32 0.25
Pharmacist dummy-variable 1 (pharmacist A = 1, else = 0) 0.09 0.49 0.70
Pharmacist dummy-variable 2 (pharmacist B = 1, else = 0) 0.72 0.15 0.80
Pharmacist dummy-variable 3 (pharmacist C = 1, else = 0) 0.02 0.39 0.80
Length of educational meeting (minutes) 0.15 0.62 0.54
Proportion of doctors declining installation of software 0.70 0.13 0.77
Doctors' attitude toward using software* 0.83 0.62 0.67
Doctors' attitude toward printing out patient-information* 0.12 0.33 0.77
Doctors' attitude toward receiving the guidelines* 0.77 0.72 0.72
Doctors' attitude toward recommendation of cardiovascular risk-assessment* Not applicable Not applicable 0.22
Doctors' interest in topic* 0.55 0.92 0.16
Doctors' attitude toward pharmacist* 0.70 0.96 0.47
Doctors' attitude toward recommendation of thiazides as first-line antihypertensives* 0.32 Not applicable Not applicable
Self-assessed performance* 0.81 0.76 0.84
Are reminders working as they should?† 0.59 0.87 0.22
Attitude toward receiving reminders about risk assessment† Not applicable Not applicable 0.95
Attitude toward receiving reminders about treatment goals† Not applicable 0.002 Not applicable
Baseline rate of thiazide-prescribing 0.10 Not applicable Not applicable
* Assessed by pharmacists after or during outreach visit, see Table 3 for coding of variable.
† Response from doctors during telephone-interviews, see Table 2 for coding of variable.
Implementation Science 2006, 1:19 />Page 8 of 9
(page number not for citation purposes)
telephone interviews and a postal survey of participants
[11]. The responses were used as explanatory variables in
regression analyses, but they also could explain little of
the variation in the main outcomes across practices. The
authors concluded: "There is not a single explanation for
the variation in change in practice or for the overall lack
of change. A combination of organizational problems and
lack of time and engagement is the most viable explana-
tion for the lack of effect."
The COGENT-investigators evaluated a computerised
clinical decision aid for guideline implementation, and
conducted an interview study in parallel with their ran-
domised trial [12]. The comments they received were pre-
dominantly negative, which served to explain the low
level of use of the decision-aid system. Hetlevik and col-
leagues, in an earlier Norwegian trial, also observed a low
use of their computerised clinical decision aid, and they
failed to demonstrate an effect on blood pressure control
[13]. In our study, the use of tools for cardiovascular risk
assessment was low. However, the participants were gen-
erally positive when asked about their views of the deci-
sion aids we provided to them.
Conclusion
Our multifaceted intervention targeting the professional
behaviour of general practitioners was feasible to imple-
ment and was generally well received. However, while the
intervention was effective in influencing prescribing, it
did not impact on other outcomes. The data we collected
Table 6: Multivariate regression model: Rate of cardiovascular risk assessment
Dependant variable: Rate of assessment of cardiovascular risk
Explanatory variable B (95 % CI) Standard error of B p-value
(Constant) -0.12 (-0.88 to 0.64) 0.38 0.75
Proportion of doctors present at meeting 0.25 (-0.06 to 0.56) 0.16 0.11
Doctors' attitude towards recommendation of cardiovascular risk-assessment* -0.10 (-0.22 to 0.02) 0.06 0.11
Doctors' interest in topic* 0.09 (-0.02 to 0.21) 0.06 0.10
Are reminders working as they should?
†
0.16 (-0.07 to 0.39) 0.11 0.17
R
2
= 0.13, N = 61
* Assessed by pharmacists after or during outreach visit, see Table 3 for coding of variable.
† Response from doctors during telephone-interviews, see Table 2 for coding of variable.
Table 5: Multivariate regression models: Change in thiazide-prescribing and in achievement of treatment goals
Dependant variable: Change in rate of thiazide-prescribing
Explanatory variable B (95 % CI) Standard error of B p-value
(Constant) 0.06 (-0.21 to 0.33) 0.13 0.66
Proportion of doctors present at meeting 0.12 (-0.04 to 0.27) 0.08 0.13
Pharmacist dummy-variable 1 (pharmacist A = 1, else = 0) -0.006 (-0.09 to 0.08) 0.04 0.89
Pharmacist dummy-variable 3 (pharmacist C = 1, else = 0) 0.05 (-0.03 to 0.13) 0.04 0.23
Length of educational meeting (minutes) 0.003 (-0.002 to 0.007) 0.002 0.21
Doctors' attitude toward printing out patient-information* -0.03 (-0.07 to 0.02) 0.02 0.21
Baseline rate of thiazide-prescribing -0.47 (-1.05 to 0.10) 0.29 0.11
R
2
= 0.21, N = 63
Dependant variable: Change in rate of achievement of treatment goals
Explanatory variable B (95 % CI Standard error of B p-value
(Constant) -0.003 (-0.06 to 0.05) 0.03 0.92
Size of practice (number of doctors) -0.006 (-0.02 to 0.003) 0.005 0.21
Pharmacist dummy-variable 2 (pharmacist B = 1, else = 0) -0.03 (-0.07 to 0.008) 0.02 0.11
Proportion of doctors declining installation of software 0.04 (-0.02 to 0.11) 0.03 0.20
Attitude towards receiving reminders about treatment goals
†
0.07 (0.02 to 0.12) 0.03 0.01
R
2
= 0.24, N = 60
* Assessed by pharmacists after or during outreach visit, see Table 3 for coding of variable.
† Response from doctors during telephone-interviews, see Table 2 for coding of variable.
Publish with Bio Med Central and every
scientist can read your work free of charge
"BioMed Central will be the most significant development for
disseminating the results of biomedical research in our lifetime."
Sir Paul Nurse, Cancer Research UK
Your research papers will be:
available free of charge to the entire biomedical community
peer reviewed and published immediately upon acceptance
cited in PubMed and archived on PubMed Central
yours — you keep the copyright
Submit your manuscript here:
/>BioMedcentral
Implementation Science 2006, 1:19 />Page 9 of 9
(page number not for citation purposes)
do not provide compelling explanations for this. More use
of qualitative research methods in the course of the trial
could have increased our understanding of the trial
results. Organisational factors are likely important to
address in the development of interventions to improve
the management of hypertension and hyperlipidaemia in
primary care, and may have contributed to the lack of
change that we observed for risk assessment and achieve-
ment of treatment goals. However, we do not have data to
assess the extent to which this could help to explain our
findings.
Competing interests
The author(s) were the main investigators of the RaPP-
trial.
Authors' contributions
All authors participated in the planning of this study. AF
and KH prepared the questionnaires with guidance from
ADO. All authors participated in the interpretation of
data. AF drafted the paper and conducted the statistical
analyses.
Acknowledgements
We thank all the participating physicians for their contribution, and the
pharmacists who conducted the educational outreach visits: Trine Klemet-
srud, Angelica Kruse-Jensen, Kirsten Sørhus and Tone Westergren. Torb-
jørn Wisløff and Jan Odgaard-Jensen gave us highly appreciated statistical
support. We also thank the two reviewers for their constructive com-
ments.
References
1. Fretheim A, Oxman AD, Havelsrud K, Treweek S, Kristoffersen DT,
Bjorndal A: Rational Prescribing in Primary Care (RaPP): A
Cluster Randomized Trial of a Tailored Intervention. PLoS
Med 2006, 3:e134.
2. Hulscher ME, Laurant MG, Grol RP: Process evaluation on quality
improvement interventions. Qual Saf Health Care 2003,
12:40-46.
3. Fretheim A, Oxman AD, Flottorp S: Improving prescribing of
antihypertensive and cholesterol-lowering drugs: a method
for identifying and addressing barriers to change. BMC Health
Serv Res 2004, 4:23.
4. Pope C, van Royen P, Baker R: Qualitative methods in research
on healthcare quality. Qual Saf Health Care 2002, 11:148-152.
5. The Improved Clinical Effectiveness through Behavioural Research
Group: Designing theoretically-informed implementation
interventions. Implementation Science 2006, 1:4.
6. Oxman AD, Fretheim A, Flottorp S: The OFF theory of research
utilization. J Clin Epidemiol 2005, 58:113-116.
7. Thomson O'Brien MA, Jamtvedt G, Kristoffersen DT, Oxman AD:
Educational outreach visits: Effects on professional practice
and health care outcomes (In press). Cochrane Database Syst Rev
2006.
8. Fahey T, Schroeder K, Ebrahim S: Interventions used to improve
control of blood pressure in patients with hypertension.
Cochrane Database Syst Rev 2005:CD005182.
9. Nazareth I, Freemantle N, Duggan C, Mason J, Haines A: Evaluation
of a complex intervention for changing professional behav-
iour: the Evidence Based Out Reach (EBOR) Trial. J Health
Serv Res Policy 2002, 7:230-238.
10. Flottorp S, Oxman AD, Havelsrud K, Treweek S, Herrin J: A cluster
randomised trial of tailored interventions to improve the
management of urinary tract infections and sore throat. BMJ
2002, 325:367-370.
11. Flottorp S, Havelsrud K, Oxman AD: Evaluation of a pragmatic
trial of interventions to implement guidelines in primary
care - why is it so hard to change practice? Fam Pract 2003.
12. Rousseau N, McColl E, Newton J, Grimshaw J, Eccles M: Practice
based, longitudinal, qualitative interview study of computer-
ised evidence based guidelines in primary care. BMJ 2003,
326:314.
13. Hetlevik I, Holmen J, Kruger O: Implementing clinical guidelines
in the treatment of hypertension in general practice. Evalu-
ation of patient outcome related to implementation of a
computer-based clinical decision support system. Scand J Prim
Health Care 1999, 17:35-40.