báo cáo khoa học: " Applying psychological theories to evidence-based clinical practice: Identifying factors predictive of managing upper respiratory tract infections without antibiotics" pdf
Bạn đang xem bản rút gọn của tài liệu. Xem và tải ngay bản đầy đủ của tài liệu tại đây (320.3 KB, 14 trang )
BioMed Central
Page 1 of 14
(page number not for citation purposes)
Implementation Science
Open Access
Research article
Applying psychological theories to evidence-based clinical practice:
Identifying factors predictive of managing upper respiratory tract
infections without antibiotics
Martin P Eccles*
1
, Jeremy M Grimshaw
2
, Marie Johnston
3
, Nick Steen
1
,
Nigel B Pitts
4
, Ruth Thomas
5
, Elizabeth Glidewell
5
, Graeme Maclennan
5
,
Debbie Bonetti
4
and Anne Walker
5
Address:
1
Institute of Health and Society, Newcastle University, Newcastle upon Tyne, UK,
2
Clinical Epidemiology Programme, Ottawa Health
Research Institute and Department of Medicine, University of Ottawa, Ottawa, Canada,
3
School of Psychology, University of Aberdeen, Aberdeen,
UK,
4
Dental Health Services Research Unit, University of Dundee, Dundee, UK and
5
Health Services Research Unit, University of Aberdeen,
Aberdeen, UK
Email: Martin P Eccles* - ; Jeremy M Grimshaw - ; Marie Johnston - ;
Nick Steen - ; Nigel B Pitts - ; Ruth Thomas - ;
Elizabeth Glidewell - ; Graeme Maclennan - ; Debbie Bonetti - ;
Anne Walker -
* Corresponding author
Abstract
Background: Psychological models can be used to understand and predict behaviour in a wide
range of settings. However, they have not been consistently applied to health professional
behaviours, and the contribution of differing theories is not clear. The aim of this study was to
explore the usefulness of a range of psychological theories to predict health professional behaviour
relating to management of upper respiratory tract infections (URTIs) without antibiotics.
Methods: Psychological measures were collected by postal questionnaire survey from a random
sample of general practitioners (GPs) in Scotland. The outcome measures were clinical behaviour
(using antibiotic prescription rates as a proxy indicator), behavioural simulation (scenario-based
decisions to managing URTI with or without antibiotics) and behavioural intention (general
intention to managing URTI without antibiotics). Explanatory variables were the constructs within
the following theories: Theory of Planned Behaviour (TPB), Social Cognitive Theory (SCT),
Common Sense Self-Regulation Model (CS-SRM), Operant Learning Theory (OLT),
Implementation Intention (II), Stage Model (SM), and knowledge (a non-theoretical construct). For
each outcome measure, multiple regression analysis was used to examine the predictive value of
each theoretical model individually. Following this 'theory level' analysis, a 'cross theory' analysis
was conducted to investigate the combined predictive value of all significant individual constructs
across theories.
Results: All theories were tested, but only significant results are presented. When predicting
behaviour, at the theory level, OLT explained 6% of the variance and, in a cross theory analysis,
OLT 'evidence of habitual behaviour' also explained 6%. When predicting behavioural simulation,
at the theory level, the proportion of variance explained was: TPB, 31%; SCT, 26%; II, 6%; OLT,
Published: 3 August 2007
Implementation Science 2007, 2:26 doi:10.1186/1748-5908-2-26
Received: 21 August 2006
Accepted: 3 August 2007
This article is available from: />© 2007 Eccles et al; licensee BioMed Central Ltd.
This is an Open Access article distributed under the terms of the Creative Commons Attribution License ( />),
which permits unrestricted use, distribution, and reproduction in any medium, provided the original work is properly cited.
Implementation Science 2007, 2:26 />Page 2 of 14
(page number not for citation purposes)
24%. GPs who reported having already decided to change their management to try to avoid the use
of antibiotics made significantly fewer scenario-based decisions to prescribe. In the cross theory
analysis, perceived behavioural control (TPB), evidence of habitual behaviour (OLT), CS-SRM cause
(chance/bad luck), and intention entered the equation, together explaining 36% of the variance.
When predicting intention, at the theory level, the proportion of variance explained was: TPB, 30%;
SCT, 29%; CS-SRM 27%; OLT, 43%. GPs who reported that they had already decided to change
their management to try to avoid the use of antibiotics had a significantly higher intention to manage
URTIs without prescribing antibiotics. In the cross theory analysis, OLT evidence of habitual
behaviour, TPB attitudes, risk perception, CS-SRM control by doctor, TPB perceived behavioural
control and CS-SRM control by treatment entered the equation, together explaining 49% of the
variance in intention.
Conclusion: The study provides evidence that psychological models can be useful in
understanding and predicting clinical behaviour. Taking a theory-based approach enables the
creation of a replicable methodology for identifying factors that predict clinical behaviour.
However, a number of conceptual and methodological challenges remain.
Background
Clinical and health services research are continually pro-
ducing new findings that may contribute to effective and
efficient patient care. However, despite the considerable
resources devoted to biomedical science, a consistent lit-
erature finding is that the transfer of research findings into
practice is a slow and haphazard process. A range of stud-
ies conducted in the USA, Netherlands, Britain, Canada,
and Australia have found that 30 to 40 percent of patients
do not receive treatments of proven effectiveness, and,
equally discouraging, up to 25 percent of patients receive
unnecessary care care that is potentially harmful [1-3].
Upper respiratory tract infections (URTIs) comprising
tonsillitis, pharyngitis, laryngitis, sinusitis, otitis media,
and the common cold are frequent presenting conditions
in primary care. Of these conditions, those that present
with sore throat (tonsillitis, pharyngitis, laryngitis) are
responsible for just over 50% of presentations, with otitis
media adding another 25% [4]. These conditions are fre-
quently treated with antibiotics, and rates of antibiotic
prescribing have been increasing in the UK [5]. Interview
studies [6,7] have shown that general practitioners (GPs)
have a range of reasons why they prescribe antibiotics for
sore throats. These include the feeling that patients 'want
something done' or expect to receive a prescription;
beliefs that, despite the evidence, antibiotics may help
some patients and could do little harm; a concern to pre-
serve and build relationships with patients; and workload
factors. Other studies have found that GPs often feel
uncomfortable about prescribing antibiotics [8], and that
antibiotics are ten times more likely to be prescribed if the
doctor perceives that a patient expects them [9].
However, 'the absolute benefits [of using antibiotics in the
treatment of sore throat] are modest. Protecting sore
throat sufferers against suppurative and non-suppurative
complications in modern Western society can be achieved
only by treating with antibiotics many who will derive no
benefit.' [10,11]; similar considerations apply to otitis
media [11]. Reducing antibiotic prescribing in the com-
munity by the 'prudent' use of antibiotics is seen as one
way to slow the rise in antibiotic resistance [12,13] and
appears safe, in children at least [14]. However, under-
standing of how best to achieve this is limited [15,16].
Ranji et al. reviewed 34 studies (reporting 41 trials)
addressing treatment decisions (as opposed to drug
choice decisions), most of which studied prescribing for
acute respiratory infections [16]. All the interventions
examined (clinician education, patient education, provi-
sion of delayed prescriptions, audit and feedback, clini-
cian reminders and decision support systems, and
financial and regulatory incentives) were effective at
reducing prescribing (median absolute effect -8.9% (inter-
quartile range -12.4% to -6.7%), but no individual strat-
egy (or combination of strategies) was more effective at
reducing prescribing. An apparent decline in prescribing
in the UK is thought to be due to a decline in presentation
to clinicians with no underlying decrease in prescribing to
presenting cases [17].
Implementation research is the scientific study of meth-
ods to promote the uptake of research findings, and hence
to reduce inappropriate care. It includes the study of influ-
ences on healthcare professionals' behaviour and inter-
ventions to enable them to use research findings more
effectively. Over the past 15 to 20 years, a considerable
body of implementation research has developed [18-20].
This research demonstrates that a wide range of empiri-
cally defined interventions can be effective. These span the
range of strategies aimed at individuals (e.g., audit and
feedback, reminders, outreach visiting), those aimed at
organisation of care (e.g., case management, revision of
roles, continuous quality improvement) through to finan-
cial and regulatory interventions. For example, Grimshaw
Implementation Science 2007, 2:26 />Page 3 of 14
(page number not for citation purposes)
et al. reviewed studies of interventions to promote the
uptake of clinical guidelines and showed that all interven-
tions were effective some of the time, with a median abso-
lute effect size of approximately 9% [20]. However, all
interventions had a range of effect sizes across the studies
examining them, and the basis for choosing a particular
intervention was usually not described. One consequence
of this is when such studies are reviewed the lack of any
common underlying framework means that they provide
little detailed information to guide the choice, or optimise
the components, of such complex interventions when
they are introduced into routine care settings [21]. In
order to minimise the number of costly 'real world' prag-
matic implementation trials that need to be conducted, it
is necessary to identify the 'active ingredients' in interven-
tions that aim to change professional behaviour. Interven-
tions could be effective for two reasons: they may contain
components that effectively overcome the specific barriers
encountered in relation to a particular practice; or they
may contain components that are always effective in
changing practice. Therefore, it is necessary to develop an
understanding of the factors underlying clinical behav-
iour in order to identify what sorts of factors should be tar-
geted in implementation interventions.
Theory has the potential to offer a generalisable underly-
ing framework for studying behaviour, and explanations
for clinical behaviour can be investigated using psycho-
logical theories that have been successful in predicting
behaviour and behaviour change. A study by Walker et al.
[22] used the theory of planned behaviour (TPB) [23] to
investigate factors associated with prescribing antibiotics
for patients with a sore throat amongst GPs. It showed
that the impact of individual beliefs and perceptions on
the strength of motivation to prescribe was high and
included both evidence-based and non-evidence based
factors. From this, clear predictions could be made about
the factors that were likely to increase motivation to
reduce prescribing. Using such an approach, with theoret-
ical models to measure theory-based cognitions, offers the
potential of a generalisable framework within which to
consider factors influencing behaviour and the develop-
ment of interventions to modify them. However this
study, whilst predicting intention, did not predict behav-
iour.
The current study, one part of a larger project [24,25],
aimed to investigate the use of a number of psychological
theories (selected where there was good evidence of pre-
dictive value) to explore factors associated with the actual
behaviour of GPs managing URTIs without antibiotics.
Variables were drawn from the Theory of Planned Behav-
iour (TPB) [23], Social Cognitive Theory (SCT) [26,27],
Operant Learning Theory (OLT) [28], Implementation
Intentions (II) [29], Common Sense Self-Regulation
Model (CS-SRM) [30], and an adaptation of the Stage
Models (SM) [31,32]. These specific theories, which are
described in detail elsewhere [24], were chosen because
they vary in their emphasis. Some focus on motivation,
proposing that motivation determines behaviour, and
therefore the best predictors of behaviour are factors that
predict or determine motivation (e.g., TPB). Some place
more emphasis on factors that are necessary to predict
behaviour in people who are already motivated to change
(e.g., II). Others propose that individuals are at different
stages in the progress toward behaviour change, and that
predictors of behaviour may be different for individuals at
different stages (e.g., Precaution Adoption Process). The
specific models used in this study were chosen for three
additional reasons. First, they have been rigorously evalu-
ated with patients or with healthy individuals. Second,
they allow us to examine the influence on clinical behav-
iour of perceived external factors, such as patient prefer-
ences as well as organisational barriers and facilitators.
Third, they all explain behaviour in terms of variables that
are amenable to change. The objective of this study was to
identify those theoretical constructs that predicted clinical
behaviour, behavioural simulation (as measured by the
decisions made in response to five written clinical scenar-
ios), and behavioural intention.
Methods
This was a predictive study of the theory-based cognitions
and clinical behaviours of general practitioners (GPs)
from Scotland. Theory-based cognitions were collected by
postal questionnaire survey. Behavioural data was col-
lected from routinely available prescribing data, and
planned analyses explored the predictive value of theory-
based cognitions in explaining variance in the behav-
ioural data.
Design and participants
The design was a predictive study with predictor measures
(theory-based cognitions) measured by a single postal
questionnaire survey during the 12 month period to
which the behavioural data related. Two interim outcome
measures of stated intention and behavioural simulation
were collected at the same time as the predictor measures.
Behavioural data was collected from routinely available
prescribing data.
Study participants were a random sample of GPs from
Scotland selected from a list of all Scottish general practi-
tioners by a statistician using a list of random sampling
numbers.
Predictor measures
Theoretically derived measures were developed following
the protocols of Ajzen [23], Bandura [26,27], Connor and
Sparks [33], Moss-Morris [34], and Francis et al. [35]. The
Implementation Science 2007, 2:26 />Page 4 of 14
(page number not for citation purposes)
cognition questions were developed from initial inter-
views with 14 GPs in Scotland who took part in a semi-
structured interview of up to 40 minutes, as recom-
mended for the theory of planned behaviour. The inter-
views use standard elicitation methods and covered the
views and experiences about managing patients with an
URTI. Responses were coded into belief domains (behav-
ioural, normative, control) which were then used, in con-
junction with the literature, to create the questions
measuring constructs. Five knowledge questions were
developed by the study team based on issues for which
there was good evidence. Appendix 1 provides a summary
of the predictor measures used in this study (see also
[24]); the instrument is available as Additional File 1.
Unless otherwise stated, all questions were rated on a
seven-point scale from Strongly Disagree to Strongly
Agree. We aimed to include at least three questions per
psychological construct.
Outcome measures
Behaviour
Our premise was that GPs who were more likely to man-
age URTIs without antibiotics would have lower antibiotic
prescribing rates. Therefore, as a proxy for managing
URTIs without antibiotics, the behavioural measure was
each respondent's total number of antibiotic prescrip-
tions. The raw data were adjusted in two ways. First, from
the routine prescribing data corresponding to chapter five
(Infections) of the British National Formulary (BNF)
[36], although it was not possible to identify only those
prescriptions that were given for uncomplicated URTIs, it
was possible to exclude some antibiotics that would not
be, or were very unlikely to have been, prescribed for
URTIs. Some drugs were totally excluded (e.g., any anti-
tuberculous drugs) and others were partly excluded on the
basis of dose, dosage frequency and duration, and
licensed indication (e.g., amoxicillin 3 g sachets, erythro-
mycin in 90 day courses). Second, individual prescribing
data was standardised by the number of patients the GP
saw (our proxy measure of this was the number of half day
sessions worked by each respondent).
Each prescription carries an identification code that is
unique to the prescribing GP. However, it is possible that
another clinician (e.g., a doctor in training) might use a
respondent's prescriptions, resulting in an overestimate of
the total number of prescriptions issued by that respond-
ent. In order to allow us to make some estimate of this, all
respondents were asked to estimate 'Over the last six
months, how often have acute antibiotic prescriptions
been written/printed by someone else (e.g., locum/
trainee) using your cipher number?' with response
options of Never, Sometimes, Frequently, Don't Know.
The response to this question was used to conduct a sen-
sitivity analysis.
Behavioural simulation
Key elements which might influence GPs' decisions to
manage URTIs without antibiotics were identified from
the literature, opinions of the clinical members of the
research team, and the initial interviews with 14 GPs.
From this, five clinical scenarios were constructed describ-
ing patients presenting in primary care with symptoms of
an URTI (see Additional File 1). Respondents were asked
to decide whether or not they would prescribe an antibi-
otic, and decisions in favour of prescribing an antibiotic
were summed to create a total score out of a possible max-
imum of five.
Behavioural intention
Three questions assessed GP's intention to manage URTIs
without antibiotics: When a patient presents with an
URTI, I have in mind to prescribe an antibiotic, I intend to
prescribe antibiotics for patients who present with an
URTI as part of their management, I aim not to prescribe
antibiotics for patients with URTI (rated on a seven-point
scale from 'Strongly Disagree' to 'Strongly Agree').
Responses were summed (range 3 – 21) and scaled so that
a low score equated with a low intention to prescribe anti-
biotics.
Procedure
Participants were mailed an invitation pack (letter of invi-
tation, questionnaire consisting of psychological and
demographic measures, a form requesting consent to
allow the research team to access the respondent's pre-
scribing data, a study newsletter, and a reply paid enve-
lope) by research staff between mid-April and mid-May
2004. Two postal reminders were sent to non-responders
at two and four weeks. Behavioural data were collected
over a one-year period, from approximately six months
before to six months after the assessment of cognitions.
The number of prescriptions for antibiotics issued
between the beginning of November 2003 and the end of
October 2004 were obtained from the Information and
Statistics Division of Primary Care Information Group,
Information Services, NHS National Services, Scotland.
Sample size and statistical analysis
The target sample size of 200 was based on a recommen-
dation by Green [37] to have a minimum of 162 subjects
when undertaking multiple regression analysis with 14
predictor variables.
The overall analytic approach was to first check the inter-
nal consistency of the measures. Next, for each of the three
outcome variables, we examined the relationship between
predictor and outcome variables within the structure of
each of the theories individually. Finally, for predictors
that were statistically significant irrespective of whether or
not they came from the same theory, we similarly exam-
Implementation Science 2007, 2:26 />Page 5 of 14
(page number not for citation purposes)
ined the relationship between predictive and outcome
variables. When comparing groups, independent t-tests
were used as appropriate.
The internal consistency of the constructs measured with
multiple questions was examined. Where necessary, ques-
tions were removed to achieve a Cronbach's alpha of 0.6
or greater. Where this was not possible the highest alpha
was achieved. For two question constructs a correlation
coefficient of 0.25 was used as a cut off. The relationship
between predictive and outcome variables were examined
using ANOVA for the Stage Model and correlation for
other variables. Given that Implementation Intention (II)
is theorized to act after intention and before behaviour, II
is a post-intentional construct and therefore its prediction
of intention was not explored.
For each of the three outcome measures, Pearson Correla-
tion Coefficients between the individual constructs and
the outcome measures were calculated, and then multiple
regression analyses were used to examine the predictive
value of each theoretical model. For the five 'perceived
cause of illness' questions in the CS-SRM responses were
dichotomized into scores of five to seven (indicating
agreement that the cause in question was responsible for
URTIs) versus anything else (indicating disagreement).
These dichotomous variables then were entered as inde-
pendent variables into the regression.
Finally, for predictors that were statistically significant,
irrespective of whether or not they came from the same
theory, we similarly examined the relationship between
predictive and outcome variables. All constructs which
predicted the outcome (p < 0.25 for a univariate relation-
ship) were entered into a stepwise regression analysis to
investigate the combined predictive value of significant
constructs across all theories.
Ethics approval
The study was approved by the UK South East Multi-Cen-
tre Research Ethics Committee.
Results
The postal questionnaire survey ran from mid-April to
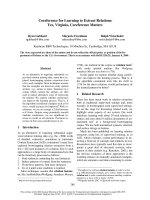
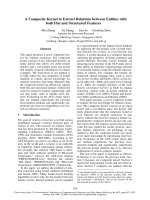
mid-May 2004. Of the 1,100 GPs approached, there were
230 (21%) who agreed to participate and for whom we
could obtain prescribing data (Figure 1). Fifty-eight per-
cent were male, they had been qualified for a mean (SD)
of 21 (7.8) years, had a median (inter-quartile range
(IQR)) list size of 6,900 (4,000 to 9,340), a median (IQR)
of four (two to five) partners, and worked a median (IQR)
of eight (six to nine) half-day sessions a week; 45 (18%)
were trainers.
More respondents provided usable data on intention
(261) than provided usable data on behavioural simula-
tion (252). Both these figures were larger than the number
of respondents who agreed to allow us to receive their
behaviour data (227). Hence, the numbers included in
analyses vary between the outcome measures.
Relationship between the three outcome measures
The three outcome measures were significantly correlated
with each other: for Behaviour and Behavioural Simula-
tion, the Pearson r statistic was 0.17 (p = 0.013); similarly
for Behaviour and Behavioural Intention it was 0.19 (p =
Response ratesFigure 1
Response rates.
Mailed: 1100
Response: 582
Completed questionnaire returned: 270 Blank questionnaire returned: 269 Ineligible: 43
No response: 518
Consented: 239
Consented & behavioural data: 230 Consent no behavioural data: 9
Withheld consent: 31
No longer at practice: 3 Other: 40*
*39 of the ineligible category were responses to an abbreviated version of the questionnaire that were not included in the analyses.
Implementation Science 2007, 2:26 />Page 6 of 14
(page number not for citation purposes)
0.004); and for Behavioural Simulation and Behavioural
Intention, it was 0.44 (p < 0.001).
Predicting behaviour
The mean (SD) number of prescriptions issued was 57
(31) per 100 patients. The results of the correlation anal-
yses are shown in Table 1. TPB attitudes, intention and
perceived behavioural control, SCT risk perception, self-
efficacy, action planning, OLT anticipated consequences,
evidence of habitual behaviour and CS-SRM cause
(chance/bad luck) significantly predicted the use of anti-
biotics to treat URTIs. For the Stage Model, the 167 GPs
who endorsed that they had 'already changed my manage-
ment of URTIs to try to avoid the use of antibiotics' issued
a mean (SD) of 54 (30) prescriptions per 100 patients ver-
sus 66 (29) for the 52 GPs who endorsed any other
response (mean difference (95%CI) = 11.8 (21.1 to 2.5),
p = 0.014).
The results of the theory level analyses are shown in Table
1. The TPB explained 3% of the variance in behaviour,
SCT explained 5%, and OLT explained 6%.
In the cross theory analysis, only evidence of habitual
behaviour (OLT) was retained in the regression model,
explaining 6% of the variance in the number of antibiotic
prescription issued (Table 3).
Sensitivity analysis
Forty-five respondents for whom we also had behavioural
data indicated that prescriptions had frequently been writ-
ten/printed by someone else. Their mean (SD) number of
prescriptions issued was 70 (31) per 100 patients com-
pared to 55 (30) for respondents who answered anything
else (p = 0.006). When the analyses were repeated exclud-
ing these respondents, there were no differences from the
overall analysis.
Predicting behavioural simulation
In response to the five clinical scenarios, the respondents
indicated that they would prescribe for a mean (SD) of 1.6
(1.2) cases. The median number of prescriptions issued
was one with a range of zero to five. From Table 2, the
constructs which predicted behavioural simulation (i.e.,
what GPs said they would do in response to the specific
clinical scenarios) were: TPB attitudes, perceived behav-
ioural control and intention; SCT risk perception, out-
come expectancies, and self-efficacy; action planning; OLT
anticipated consequences and evidence of habitual behav-
iour; CS-SRM time (acute/chronic), control (by treat-
ment), cause (chance/bad luck); and knowledge.
The results of the theory level analyses are shown in Table
2. The TPB explained 31% of the variance in behavioural
simulation, SCT explained 26%, II explained 6%, OLT
explained 24%, and knowledge explained 4.5%. For the
Stage Model, the 182 GPs who endorsed that they had
'already decided to change my management of URTIs to
try to avoid the use of antibiotics' made a mean (SD) of
1.4 (1.1) decisions to prescribe versus 2.4 (1.3) for the 64
GPs who endorsed any other response (mean difference
(95%CI) = -1.0 (1.2 to -0.7), p < 0.001).
In the cross theory analysis, perceived behavioural control
(TPB), evidence of habitual behaviour (OLT), CS-SRM
cause (chance/bad luck), and intention were retained in
the regression model, together explaining 36% of the var-
iance in the scenario score (Table 3).
Predicting behavioural intention
With the range of possible scores for intention of 3 – 21,
the mean (SD) intention score was 6.5 (2.5); the median
intention score was 6 with a range of 3 to 14. The con-
structs which predicted behavioural intention were: TPB
attitudes, perceived behavioural control; SCT risk percep-
tion, outcome expectancy, self-efficacy; OLT anticipated
consequences, evidence of habitual behaviour; CS-SRM
time (cyclical), control (by treatment and by doctor), con-
sequences, coherence; and knowledge (Table 2).
The results of the theory level analyses are shown in Table
2. The TPB explained 30% of the variance in behavioural
intention, SCT explained 29%, CS-SRM explained 27%, II
explained 9%, OLT explained 43%, and knowledge and
attitudes together explained 22%. For the Stage Model,
the 188 GPs who endorsed that they had 'already decided
to change my management of URTIs to try to avoid the use
of antibiotics' had a mean (SD) intention score of 6 (2.3)
versus 7.8 (2.6) for the 66 GPs who endorsed any other
response (mean difference (95%CI) = -1.8 (2.5 to -1.3), p
< 0.001).
In the cross theory analysis, OLT evidence of habitual
behaviour, TPB attitudes, risk perception, CS-SRM control
by doctor, TPB perceived behavioural control, and CS-
SRM control by treatment were retained in the regression
model, together explaining 49% of the variance in inten-
tion (Table 3).
Discussion
We have successfully developed and applied psychologi-
cal theory-based questionnaires that have been able to
predict prescribing behaviour and two proxies for behav-
iour – behavioural simulation and intention.
Overall interpretation
The management of URTI is a frequent behaviour, and our
measure of self-reported habitual behaviour consistently
predicted our outcome measures. Looking across our
three outcome measures, there are also suggestions that
Implementation Science 2007, 2:26 />Page 7 of 14
(page number not for citation purposes)
Table 1: Predicting behaviour by psychological theory: descriptive statistics, correlation and multiple regression analyses.
Theoretical
framework
Predictive
Constructs
N Alpha Mean (SD) r Beta R2(adj) df F
Theory of
Planned
Behaviour
(a)
Attitude direct 3 0.54 8.7 (2.8) 0.136*
Attitude indirect 7 0.56 148.7 (35.7) 0.012
Subjective Norm 3 0.68 50.2 (18.8) -0.103
Intention 3 0.68 6.5 (2.5) 0.193** 0.147*
PBC direct 4 0.70 17.0 (4.5) -0.113 -0.013***
PBC power 7 0.86 24.4 (6.6) 0.171* 0.1** 0.033 3, 215 3.5*
Social
Cognitive
Theory
Risk perception 3 0.61 8.8 (2.8) 0.179** 0.183*
Outcome
expectancies (self)
2 0.80 36.1 (15.0) -0.052 -0.103
Outcome
expectancies
(behaviour)
7 0.56 18.5 (4.5) -0.03 -0.133*
Self-efficacy 6 0.88 35.9 (11.1) 0.175** 0.155
Generalised self-
efficacy
10 0.85 28.6 (3.6) -0.005 0.045 0.049 5, 208 3.2**
Implementat
ion Intention
Action Planning - 2.9 (1.7) 0.169* 0.0169* 0.024 1, 220 6.4
Operant
Learning
Theory
Anticipated
consequences
3 0.61 8.8 (2.8) 0.179** 0.087
Evidence of habitual
behaviour
2 0.70 4.7 (2.1) 0.253*** 0.218** 0.063 2, 216 8.3***
Common
Sense Self-
regulation
Model
Identity of condition 2 0.57 7.4 (2.0) -0.013 -0.019
Time (acute/chronic) 1 3.6 (1.2) 0.036 -0.056
Time (cyclical) 1 3.7 (1.3) 0.088 0.022
Control (by
treatment)
2 0.27 5.6 (1.9) 0.097 0.181*
Control (by patient) 2 0.57 9.5 (2.2) 0.061 0.193*
Control (by doctor) 2 0.60 8.1 (2.4) -0.01 -0.016
Cause: social contact 1 5.2 (1.0) -0.121 -0.127
Cause: viral
prevalence
1 5.5 (0.9) -0.011 0.055
Cause: stress 1 3.7 (1.4) -0.128 -0.105
Cause: air travel 1 4.7 (1.2) -0.095 -0.018
Cause: chance/bad
luck
1 4.3 (1.5) -0.133* -0.162*
Consequence 2 0.34 8.0 (3.0) 0.003 -0.047
Coherence 2 0.67 11.1 (1.8) 0.049 0.005
Emotional Response 4 0.63 9.6 (3.7) 0.102 0.111 0.028 14, 191 1.4
Other Knowledge 5 0.00 2.9 (0.9) -0.057 -0.057 0.000 1, 222 0.717
*p ≤ 0.05; ** p ≤ 0.01; ***p ≤ 0.001.
(a) Only intention and perceived behavioural control measures are entered into the regression equation as only these constructs are the proximal
predictors of behaviour in this model.
Alpha = Cronbach's Alpha; r = Pearson product moment correlation coefficient; Beta = standardised regression coefficients; - = single question
measure.
Implementation Science 2007, 2:26 />Page 8 of 14
(page number not for citation purposes)
Table 2: Predicting behavioural simulation and intention by psychological theory: correlation and multiple regression analyses.
Behavioural simulation Behavioural intention
Theoretical
framework
Predictive
Constructs
r Beta R2(adj) df F r Beta R2(adj) df F
Theory of
Planned
Behaviour
Attitude direct 0.316***
Attitude indirect 0.212***
Subjective Norm 0.005
Intention 0.362***
PBC direct -0.292*** 0.267 2, 245 45.9***
Intention 0.440*** 0.270***
PBC direct -0.388*** -0.156***
PBC power 0.492*** 0.278*** 0.308 3, 244 37.6***
Attitude direct 0.469*** 0.343***
Attitude indirect 0.228*** 0.039
Subjective Norm 0.041 0.107
PBC direct -0.264*** -0.019
PBC power 0.438*** 0.288*** 0.302 5, 239 22.1***
Social
Cognitive
Theory
Risk perception 0.350*** 0.156* 0.461*** 0.314***
Outcome expectancies
(self)
0.191** 0.095 0.182** 0.125*
Outcome expectancies
(behaviour)
0.265*** 0.140* 0.217*** 0.077
Self-efficacy 0.433*** 0.355*** 0.414*** 0.268***
Generalised self-efficacy -0.109 -0.025 0.259 5, 232 17.6*** -0.087 -0.016 0.289 5, 233 20.4***
Implementat
ion intention
Action Planning 0.257*** 0.257*** 0.062 1, 249 17.6***
Operant
Learning
Theory
Anticipated
consequences
0.350*** 0.196** 0.461*** 0.245***
Evidence of habitual
behaviour
0.457*** 0.374*** 0.240 2, 240 37.9*** 0.621*** 0.514*** 0.426 2, 249 94.3***
Common
Sense Self-
regulation
Model
Identity of condition -0.063 -0.147 -0.043 -0.108
Time (acute/chronic) 0.148* 0.056 0.092 -0.014
Time (cyclical) 0.090 0.100 0.164** 0.060
Control (by treatment) 0.358*** 0.388*** 0.393*** 0.476***
Control (by patient) -0.028 0.130 0.001 0.160*
Control (by doctor) 0.102 0.110 0.188** 0.117
Cause: social contact 0.003 0.074 -0.042 0.020
Cause: viral prevalence -0.051 -0.120 -0.089 -0.081**
Cause: stress 0.011 -0.036 -0.036 -0.094
Cause: air travel 0.049 0.023 -0.024 -0.011
Cause: chance/bad luck 0.140* 0.140* -0.009 -0.008
Consequence 0.004 -0.111 0.173** 0.094
Coherence -0.113 0.017 0.282*** 0.155*
Emotional Response 0.070 0.071 0.160 16,
268
1.7 0.054 -0.017 0.272 14,22
1
7.3***
Other Knowledge -0.221*** -0.221*** 0.045 1, 250 12.8*** -0.164** -0.164** 0.023 1, 251 6.97**
*p ≤ 0.05; ** p ≤ 0.01; ***p ≤ 0.001.
r = Pearson product moment correlation coefficient; Beta = standardised regression coefficients.
Implementation Science 2007, 2:26 />Page 9 of 14
(page number not for citation purposes)
issues of perceived control, risk perception, and attitudes
may also be important.
The theories individually explained a significant propor-
tion of the variance in our dependent variables, but the
aggregated analysis suggested that they were measuring
similar phenomena within their own individual struc-
tures. Our measure of habit was consistently identified as
important, a finding that was supported by the result of
the Stage Model analysis (albeit analysed as only two
stages) which suggested that many GPs had already
decided to prescribe fewer antibiotics. Because encourag-
ing the implementation of any evidence-based practice
commonly entails various methods of increasing knowl-
edge, knowledge was included as a predictive construct in
this study. The knowledge measure included questions
about both how and why antibiotics might be used in the
management of URTIs. The number of questions
answered correctly was not related to the number of anti-
biotic prescriptions issued but was related to the behav-
ioural simulation and intention scores. However,
knowledge did not enter into any of the three stepwise
Table 3: Results of the stepwise regression analyses which included all constructs which significantly predicted outcomes.
Predictive Constructs
Outcome: Prescribing antibiotics Entered Beta Adj. R2 df F
TPB: Attitude Direct; Subjective Norm; PBC Power &
PBC Power direct; Intention
SCT: Risk Perception; Self-Efficacy
Implementation Intentions: Action Planning
Operant learning theory: anticipated consequences;
Evidence of habitual behaviour
CS-SRM: Cause social contact; stress; chance/bad luck
OLT Evidence of habitual behaviour 0.251*** 0.059 1, 209 14.1***
Outcome: Behavioural Simulation
TPB: Attitude Indirect & Direct; PBC Power & PBC
Power direct; Intention
SCT: Risk Perception; Outcome expectancy, Self-
Efficacy; Generalised self-efficacy
Implementation Intentions: Action Planning
CS-SRM: Control treatment & doctor; Cause chance/
bad luck; coherence
Knowledge
Operant learning theory: anticipated consequences;
Evidence of Habitual Behaviour
TPB PBC Power 0.302***
OLT Evidence of habitual behaviour 0.237**
CS-SRM Cause chance/bad luck 0.154**
TPB Intention 0.178* 0.356 4, 220 31.92***
Outcome: Behavioural Intention
TPB: Attitude Indirect & Direct; PBC Power & PBC
Power direct
SCT: Risk Perception; Outcome expectancy, Self-
Efficacy; Generalised self-efficacy
CS-SRM: Time cyclical; Control treatment & doctor;
Consequence; Coherence
Knowledge
Operant learning theory: anticipated consequences;
Evidence of Habitual Behaviour
OLT Evidence of habitual behaviour 0.410***
TPB attitudes direct 0.161**
SCT risk perception 0.149**
CS-SRM control doctor 0.142**
TPB PBC power 0.130*
CS-SRM control treatment -0.108* 0.494 6, 224 38.36***
*p ≤ 0.05; **p ≤ 0.01; ***p ≤ 0.001.
PBC = perceived behavioural control; TPB = Theory of Planned Behaviour; SCT = Social Cognitive Theory; CS-SRM = Common Sense Self-
Regulation Model.
Implementation Science 2007, 2:26 />Page 10 of 14
(page number not for citation purposes)
regressions, indicating that other constructs are consist-
ently more important and suggesting that behaviour
change strategies aimed at changing knowledge alone are
unlikely to be successful in this clinical area.
The stepwise regression analyses revealed that the main
construct driving GPs' management of URTI was habit
with additional influence from control, attitudes, and risk
perception. Taken together, the results suggest that GPs
have considered this frequently performed behaviour and
operate in a predominantly habitual manner backed up
by beliefs that support their habit.
This is a correlational study, so the causative aspects of the
theories remain untested in this population; but it is
promising for the utility of applying psychological theory
to changing clinical behaviour that the constructs are act-
ing as the theories expect. These results suggest that an
intervention that specifically targets these elements
should have the greatest likelihood of success in influenc-
ing the implementation of this evidence-based practice.
We used a range of theories and models in both this and
another component [25] of our larger study [24]. How-
ever, across the two studies of different behaviours
(URTIs, taking dental radiographs) and different clini-
cians (GPs, dentists), different constructs predicted differ-
ent proportions of the variance in the intention and
behaviour. This raises the question of what would be an
optimum core set of measures if the aim was to cover most
behaviours and clinical groups. Given our current limited
understanding, this would have to be the subject of both
studies replicating this one and further work examining
different combinations of theories and models.
Strengths and weaknesses
Operationalising the constructs with theoretical purity
was a challenge. The preliminary study revealed that it was
difficult to ask clinicians about their control over prescrib-
ing antibiotics because they believed that, even if they felt
there were barriers to performing the behaviour, ulti-
mately they had total control because they wrote the pre-
scription. In the final questionnaire, this meant some
questions had to be worded in terms of not doing the
behaviour. There was some concern that not prescribing
antibiotics may represent a range of alternative behav-
iours rather than being just a negative reflection of pre-
scribing antibiotics.
A number of the models (OLT, II, CS-SRM) have not pre-
viously been operationalised in this way. OLT and II have
usually being used as intervention methods to change
behaviour. However, they both have been able to predict
behavioural simulation, and OLT predicted intention and
behaviour. The CS-SRM did not predict significant vari-
ance in behaviour or behavioural simulation, but the
model did explain 27% of the variance in intention, a sim-
ilar proportion to both TPB and SCM. The model has pre-
viously been used mainly to refer to an individual's
perceptions of their clinical condition; we used it to meas-
ure a clinician's perception of the condition in general. We
had difficulty operationalising this model, and further
work is needed to explore how best the model can be
applied to clinician's behaviour in respect of their
patients.
One of the main strengths of this study is that the primary
outcome was behaviour. The inclusion of the self-
reported secondary outcomes of behavioural intention
and simulation made it possible to examine the relation-
ship between these three measures. This is important
because behaviour is usually more difficult (and expen-
sive) to measure than either of these proxy measures. By
virtue of their significant correlation, the results suggest
that self-reported measures have the potential to proxy
behavioural data when testing an intervention prior to
implementation in a service-level trial. However,
although the two proxy measures (intention and simula-
tion) were moderately correlated, the correlation between
either and behaviour was weak. It is possible that the
proxy measures are poor predictors of behaviour, though
it is important to remember that the models we have used
are focussing on modifiable behaviour. This cannot be
quantified in our predictive study design but will only
ever be a small proportion of behaviour. However, it is
also important to consider the validity of our behaviour
measure.
There is a stepwise decrease in the proportion of variance
explained as we move from explaining intention to behav-
ioural simulation to behaviour, with the models that we
used explaining up to 49%, 36% and 6% of the variance
respectively (Table 3). In a meta analysis of TPB studies in
the general population, Armitage and Conner [38]
reported TPB explaining 31% of the variance in self-
reported behaviour and 20% in observed behaviour. Our
data explaining up to 34% of the variance in behavioural
simulation is very similar to Armitage and Connor's figure
for self-reported behaviour, while our explaining up to
6% of the variance in behaviour is lower than their figure
of 20%. In a parallel study using identical methods, we
have been able to explain 16% of the variance in general
dental practitioners' use of dental radiographs [25]. This
suggests that our operationalisation of the models was
good, but that either the models do not work for this
behaviour in GPs or there are problems with our measure
of behaviour, or both. A systematic review [39] found
only 10 studies exploring the relationship between inten-
tion and behaviour in healthcare professionals, but these
reported explaining a similar proportion of the variance in
Implementation Science 2007, 2:26 />Page 11 of 14
(page number not for citation purposes)
observed behaviour to the studies in Armitage and Con-
nor's review [38]. This suggests that the problem is with
our measure of behaviour.
There could be two problems – prescribing data may not
be a good proxy for the behaviour as we asked about it in
our questionnaires, or there may be biases within pre-
scribing data. We have already identified the potential
problem with using antibiotic prescription as a proxy for
the management of patients with URTIs without prescrib-
ing antibiotics. Not only may 'prescribing' not be the
reverse of 'not prescribing', 'not prescribing' may represent
a number of alternate behaviours. Prescribing data was
chosen because it was available from routine data sources,
and was therefore inexpensive to collect. Antibiotic pre-
scribing was chosen because it was more likely that a pre-
scription for an acute illness (as opposed to a chronic
illness managed through a repeat prescribing system)
would be attributed to the GP who issued it. Scotland was
chosen because the most commonly used computer sys-
tem was likely to ascribe an antibiotic prescription to the
issuing doctor. Despite this, we know that there are errors
in the attribution of prescriptions to doctors, with 45
respondents reporting that prescriptions had frequently
been written in their name by someone else. Finally, our
standardisation by the number of patients registered with
the GP assumes that each doctor has the same presenta-
tion rate. We sought to minimise variation in this by
measuring over a 12-month period, but it is possible that
this was still a problem. In future studies of this kind it
will be important to invest more in the measurement of
the behavioural data.
Our final response rate was not high compared to what
would be expected for a postal questionnaire survey.
Cummings et al. reported that up to 1995, response rates
of surveys of healthcare professionals remained constant
at approximately 60% [40]. Our previous study using sim-
ilar questionnaires to investigate antibiotic prescribing
had a response rate of 68% [22]. Kaner et al. reported doc-
tors describing day to day work pressures and lack of per-
ceived salience as reasons for not completing
questionnaires [41]. Since these three studies, day-to-day
work pressures in UK NHS primary care have continued to
rise, and our operationalisation of multiple models
resulted in a long questionnaire asking seemingly repeti-
tive questions. Additionally, our request to access behav-
ioural data deterred 31 respondents who returned a
completed questionnaire; it may have deterred a larger
group from even completing a questionnaire.
Although we cannot make direct comparisons, our
respondents appear well-matched with the overall popu-
lation of Scottish GPs on gender, age and prescribing rates
but came from larger practices and were more likely to be
trainers. From publicly available data (see ISD Scotland
[42]) for 2003 and 2004, demographic data for all Scot-
tish GPs were: 55% male, mean age 44.7 years (assuming
qualification at age 23, this gives 21.7 years qualified),
average practice size of 5,089, and 10% were trainers.
Mean national rates of antibiotic prescribing in 2004
(having made, where possible, similar exclusions to those
made in this study) was 65 prescriptions per 100 patients.
Therefore, while we should be cautious about generalising
from our respondents to the population of Scottish GPs,
this is less of an issue at this exploratory stage of using
these methods. Our aim was not to generate data that was
representative but to receive our pre-specified number of
responses from a population who had a range of behav-
iour, reported a range of behavioural simulation and
intention, and who reported a range of cognitions. The
study achieved this aim.
Conclusion
This study provides evidence that psychological models
can be useful in understanding and predicting clinical
behaviour. Taking a theory-based approach enables the
creation of a replicable methodology for identifying fac-
tors which predict clinical behaviour. However, there
remain conceptual challenges in operationalising a
number of the models and a range of methodological
challenges in terms of instrument development and meas-
urement of behaviour that have to be surmounted before
these methods could be regarded as routine.
Competing interests
Martin Eccles is Co-Editor in Chief of Implementation Sci-
ence; Jeremy Grimshaw is a member of the editorial board
of Implementation Science. All editorial decisions on this
article were made by Co-Editor in Chief Brian Mittman.
Authors' contributions
AW, ME, JG, MJ, NP conceived the study. MJ, LS, GM, RT,
DB and ME contributed to the daily running of the study.
MJ and NS oversaw the analysis which was conducted by
GM. All authors commented on sequential drafts of the
paper and agreed the final draft.
Appendix 1
Table 4 Contains a summary of the predictor measures.
Implementation Science 2007, 2:26 />Page 12 of 14
(page number not for citation purposes)
Table 4:
Constructs (number of questions) Example Question(s)
Theory of Planned Behaviour [23]
Behavioural intention (3) I intend to prescribe antibiotics for patients who present with an URTI as
part of their management
Attitude: Direct (3); Indirect
a
(8 behavioural beliefs (bb) multiplied by 8
outcome evaluations (oe). The score was the mean of the summed
multiplicatives.)
Direct: In general: The possible harms of antibiotics to patients with an
URTI outweighs their benefits;
Indirect: In general, prescribing an antibiotic for a patient with an URTI
would reassure them (bb) × reassuring the patient is (oe: un/important)
Subjective Norm
b
: Indirect (5 normative beliefs (nb) multiplied by 5
motivation to comply (mtc) questions. The score was the mean of the
summed multiplicatives).
When managing URTIs, I feel under pressure not to prescribe an
antibiotic: from published literature (nb) × How motivated are you to do
what the published literature states that you should (mtc: very much/not
at all)
Perceived Behavioural Control: Direct (4); Indirect/power (7)
c
Direct: Whether I manage an URTI without prescribing an antibiotic is
entirely up to me
Indirect: I find it difficult to manage patients presenting with an URTI
without prescribing an antibiotic who: Expect me to prescribe an
antibiotic
Social Cognitive Theory [26]
Risk Perception (3) It is highly likely that patients with an URTI will be worse off if I do not
prescribe an antibiotic.
Outcome Expectancies Self (2 × 2), Behaviour (8 × 8). The score was the
mean of the summed multiplicatives.
Self: If I do not prescribe an antibiotic for a patient with an URTI, then I
will think of myself as a competent GP × Thinking of myself as a
competent GP is (Un/Important). Behaviour: See Attitude (Theory of
Planned Behaviour)
Self-Efficacy: General: Generalized Self-Efficacy Scale [43] (10: 4 point
scale, not at all true/exactly true); Specific (7)
General: I can always manage to solve difficult problems if I try hard
enough
Specific: How confident are you in your ability to manage patients with
URTIs symptomatically
Implementation Intention [29]
Action planning (1) Currently, my standard method of managing patients with an URTI does
not include prescribing an antibiotic
Operant Learning Theory [28]; BF Skinner Foundation [44]
Anticipated consequences (3) If I do not routinely prescribe antibiotics for URTIs then, on balance, my
life as a GP will be easier in the long run
Evidence of habit (2) When I see patients with URTIs, I automatically consider managing them
without an antibiotic
Experienced (rewarding and punishing) consequences (4: more likely to
prescribe (score = 1); less likely (score = -1); unchanged/not sure/never
occurred (score = 0)). Scores were summed.
Think about the last time you prescribed an antibiotic for a patient with
an URTI and felt pleased/sorry:
Think about the last time you decided not to prescribe an antibiotic for a
patient with an URTI and felt pleased/sorry that you had not done so':
Common Sense Self-Regulation Model
d
[30]
Perceived identity (3) URTIs as seen in general practice generally have symptoms of an intense
nature
Perceived cause (5) Getting a URTI is determined by stress
Perceived controllability (patient, doctor, treatment) (6) What the patient does can determine whether an URTI gets better or
worse
Perceived duration (acute/chronic; cyclical) (3) URTIs as seen in general practice are very unpredictable
Perceived consequences (3) An URTI does not have much effect on a patient's life
Coherence (2) I have a clear picture or understanding of URTIs
Emotional response (4) Seeing patients with an URTI does not worry me
Stage Model [31,32]
Current stage of change. A single statement is ticked to indicate the
behavioural stage
Unmotivated (2): I have not/it has been a while since I have thought about
changing my management of URTIs to try to avoid the use of antibiotics.
Motivated (2): I have decided that I will/will not change my management of
URTIs to try to avoid the use of antibiotics. Action (1): I have already
changed my management of URTIs to try to avoid the use of antibiotics.
Other Measures
Knowledge (5) (True/False/Not Sure)
Demographics
The presence of pus on the tonsils suggests a bacterial infection
post code, gender, time qualified, number of other doctors in practice,
trainer status, hours per week, list size
a
All indirect measures consist of specific belief questions identified in the preliminary study as salient to the management of upper respiratory tract
infections.
b
These individuals and groups were identified in the preliminary study as influential in the management of upper respiratory tract infections
c
An indirect measure of perceived behavioural control usually would be the sum of a set of multiplicatives (control beliefs × power of each belief to
inhibit/enhance behaviour). However, the preliminary study demonstrated that it proved problematic to ask clinicians meaningful questions which used
the word 'control' as clinicians tended to describe themselves as having complete control over the final decision to perform the behaviour. Support for
measuring perceived behavioural control using only questions as to the ease or difficulty of performing the outcome behaviour was derived from a
metanalysis which suggested that perceived ease/difficulty questions were sensitive predictors of behavioural intention and behaviour [45].
d
Illness representation measures were derived from the Revised Illness Perception Questionnaire [34]
Implementation Science 2007, 2:26 />Page 13 of 14
(page number not for citation purposes)
Additional material
Acknowledgements
The development of this study was supported by the UK Medical Research
Council Health Services Research Collaboration. It was funded by a grant
from the UK Medical Research Council (G0001325). The Health Services
Research Unit is funded by the Chief Scientist Office of the Scottish Exec-
utive. Ruth Thomas was funded by the Wellcome Trust (GR063790MA).
Jeremy Grimshaw holds a Canada Research Chair in Health Knowledge
Transfer and Uptake. The views expressed in this paper are those of the
authors and may not be shared by the funding bodies. We would like to
thank Dr Jill Francis and the participating general practitioners for their
contribution to this study.
References
1. Seddon ME, Marshall MN, Campbell SM, Roland MO: Systematic
review of studies of quality of clinical care in general practice
in the UK, Australia and New Zealand. QHC 2001, 10:152-158.
2. Schuster M, McGlynn E, Brook RH: How good is the quality of
health care in the United States? Milbank Q 1998, 76:563.
3. Grol R: Improving the quality of medical care. Building
bridges among professional pride, payer profit, and patient
satisfaction. JAMA 2001, 286:2578-2585.
4. McCormick A, Fleming D, Charlton J: Morbidity statistics from general
practice. Fourth national study 1991-1992 London, OPCS, HMSO;
1995.
5. Davey P, Bax R, Newey J, al : Growth in the use of antibiotics in
the community in England and Scotland in 1980-1993. BMJ
1996, 312:613-613.
6. Butler CC, Rollnick S, Pill R, Maggs-Rapport F, Stott N: Understand-
ing the culture of prescribing: qualitative study of general
practitioners' and patients' perceptions of antibiotics for
sore throats. BMJ 1998, 317:637-642.
7. Stevenson FA, Greenfield SM, Jones M, Nayak A, Bradley CP: GPs'
perceptions of patient influence on prescribing. Fam Pract
1999, 16:255-261.
8. Bradley CP: Uncomfortable prescribing decisions: a critical
incident study. BMJ 1992, 304:294-296.
9. Cockburn J, Pitt S: Prescribing behaviour in clinical practice:
patients' expectations and doctors' perceptions of patients'
expectations - a questionnaire study. BMJ 1997, 315:520-523.
10. Del Mar CB, Glasziou PP, Spinks AB: Antibiotics for sore throat
[Review]. In Cochrane Database of Systematic Reviews (Issue 1) Edited
by: Collaboration C. Oxford, Cochrane Library; 2001.
11. Glasziou PP, Del Mar CB, Sanders SL, Hayem M: Antibiotics for
acute otitis media in children. Volume 1 CD000219 DOI:10.1002/
14651858 CD000219.pub2. The Cochrane Database of Systematic
Reviews; 2004.
12. Standing Medical Advisory Committee.Subgroup on Antimicrobial
Resistance: The path of least resistance. London, Department of
Health; 1998.
13. Seppala H, Klaukka T, Vuopio-Varkila J: The effects of changes in
the consumption of macrolide antiobiotics on erythromycin
resistance in group A streptococci in Finland. N Engl J Med
1997, 337:446.
14. Sharland M, Kendall H, Yeates D, Randall A, Hughes G, Glasziou P,
Mant D: Antiobiotic prescribing in general practice and hos-
pital admissions for peritonsillar abscess, mastoiditis, and
rheumatic fever in children: time trend analysis. BMJ 2005,
331:328-329.
15. Little P: Delayed prescribing of antibiotics for upper respira-
tory tract infection. BMJ 2005, 331:301-302.
16. Ranji SR, Steinman MA, Shojania KG, Sundaram V, Lewis R, Arnold S,
Gonzales R: Antibiotic prescribing behavior Vol 4. In Closing the
quality gap: a critical analysis of quality improvement strategies. Technical
Review 9 Edited by: Shojania KG, McDonald KM, Wachter RM and
Owens DK. Rockville MD, Agency for Healthcare Research and Qual-
ity; 2006:255-261.
17. Fleming DM, Ross AM, Cross KW, Kendall H: The reducing inci-
dence of respiratory tract infection and its relation to antibi-
otic prescribing. Br J Gen Pract 2003:778-783.
18. Bero LA, Grilli R, Grimshaw JM, Harvey E, Oxman AD, Thomson MA:
Closing the gap betweem research and practice: an overview
of systematic reviews of interventions to promote imple-
mentation of research findings by health care professionals.
BMJ 1998, 317:465-468.
19. NHS Centre for Reviews and Dissemination: Getting evidence
into practice. Effect Health Care 1999, 5:1-16.
20. Grimshaw JM, Thomas RE, MacLennan G, Fraser C, Ramsay CR, Vale
L, Whitty P, Eccles MP, Matowe L, Shirran E, Wensing M, Dijkstra R,
Donaldson C: Effectiveness and efficiency of guideline dissem-
ination and implementation strategies. Health Technol Assess
2004, 8:1-72.
21. Foy R, Eccles M, Jamtvedt G, Grimshaw J, Baker R: What do we
know about how to do audit and feedback? Pitfalls in apply-
ing evidence from a systematic review. BMC Health Services
Research 2005, 5:50-50.
22. Walker AE, Grimshaw JM, Armstrong EM: Salient beliefs and
intentions to prescribe antibiotics for patients with a sore
throat. British Journal of Health Psychology 2001, 6:347-360.
23. Ajzen I: The theory of planned behaviour. Organizational Behav-
iour and Human Decision Processes 1991, 50:179-211.
24. Walker A, Grimshaw JM, Johnston M, Pitts N, Steen N, Eccles MP:
PRocess modelling in ImpleMEntation research:selecting a
theoretical basis for interventions to change clinical prac-
tice. BMC Health Services Research 2003, 3:22-22.
25. Bonetti D, Pitts NB, Eccles M, Grimshaw J, Steen N, Glidewell L, Tho-
mas R, Maclennan G, Clarkson JE, Walker A: Applying psycholog-
ical theory to evidence-based clinical practice: identifying
factors predictive of taking intra-oral radiographs. Soc Sci Med
2006, 63:1889-1899.
26. Bandura A: Self-efficacy: the exercise of control New York, Freeman;
1997.
27. Bandura A: Health promotion from the perspective of social
cognitive theory. In Understanding and changing Health Behaviour:
from Health Beliefs to Self-Regulation Edited by: Norman P, Abraham C
and Conner M. Amsterdam, Harwood; 2000.
28. Blackman D: Operant conditioning: an experimental analysis of behaviour
Edited by: Blackman D. London, Methuen; 1974.
29. Gollwitzer PM: Goal achievement: the role of intentions. In
European review of social psychology Edited by: Stroebe W and Hew-
stone M. Chichester, UK, Wiley; 1993:141-185.
30. Leventhal H, Nerenz D, Steele DJ: Handbook of psychology and Health
Edited by: Taylor SE and Singer JE. New Jersey, Lawrence Erlbaum;
1984.
31. Weinstein ND: The precaution adoption process. Health Psychol
1988, 7:355-386.
32. Weinstein ND, Rothman A, Sutton SR: Stages theories of health
behaviour: conceptual and methodological issues. Health Psy-
chol 1998, 17:290-299.
33. Conner M, Sparks P: The theory of planned behaviour and
health behaviours. In Predicting health behaviour Edited by: Conner
M and Norman P. Buckingham, Open University Press; 1996:121-126.
34. Moss-Morris R, Weinman J, Petrie KJ, Horne R, Cameron LD, Buick
D: The revised illness perception questionnaire (IPQ-R). Psy-
chol Health 2002, 17:1-16.
35. Francis J, Eccles MP, Johnston M, Walker AE, Grimshaw JM, Foy R,
Kaner EFS, Smith L, Bonetti D: Constructing questionnaires based on the
theory of planned behaviour. A manual for health services researchers.
Newcastle upon Tyne, Centre of Health Services Research, Univer-
sity of Newcastle upon Tyne; 2004.
36. Association BM: British National Formulary 50th edition. 2005 [http://
www.bnf.org/bnf/]. Bath, BMA: The Pharmaceutical Press.
37. Green S: "How many subjects does it take to do a regression
analysis?". Multivariate Behavioural Research 1991, 26:499-510.
Additional file 1
Questionnaire
Click here for file
[ />5908-2-26-S1.pdf]
Publish with BioMed Central and every
scientist can read your work free of charge
"BioMed Central will be the most significant development for
disseminating the results of biomedical research in our lifetime."
Sir Paul Nurse, Cancer Research UK
Your research papers will be:
available free of charge to the entire biomedical community
peer reviewed and published immediately upon acceptance
cited in PubMed and archived on PubMed Central
yours — you keep the copyright
Submit your manuscript here:
/>BioMedcentral
Implementation Science 2007, 2:26 />Page 14 of 14
(page number not for citation purposes)
38. Armitage CJ, Conner M: Efficacy of the theory of planned behav-
iour: a meta-analytic review. British Journal of Social Psychology
2001, 40:471-499.
39. Eccles MP, Hrisos S, Francis J, Kaner E, Dickinson HO, Beyer F, John-
ston M: Do self-reported intentions predict clinicians' behav-
iour: a systematic review. Implementation Science 2006, 1(28):.
40. Cummings SM, Savitz LA, Konrad TR: Reported response rates to
mailed physician questionnaires. Health Serv Res 2001,
35:1347-1355.
41. Kaner EF, Haighton CA, McAvoy BR: 'So much post, so busy with
practice-so, no time!': a telephone survey of general practi-
tioners; reasons for not participating in postal questionnaire
surveys. Br J Gen Pract 1998, 428:1067-1069.
42. Information Services Division, Scotland 2007 [
scotland.org].
43. Schwarzer R: Self-efficacy in the adoption and maintenance of
health behaviours: theoretical approaches and a new model.
In Self-efficacy: thought control of action Edited by: Schwarzer R. London,
Hemisphere; 1992:217-243.
44. B. F. Skinner Foundation: A Brief Survey of Operant Behav-
ior 2007 [ />].
45. Trafimow D, Sheeran P, Conner M, Finlay K: Evidence that per-
ceived behavioural control is a multidimensional construct:
perceived control and perceived difficulty. British Journal of
Social Psychology 2002, 41:101-121.