ANATOMY, PHYSIOLOGY, AND DISORDERS OF THE AUDITORY SYSTEM - PART 2 ppsx
Bạn đang xem bản rút gọn của tài liệu. Xem và tải ngay bản đầy đủ của tài liệu tại đây (2.58 MB, 33 trang )
19
HEARING: ANATOMY, PHYSIOLOGY, Copyright © 2006 by Academic Press, Inc.
AND DISORDERS OF THE AUDITORY SYSTEM Second Edition All rights of reproduction in any form reserved.
1. ABSTRACT
1. Sound normally reaches the cochlea via the ear
canal and the middle ear, but it may also reach the
cochlea through bone conduction. Sound that
enters the middle-ear cavities can also set the
tympanic membrane in motion and thereby reach
the cochlea.
2. The sound pressure at the tympanic membrane
depends on the acoustic properties of the pinna,
ear canal, and the head.
3. The ear canal acts as a resonator, which
causes the sound pressure at the tympanic
membrane to be higher than it is at the
entrance of the ear canal. The gain is
largest near 3 kHz (the resonance
frequency) where it is approximately 10 dB.
4. In a free sound field, the head causes the sound
pressure at the entrance of the ear canal to be
different (mostly higher) than it is when measured
at the place of the head without the person being
present.
5. The effect of the head on the sound pressure
at the entrance of the ear canal depends
on the frequency of the sound and on the angle
of incidence of the sound (direction to the
sound source).
6. The difference in time of arrival of a sound
at the two ears is the physical basis for
directional hearing in the horizontal plane,
together with the difference in intensity of the
sound at the two ears.
7. The middle ear acts as an impedance
transformer that matches the high
impedance of the cochlea to the
low impedance of air.
8. The gain of the middle ear is frequency
dependent and the increase in sound
transmission to the cochlear fluid due to
improvement in impedance matching
is approximately 30 dB in the mid-frequency
range.
9. It is the difference between the force that acts on
the two windows of the cochlea that sets the
cochlear fluid into motion. Normally the force on
the oval window is much larger than that acting
on the round window because of the gain of the
middle ear.
10. The ear’s acoustic impedance is a measure of the
tympanic membrane’s resistance against being
set into motion by a sound.
11. Measurements of the ear’s acoustic impedance
have been used in studies of the function of the
middle ear and for recordings of contraction of
the middle ear muscles.
2. INTRODUCTION
In the normal ear, sound can be conducted to the
cochlea mainly through two different routes, namely:
(1) through the middle ear (tympanic membrane and
the ossicular chain); and (2) through bone conduction.
Bone conduction of airborne sound has little impor-
tance for normal hearing but it is important in audiom-
etry where sound applied to one ear by an earphone
may reach the other ear by bone conduction (cross
transmission).
CHAPTER
2
Sound Conduction to the Cochlea
3. HEAD, OUTER EAR AND EAR
CANAL
The ear canal, the pinna and the head influence the
sound that reaches the tympanic membrane. The influ-
ence of these structures is different for different fre-
quencies and the effect of the head depends on the
direction of the head to the sound source.
3.1. Ear Canal
The ear canal acts as a resonator and the transfer
function
1
from sound pressure at the entrance of the
ear canal to sound pressure at the tympanic membrane
has a peak at approximately 3 kHz (average 2.8 kHz
[113]) at which frequency the sound pressure at the
tympanic membrane is approximately 10 dB higher
than it is at the entrance of the ear canal (Fig. 2.1). This
regards sounds coming from a source that is located
at a distance from the observer (free sound field). The
effect of the ear canal is different when sound is applied
through headphones or through insert earphones
(Fig 2.1).
3.2. Head
In a free sound field the head acts as an obstacle to
the propagation of sound waves. Together the outer
ear and the head transform a sound field so that the
sound pressure becomes different at the entrance of
the ear canal compared with the sound pressure that is
measured in the place of the head. The effect of the
head on the sound at the entrance of the ear canal is
related to the size of the head and, the wavelength
2
of sound. This means that the “amplification” is fre-
quency (or spectrum) dependent and, therefore, the
spectrum of the sound that acts on the tympanic mem-
brane becomes different from that which can be meas-
ured in the sound field in which the individual is
located. The sound that reaches the entrance of the ear
canal also depends on the head’s orientation relative
to the direction to the sound source. Depending on
its orientation relative to the sound source, the head
can function as a baffle for the ear that points towards
the sound source or it can act as a shadow for sounds
reaching the ear that is located away from the sound
source.
20 Section I The Ear
1
The transfer function (or frequency transfer function) of a
transmission system is a plot of the ratio between the output and
the input, plotted as a function of the frequency of a sinusoidal
input signal, known as a Bode plot. Such a plot is not a complete
description of the transmission properties of a system unless the
phase angle between the output signal and the input signal as
a function of the frequency is included. Nevertheless, often only
the amplitude function is shown, often expressed in logarithmic
measures (such as decibels).
2
The wavelength of sound is the propagation velocity divided
by the frequency. The propagation velocity of sound in air is
approximately 340 m/s slightly depending on the temperature and
the air pressure. Assuming a propagation velocity of 340 m/s the
wavelength of a 1,000 Hz tone is 340/1,000 = 0.34 m = 34 cm.
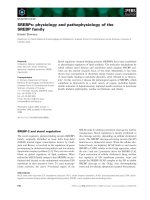
FIGURE 2.1 Effect of the ear canal on the sound pressure at the tympanic membrane: (A) average differ-
ence between the sound pressure at the tympanic membrane and that measured at the entrance of the ear
canal; (B) difference between the sound pressure at the tympanic membrane and a location in the ear canal
that is 1.25 cm from the tympanic membrane (similar to that of an insert earphone); and (C) theoretical esti-
mate of the difference between the sound pressure at the tympanic membrane and that at a point that is the
geometric center of the concha (reprinted from Shaw, 1974, with permission from Springer).
The results from studies of the effect of the head on
the sound pressure at the entrance of the ear canal
always refer to a situation where the head is in a free
sound field with no obstacles other than the individ-
ual on which the measurements are performed. Such a
situation occurs in nature with the sound source
placed at a long distance and where there is no reflec-
tion from obstacles. This is a different situation from
an ordinary room where sound reflections from the
walls modify the sound field by their reflection of
sound. A free sound field can be artificially created in
a room with walls that absorb all sound (or at least
most of it) and thus avoid reflection. Such a room is
known as an anechoic chamber. Anechoic chambers
are used for research such as that of the transformation
of sound by the head and the ear canal.
3.3. Physical Basis for Directional Hearing
The physical basis for directional hearing in the
horizontal plane is differences in the arrival time of
sounds that reach the two ears and differences in the
intensity at the entrance of the ear canal. The intensity
difference is not only a factor of the direction to a
sound source in the horizontal plane (azimuth) but it
also depends on the frequency (spectrum) of the sound
while the difference in arrival time is independent of
the frequency of the sound. The differences in the
sound that reaches the two ears are processed and dis-
criminated in the central nervous system (see p. 143).
The basis for discriminating direction in the vertical
plane (elevation) is poorly understood but may have
to do with the outer ear’s acoustic properties with
regard to high frequency sounds. Sound arrives at the
two ears with a time difference except when sounds
come from a location directly in front of or directly
behind the observer. The reason is that the sound trav-
els a different distance to reach the two ears. The dif-
ference in arrival time is related to the travel time from
a sound source and it has a simple linear relation to the
azimuth. The maximal difference in arrival time of the
two “ears” in the standard model of the head shown in
Fig. 2.2 is approximately 0.6 ms (Fig. 2.3). Values calcu-
lated from measurements taken from a hard spherical
model of the head (solid line) agree closely with actual
measurements made on a live subject.
Information about the difference in arrival time and
the difference in sound pressure at the two ears is used
by the central auditory nervous system to determine
the direction to a sound source in the horizontal plane
(azimuth). It is believed that the intra-aural time dif-
ference is most important for transient sounds and
sounds with most of their energy in the frequency
range below 1.5 kHz while it is the difference in the
intensity that is most important for high frequency
sounds (see p. 142).
A solid sphere the size of a head (Fig. 2.2) has been
used as a model of the head in studies of the transfor-
mation of sound from a free sound field to that found
at the tympanic membrane and how that transforma-
tion changes when the head is turned at different
angles relative to the direction to the sound source
[128]. Such studies have shown that the sound pres-
sure at the tympanic membrane is approximately
15 dB higher than it is in a free sound field in the fre-
quency range 2–4 kHz when a sound source is located
directly in front of an observer (Fig. 2.4). A dip occurs
Chapter 2 Sound Conduction to the Cochlea 21
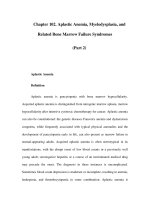
FIGURE 2.2 Schematic drawing showing how a spherical model
of the head can be used to study the effect of azimuth of an incident
plane sound wave (reprinted from Shaw, 1974, with permission
from the American Institute of Physics).
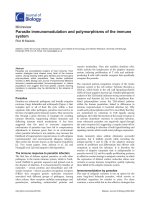
FIGURE 2.3 Calculated intra-aural time difference as a function
of azimuths for a spherical model of the head (Fig. 2.2) with a radius
of 8.75 cm (solid line), and measured values in a human subject
(open circles) (reprinted from Shaw, 1974, with permission from the
American Institute of Physics; after Feddersen et al., 1957).
22 Section I The Ear
in the transfer function of sound to the tympanic mem-
brane at approximately 10 kHz.
The difference in the intensity of sounds that reach
the two ears is a result of the head being an obstacle
that interferes with the sound field. The head acts as a
shield to the ear that is turned away from the sound
source, which decreases the sound that reaches that
ear and it acts as a baffle for the ear turned toward the
sound source and that increases the sound intensity at
that ear. This means that the effect of the head on the
transfer of sound to the entrance of the ear canal
depend on both the angle (azimuth) to the sound
source and the frequency of the sounds (Fig. 2.5).
The difference between the sound pressure in a free
field and that which is present at the entrance to the
ear canal is small at low frequencies because the effect
of the head is small for sound of wavelengths that are
long in comparison to the size of the head (Fig. 2.2). In
the frequency range between 2.5 and 4 kHz the ampli-
fication of sounds by the head and the pinna varies
from 8 to 21 dB depending on the angle to the sound
source in the horizontal plane (azimuth). The shadow
and baffle effects of the head and the outer ear con-
tribute to the difference in the sound intensity experi-
enced at the two ears for sounds that do not come from
a source located directly in front (0° azimuth) or directly
behind (180°). In a broad frequency range above 1 kHz
the intensity of sounds that come from a direction
(azimuth) of 45–90° relative to straight ahead is
approximately 5 dB higher at the entrance of the ear
canal than at the free sound field occupied by the
individual (Fig. 2.5).
The transformation of sound from a free sound field
to the sound that reaches the tympanic membrane varies
between individuals because of differences in the size
and shape of the head making the results such as those
shown in Fig. 2.5 represent the average person only.
4. MIDDLE EAR
Two problems are associated with transfer of sound
to the cochlear fluid. One is related to sounds being
ineffective in setting a fluid into motion because of the
large difference in the acoustic properties (impedance)
of the two media, air and fluid. The other problem is
related to the fact that it is the difference between the
force that acts at the two windows that causes the
cochlear fluid to vibrate. The difference in the imped-
ance of the two media would cause 99.9% of the sound
energy to be reflected at the interface between air and
fluid and only 0.1% of the energy will be converted
into vibrations of the cochlear fluid if sound was led
directly to one of the cochlear windows. Both these
problems are elegantly solved by the middle ear. The
middle ear acts as an impedance transformer that
matches the high impedance of the cochlear fluid to
the low impedance of air, thereby improving sound
transfer to the cochlear fluid. By increasing the sound
transmission selectively to the oval window of the
FIGURE 2.4 The combined effect of the head and the resonance
in the ear canal and the outer ear, obtained in a model of the human
head. The difference in sound pressure measured close to the tym-
panic membrane and a sound pressure in a free sound field with the
sound coming from a source located directly in front of the head
(based on Shaw, 1974).
FIGURE 2.5 Calculated differences between the sound pressure
(in decibels) in a free field to a point corresponding to the entrance
of the ear canal on a model of the head consisting of a hard sphere
(Fig. 2.2). The difference is shown as a function of frequency at
different azimuths (reprinted from Shaw, 1974, with permission
from the American Institute of Physics).
BOX 2.1
STUDIES OF PHYSICAL FACTORS THAT ARE IMPORTANT FOR
DIRECTIONAL HEARING
The difference between the sound pressure at the tym-
panic membranes of the two ears has also been studied
using a manikin equipped with microphones in place of
the tympanic membrane [106] (Fig. 2.6). The results of
such studies are in good agreement with those using a
spherical model of the head. This model includes the
pinna and the results show that the pinna mostly affects
transmission of high frequency sounds. While the studies
using a manikin more accurately mimic the normal situa-
tion, the results do not include the effect of the absorption
of sound on the surface of the normal head.
A change in the direction to a sound source in the ver-
tical plane (elevation) does not cause any change in
the inter-aural time difference and determination of the
elevation must therefore rely on other factors such as the
differences in the spectrum of broad band sounds that
reaches the two ears for different elevations [8]. This
occurs because the transformation of a sound from the
free field to the tympanic membrane depends on the ele-
vation to the sound source. The pinna plays an important
role in this dependence of the sound transformation on
the elevation of the sound source.
The effect of elevation (angle to the sound source in
the vertical plane) on the sound that reaches the two ears
is greatest above 4 kHz (Fig. 2.7) [128]. The sound pres-
sure at the tympanic membrane for 0° azimuth and an
elevation of 0° falls off above 4 kHz (solid line in Fig. 2.7).
With increasing elevation this upper cut off frequency
shifts toward higher frequencies (dashed lines in Fig. 2.7).
At an elevation of 60° the cut off is above 7 kHz and at
that frequency, the sound pressure is more than 10 dB
above the value it has at an elevation of 0° [128].
FIGURE 2.6 Sound intensity at the "tympanic membrane" as function of the azimuth measured in a more
detailed model of the head (manikin) than the one shown in Fig. 2.2. The difference between the sound inten-
sity at the two ears is the area between the two curves (based on Nordlund, 1962, with permission from Taylor
& Francis).
cochlea, the middle ear creates a difference in the force
that acts on the two windows of the cochlea and it thus
provides an effective transfer of sound to vibration of
the cochlear fluid.
4.1. Middle Ear as an Impedance
Transformer
Theoretical considerations show that the transm-
ission of sound to the oval window would be
improved by 36 dB if the middle ear acted as an ideal
impedance transformer with the correct transformer
ratio. However, the transformer ratio of the human
middle ear is slightly different from being optimal and
that causes some of the sound to be reflected at the
tympanic membrane and thus lost from transmission
to the cochlea.
The impedance transformer action of the middle
ear is mainly accomplished by the ratio between the
effective area of the tympanic membrane and the area
of the stapes footplate, but the lever ratio of the middle
ear bones also contributes. The ratio of areas of the
24 Section I The Ear
FIGURE 2.7 Effect of elevation on the sound pressure at the tym-
panic membrane (reprinted from Shaw, 1974, with permission from
Springer).
BOX 2.2
SOUND DELIVERED BY EARPHONES
The sound delivered to the ear by earphones is not
affected by the acoustic properties of the head. This
means that spectral filter action of the head, pinna and ear
canal is not effective when earphones are used. This is
one of the reasons that music and speech sounds differ-
ently when listening through ordinary earphones com-
pared to listening in a free sound field. This was
recognized as a problem for music delivery when ear-
phones came into frequent use. The problem was solved
by modifying the sound spectrum that drives the ear-
phones in a way that imitates the effect of the head [8].
This principle was first applied to the Sony
®
Walkman
type of tape players but later used in modern digital
devices that deliver music. The modification of the sound
spectrum made music and speech played through ear-
phones sounds similar to what it does in a (natural) free
field. Such a correction of the spectrum of the input to
earphones is the reason sound produced by earphones can
sound natural, giving an impression of “sound space.” The
effect of turning the head when listening in a free field,
however, is absent when listening through earphones.
The earphones that are commonly used for audiomet-
ric purposes are either supra-aural headphones and now,
more commonly, insert earphones. There are two concerns
regarding the use of earphones for hearing testing; one
is calibration and the other is that an earphone applied
to one ear also conducts sound to the other ear, by bone
conduction. This “cross-talk” is different for different
earphone types, being much greater for supra-aural head-
phones than for insert earphone (Fig. 2.8A). This cross
transmission is the reason that it may be necessary to
mask the better hearing ear when testing the hearing in
individuals with large differences between hearing
thresholds in the two ears. For frequencies below 1 kHz
the attenuation of the cross-transmitted sound is greater
than 80 dB for insert earphones. Insert earphones have
roughly the same frequency characteristics as supra-aural
earphones but concerns about the accuracy of the calibra-
tion remain.
Normally, hearing tests are performed in sound insu-
lated rooms but occasionally it is necessary to test the
hearing in environments with high ambient noise. In such
situations, it is important that the earphone that is used
attenuates sounds from the environment. Insert earphones
also provide much higher attenuation of external noise
than supra-aural headphones (Fig. 2.8B).
BOX 2.3
MIDDLE EAR
,
S EFFECTIVENESS IN TRANSFERING SOUND
TO THE COCHLEA
The specific impedance of air is 42 cgs units and that
of water 1.54 × 10⁵ cgs units (41.5 dynes/cm
3
and
144,000 dynes/cm
3
), thus a ratio of approximately
1:4,000. Transmission of sound to the oval window will
therefore be optimal if the middle ear has a transformer
ratio that is equal to the square root of 4,000 (equals 63).
This assumes that the input impedance to the cochlea is
equal to that of water; in fact it is less. Studies in the cat
show that the input impedance of the cochlea is lower
at low frequencies than at high frequencies. In the middle
frequency range the impedance of the cochlea is approxi-
mately the same as that of seawater. Rosowski [122]
calculated the overall effectiveness of transferring sound
from a free field to the cochlear fluid for the cat (Fig. 2.9).
Merchant et al. [85] arrived at gain values of approxi-
mately 20 dB between 250 Hz and 500 Hz with a maxi-
mum of 25 dB at 1 kHz above which the gain decreases at
a rate of 6 dB/octave. The results obtained by different
investigators differ and show a gain of the middle ear in
the range 25–30 dB.
Chapter 2 Sound Conduction to the Cochlea 25
FIGURE 2.8 (A) Average and range of intramural attenuation obtained in six subjects with two types of
earphones (TDH 39 and an insert earphone, ER-3) (reprinted from Killion et al., 1985. (B) External noise
attenuation of four different earphones often used in audiometry (reprinted from Berger and Killion, 1989, with
permission from the American Institute of Physics).
FIGURE 2.9 The efficiency of the cat's middle ear, showing
the fraction of sound power entering the middle ear that is
delivered to the cochlea (after Rosowski, 1991, with permission
from the American Institute of Physics).
BOX 2.4
THE GAIN OF THE MIDDLE EAR
One of the first animal studies that qualitatively meas-
ured the gain of the cat’s middle ear in transferring sound
to the cochlea, was published by Wever, Lawrence and
Smith (Fig. 2.10A) [153]. Early studies of the transfer func-
tion of the middle ear used pure tones of different fre-
quencies measuring the sound pressure at the tympanic
membrane that is required to produce cochlear micro-
phonic (CM
2
) potentials of a certain amplitude [153].
Usually the sound pressure that evokes a 10 µV CM
response is determined in the frequency range of interest
(for instance, from 100 to 10 kHz). Measurements are first
done while the middle ear is intact and then repeated
after the middle ear is removed surgically and the sound
led directly to the oval window (dashes in Fig. 2.10A), or
to the round window (dots in Fig. 2.10A) using a specu-
lum that was attached to the bone of the cochlea. This
arrangement ensured that sound only reached one of the
two cochlear windows at a time. When the sound is con-
ducted directly to either the round or the oval window a
much higher sound level is needed to obtain a 10 µV CM
potential than when conducted via the normal route with
the middle ear being intact. The difference between the
solid curve in Fig. 2.10A and the dotted or the dashed
curves (Fig. 2.10B) is a measure of the gain in sound con-
duction to the cochlea provided by the cat’s middle ear. It
is seen that the gain of the cat’s middle ear is frequency
dependent and it is largest in the frequency range
between 0.5 and 10 kHz where it is between 35 and 38 dB.
FIGURE 2.10 (A) Illustration of the gain of the middle ear of a cat. Sound pressure needed to produce a
CM of an amplitude of 10 mV is shown with the middle ear intact and the sound conducted to the tympanic
membrane (solid lines), and after removal of the middle ear and the sound conducted to the oval window
(dashes) and round window (dots) using a closed sound delivery system (based on Wever, E.G., Lawrence,
M., Smith, K.R. 1948. The middle ear in sound conduction. Arch of Otolaryng. 48, 12-35, with permission from
Archives of Otolaryngology Head and Neck Surgery. Copyright © (1948) American Medical Association. All
rights reserved). (B) Difference between the dotted-dashed curves and the solid curve in (A) (from Møller,
1983; based on Wever, E.G., Lawrence, M., Smith, K.R. 1948. The middle ear in sound conduction. Arch of
Otolaryng. 48, 12-35, with permission from Archives of Otolaryngology Head and Neck Surgery. Copyright ©
(1948) American Medical Association. All rights reserved).
Chapter 2 Sound Conduction to the Cochlea 27
tympanic membrane and that of the stapes is frequency
dependent because it is the effective area of the tym-
panic membrane
3
and not its geometrical (anatomical)
area that makes up the transformer ratio.
The middle ear has mass and stiffness that make its
transmission properties become frequency dependent.
Its efficiency as an impedance transformer thus becomes
a function of frequency. Stiffness impedes the motion
at low frequencies and mass impedes motion at high
frequencies. The friction in the middle ear causes loss
of energy that is independent of frequency. The lever
ratio may be frequency dependent because the mode
of vibration of the ossicular chain is different at differ-
ent frequencies. The effective area of the tympanic
membrane depends on the sound frequency and that
contributes to the frequency dependence of middle-ear
transmission. Because sound transmission through the
middle ear is frequency dependent, it is an oversimpli-
fication to express the transformer action as a single
number and the transformer ratio of the middle ear
must be described by a function of frequency, namely,
its transfer function.
Estimates of the gain of the middle ear by different
investigators vary and there are systematic differences
between results obtained in humans and in animals.
The total efficiency of the human middle ear is approx-
imately 10 dB less than ideal for frequencies up
to approximately 0.2 kHz and its highest efficiency is
attained around the frequency 1 kHz where it is
approximately 3 dB below that of an ideal impedance
transformer. This means that the middle ear transmits
approximately one-third of the sound energy to the
cochlea in this frequency range and less above and
below this range [122]. Above 1.5 kHz the efficiency (in
percentage of energy transferred to the cochlea) varies
between 20% at 4 kHz and 20% (Fig. 2.9), correspon-
ding to losses between 5 and 25 times (7 and 14 dB),
respectively.
In the experiments described above sound was led
to only one of the two windows of the cochlea at a time.
If sound is led to the middle-ear cavity, a different
situation arises because sound then will reach both the
oval window and the round window with about the
same intensity. (Hearing loss without the middle ear is
discussed in Chapter 9.)
Direct measurements of the sound transmission
through the middle ear as the function of the frequency
have also been performed both in anesthetized ani-
mals and in human cadaver ears. The transfer function
of the middle ear has been studied in anesthetized cats
by measuring the vibration amplitude of the stapes
using microscopic techniques with stroboscopic illu-
mination [44] or by using a capacitive probe to meas-
ure the vibration of the round window (Fig. 2.11) [104].
4.2. Transfer Function of the Human
Middle Ear
The middle ear in humans is different from those
of animals, which are usually used in auditory experi-
ments, and that makes it important to distinguish
between results obtained in humans and animals. How
to “translate” the results of experiments in animals
2
The CM is generated in the cochlea and its amplitude is closely
related to the volume velocity of the cochlear fluid. The CM in
response to pure tones is a sinusoidal waveform the amplitude of
which increases with the increase in the sound pressure of the
sound that elicits the CM. Recording of the CM is often used to
determine changes in sound transmission of the middle ear.
The generation of the cochlear microphonic potential (CM) is
discussed in detail in Chapter 4.
3
The effective area of a membrane like the tympanic membrane
is the area of a rigid, weightless piston that transfers sound in the
same way as the membrane.
FIGURE 2.11 Vibration amplitude of the round window (circles
and solid lines) and the incus (triangles and dashed lines) of the ear
of a cat, for constant sound pressure at the tympanic membrane. The
vibration amplitude was measured using a capacitive probe (from
Møller, 1983; based on Møller, 1963, with permission from the
American Institute of Physics).
into estimates of sound transmission in humans will
be discussed below.
Some of the earliest studies of the frequency trans-
fer function of the middle ear were done in human
cadaver ears by von Békésy in 1941 [6].
4
Measurements
of the transfer function of the human middle ear are
limited to studies in cadavers. The ratio between the
vibration amplitude of the ossicles (the umbo and the
stapes) in human cadaver ears and the sound pressure
close to the tympanic membrane (Fig. 2.12) reveals
transfer functions that are similar to those obtained in
animals [46, 71]. The vibration amplitude of the ossi-
cles is nearly constant for low frequencies up to the
resonance frequency of the middle ear (approximately
900 Hz). These results are similar to those obtained
by von Békésy [6] almost 50 years earlier. The similar-
ity between these results and those obtained using
modern techniques is remarkable in the light of the
28 Section I The Ear
FIGURE 2.12 (A) Average displacements of the umbo, the head of the stapes and the lenticular process
of the incus. (B) The lever ratio at 124 dB SPL at the tympanic membrane in 14 temporal bones. Vertical bars
indicate one standard deviation (reprinted from Gyo, et al., 1987, with permission from Taylor & Francis).
technical difficulties associated with such measure-
ment at the time that von Békésy did these studies.
The transfer functions of the middle ear shown
by Kurokawa and Goode [71] showed a considerable
individual variation, attributed mainly to individual
variations in the function of the tympanic membrane.
The irregularities in the transfer function of the middle
ear seen in Fig. 2.12 suggest that the function of the
middle ear is more complex than that of a combination
of a few elements of mass and stiffness. Several models
of the middle ear were developed during the past
three or four decades to account for such complexity
[97, 121, 164].
4.3. Impulse Response of the Human
Middle Ear
Estimation of the impulse response
5
of the cat’s
middle ear has been obtained by computing the inverse
Fourier transform of the frequency transfer functions
such as those seen in Fig. 2.11. Such calculations show
the displacement of the cochlear fluid in a cat’s ear, as
it would be in response to a brief sound impulse.
4.4. Linearity of the Middle Ear
The assumption that the middle ear functions as
linear system was supported by the experimental work
by Guinan and Peake [44] who found that the stapes
(in the cat) moves in proportion to the sound pressure
at the tympanic membrane up to 130 dB SPL for frequen-
cies below 2 kHz and even higher (140–150 dB SPL) for
frequencies above 2 kHz.
4.5. Acoustic Impedance of the Ear
The ear’s acoustic impedance is a measure of the
resistance of the tympanic membrane to be set in motion
by sound. Studies of the ear’s acoustic impedance can
provide important insight into how the middle ear
functions, including the role of the different parts of the
middle ear in transferring sound into vibration of the
cochlear fluid. Studies of the ear’s acoustic impedance
are also important for studies of middle ear pathology.
Measurements of the acoustic impedance of the ear
have not only played an important role in scientific
examination of the function of the middle ear but are
now used routinely in clinical diagnosis of disorders of
the middle ear. Tympanometry that is used clinically
to assess the function of the middle ear and to determine
Chapter 2 Sound Conduction to the Cochlea 29
4
All results reported by von Békésy reported in this book were
taken from the book Experiments in Hearing, G. von Békésy, 1960,
McGraw Hill, New York [6]. This book contains translations of orig-
inal articles by von Békésy, published in the German language. The
date (year) of the original publication will be used along with the
reference to the 1960 yearbook to give proper credit to the work of
von Békésy by emphasizing when the work was first published.
5
The impulse response of a transmission system such as the
middle ear is by definition the response to an infinitely short
impulse. In practice the impulse response is obtained by applying
a short impulse to the system that is tested. There is a mathematical
relationship between the impulse response and the frequency
transfer function, and a mathematical operation known as the
Fourier transform can convert an impulse response into a transfer
function. The inverse Fourier transform convert a transfer function
into an impulse response.
BOX 2.5
MEASUREMENT OF THE IMPULSE RESPONSE OF THE MIDDLE EAR
Direct measurements of the impulse response of the
umbo in awake human volunteers were obtained by
applying an acoustic impulse (click sound) to the ear and
using laser Doppler shift (laser Doppler vibrometer, LDV)
to measure the displacement of the umbo (Fig. 2.13) [139].
Goode et al. [43] used a similar method using commer-
cially available LDV equipment to measure the vibration
amplitude of the umbo in human volunteers. Although
such measurements do not reflect the transmission prop-
erties of the middle ear but rather reflect the ability of the
tympanic membrane to transform sound into vibration of
the manubrium of the malleus, this method might
become a useful clinical method for testing the function
of the middle ear.
FIGURE 2.13 Impulse response of the umbo obtained in a human
individual (reprinted from Svane-Knudsen and Michelsen, 1985,
with permission from Springer).
the air pressure in the middle-ear cavity is a form of meas-
urement of the ear’s acoustic impedance. Measurements
of changes in the ear’s acoustic impedance are used to
record the contractions of the middle-ear muscles in stud-
ies of the acoustic middle-ear reflex for oto-neurologic
diagnosis.
Electrical circuits and mechanical systems are anal-
ogous in many ways. Thus in an electrical circuit, elec-
trical current corresponds to vibration velocity and
electrical voltage corresponds to mechanical force. The
mechanical impedance, Z, is therefore the ratio between
force, F, and velocity, V. Mechanical friction corresponds
to an electrical resistance, mass (or inertia) corresponds
to inductance and a spring (elasticity) to capacitance.
In an acoustic system, volume velocity corresponds
to electrical current, sound pressure corresponds to
voltage and friction corresponds to electrical resistance
(Fig. 2.14C & D). The acoustic impedance of a volume
of air corresponds to a capacitor in an electrical circuit
and the acoustic impedance of a narrow passage such
as that of a narrow tube corresponds to an inductance
in an electrical circuit. The acoustic impedance is thus
the ratio between sound pressure and volume velocity.
In studies of the ear, it is the mechanical impedance
of the ear transformed to acoustic impedance by the
tympanic membrane that is of interest. A mechanical
system such as the middle ear is converted into an
acoustic system by a piston or a membrane, such as the
tympanic membrane, that converts sound into mechan-
ical force (Fig. 2.14C). If the tympanic membrane acted
as an ideal piston the mechanical impedance would be
the acoustic impedance divided by the surface area of
the piston assuming that appropriate units of measure
were used to describe the acoustic and mechanical
impedance. How the acoustic impedance of the ear
reflects the mechanical properties of the middle ear may
be understood by considering a simplified mechanical
model of the middle-ear system equipped with a piston
(Fig. 2.14C).
The admittance, Y, is the inverse of the impedance,
1/Z. It is also known as the compliance, because it is a
measure of how easily a current is induced in an elec-
trical system or how easily a mechanical system is set
into vibration by an external force. In an electrical circuit,
the admittance is the current divided by the voltage. In
a mechanical system, the impedance is the velocity
divided by the force and in an acoustic system, the
admittance is the volume velocity divided by the sound
pressure. The admittance may be a complex quantity
with a real component, G, and an imaginary component,
jB. Like impedance, admittance can also be expressed as
an absolute value and phase angle.
The ear’s acoustic impedance has been measured in
both animals and humans for studies of the function of
the middle ear and for pathological studies of the
middle ear, but measurements of the absolute value
of the ear’s acoustic impedance never became a useful
clinical diagnostic tool. Instead, measurements of changes
in the ear’s acoustic impedance came into general use
in the clinic for determining the air pressure in the
middle-ear cavity (tympanometry) and for recording
the response of the acoustic middle-ear reflex.
The acoustic impedance of the human ear has been
expressed either as its absolute value and phase angle,
or as a real and an imaginary component as a function
of the frequency. The resistive (real) component varies
very little as a function of the frequency while the
imaginary (reactive) component is high at low fre-
quencies and decreases with increasing frequency up
to approximately 1 kHz indicating that it is dominated
by stiffness below 1 kHz. Both the real and the imagi-
nary components have considerable individual varia-
tions (Fig. 2.15) [97] even when obtained in young
individuals with normal hearing and no history of
30 Section I The Ear
BOX 2.6
CRITERIA FOR LINEAR SYSTEMS
A transmission system must fulfill several criteria in
order to be regarded to function as a linear system. The
output must increase in the same proportion as the input
is increased and if two different input signals (such as
two tones with different frequencies) are applied to the
input of a system, the output must be the sum of the
output of the two signals when applied independently.
This is known as the superposition criteria of a linear
system. The output of a linear system to which two sinu-
soidal signals (for instance, tones) are applied only con-
tains energy at the same two frequencies as the input. The
transmission properties of a linear system can equally
well be determined by using different kinds of input sig-
nals in connection with mathematical operations on the
results. The properties of a non-linear system cannot be
described in a universal way.
Chapter 2 Sound Conduction to the Cochlea 31
BOX 2.7
BASIC CONCEPTS OF IMPEDANCE
Mechanical and acoustic systems are often described
by their electrical analogue circuits because many people
are more familiar with electrical circuits than with acoustic
and mechanical systems (Fig. 2.14). Per definition the
impedance, Z, of an electrical system is the resistance
against which an applied voltage induces an electrical
current in an electrical circuit. In the simplest of all systems
consisting of a single resistor, the impedance is the volt-
age, E, that is needed to set up a unit current, I, thus using
Ohm’s law and knowing the voltage and the current
makes it possible to determine the resistance, R: R = E / I.
When a circuit contains other elements such as capacitors
and inductances the impedance must be measured using
alternating test signals such as sinusoidal voltage and
currents and the impedance becomes dependent on the
frequency of the test signals. The impedance of such a cir-
cuit can no longer be described by a single number because
its impedance becomes a complex quantity that requires
two numbers to be described. A complex quantity, such as
an impedance, Z, can be described by its real and its imag-
inary component (Z = R + jX, in Fig. 2.14B, where j denote
an imaginary quantity). A complex quantity can also be
described by its absolute value (length of a vector) and the
phase angle (of the vector) (Fig. 2.14B). The impedance of
a capacitor and an inductance has pure imaginary values
of opposite signs; impedance of a capacitor decreases as a
function of the frequency and that of an inductor increases
as a function of the frequency. The impedance of a circuit
that contains a capacitor and an inductor will therefore be
zero at a certain frequency (Fig. 2.14B). That frequency is
known as the resonance frequency. If the circuit in ques-
tion also contains a resistor, the impedance will not be zero
at the resonance frequency but it will have the value of the
resistance at that frequency.
FIGURE 2.14 (A) A simple mechanical system consisting of a mass (M), elasticity (S) and friction (R). (B)
Relationship between the different elements of the impedance (Z = R + jX) and the frequency, f, of the
mechanical system in (A). (C) The mechanical system in (A) equipped with a rigid piston to form an acoustic
system. (D) Electrical analogue of the mechanical system in (A) (reprinted from Møller, 1964, with permission
from Taylor & Francis).
middle-ear diseases. Measurements of the acoustic
impedance in the same individual show a high degree
of reproducibility (Fig. 2.16) [95]. The variations in the
impedance obtained in different individuals are there-
fore a result of permanent individual differences.
This individual variation has several causes. When
the tympanic membrane in humans was covered with
a thin layer of collodion, the individual variations in
the acoustic impedance became smaller and the small
irregularities in the curves of the acoustic impedance
decreased indicating that the individual variation and
the irregularities in the impedance function results
from the properties of the tympanic membrane. The
properties of a triangular shaped portion of the tym-
panic membrane known as the pars flaccida membrana
tympani are assumed to contribute to the irregular pat-
tern of the acoustic impedance of the human ear (Figs
2.15 and 2.16). This part of the tympanic membrane is
relatively loose and its vibrations are not transferred to
the manubrium of the malleus as effectively as vibra-
tions of other parts of the membrane. Similar irregular-
ities are not present in the acoustic impedance of
animals, such as the cat, probably because the cat’s
tympanic membrane does not have a pars flaccida.
4.6. Contributions of Individual Parts of
the Middle Ear to its Impedance
Studies of the contribution of the different parts of
the middle ear to its overall impedance have been done
in animal experiments where the middle ear can be
altered experimentally [89]. The possibilities of manip-
ulating the human middle ear are naturally much
more limited than what is the case in animals but the
use of pathologies for such studies can provide useful
information about the function of the middle ear. The
immobilization of the ossicular chain as it occurs in
patients with otosclerosis has been used in development
of electrical and mathematical models of the human
middle ear [167].
The properties of the tympanic membrane have
been studied by measuring the ear’s impedance when
the manubrium is prevented from vibrating. When the
malleus is immobilized the vibrations of the tympanic
membrane are not transferred to a motion of the malleus
and the measured acoustic impedance is that of the
tympanic membrane itself. In the cat the acoustic imped-
ance of the tympanic membrane with the malleus
immobilized is very high for frequencies below 3 kHz
(Fig. 2.17) [89] indicating that it functions in a similar
way as a rigid piston for those frequencies. These
results do not provide information regarding whether
or not the equivalent area of this “piston” is different
for different frequencies.
Comparing the ear’s acoustic impedance with the
vibration velocity of the malleus for constant sound
pressure at the tympanic membrane provides informa-
tion about the ability of the tympanic membrane to
convert sound into vibration of the manubrium of
malleus (Fig. 2.18).
The two curves in Fig. 2.18, showing the acoustic
impedance and the inverse velocity of the malleus in
the cat, are parallel for low frequencies (up to approx-
imately 2 kHz) but deviate above 2 kHz, indicating
that the tympanic membrane functions in a similar
32 Section I The Ear
FIGURE 2.15 The acoustic impedance measured in the ear canal
and transformed to the estimated plane of the tympanic membrane,
in six individuals with no known ear disorders (reprinted from
Møller, 1961, with permission from the American Institute of Physics).
way as a rigid piston for frequencies only up to
approximately 2 kHz. (The inverse vibration velocity
is expressed in arbitrary units and the two curves were
made to superimpose at low frequencies.) This means
that the effective area of the tympanic membrane
changes with the frequency above 2 kHz.
The results of experiments obtained in the cat may
not be directly applicable to the human ear because the
tympanic membrane in humans has a more complex
pattern of vibration and it may be less stiff than that of
the cat. Studies of the human tympanic membrane
done in cadaver ears [64] showed that the tympanic
membrane has a smaller effective area at high frequen-
cies than it has at lower frequencies.
Experiments in cats and rabbits show that severing
the connection between the incus and the stapes (the
incudo-stapedial joint) reduces the resistive compo-
nent of the ear’s acoustic impedance below 4 kHz to
very small values (Fig. 2.19) [89], suggesting that the
real component (friction) of the ear’s acoustic imped-
ance is mainly contributed by the cochlea. Elimination
of the friction component of the middle ear makes
the resonance of the middle ear more pronounced.
Below 4 kHz the reactive (imaginary) component of
the ear’s acoustic impedance was only little altered by
disconnecting the cochlea, indicating that the cochlea
contributes little elasticity and mass to the middle ear.
The effect on the ear’s acoustic impedance from inter-
rupting the incudo–stapedial join is more complex for
frequencies above 4 kHz than below (Fig. 2.19) [89] as
has been observed by other investigators [144].
Animal experiments have shown that the reactive
component of the ear’s acoustic impedance for fre-
quencies below 3 kHz decreases after opening of the
middle-ear cavity [89]. This is because the middle-ear
cavities add stiffness to the middle ear.
The air pressure in the middle-ear cavity is nor-
mally kept close to the ambient pressure by the occa-
sional opening of the Eustachian tube that connects
the middle-ear cavity with the pharynx. When the air
pressure is not the same on both sides of the tympanic
membrane, the function of the middle ear changes
causing a decrease in sound conduction to the cochlea
and the ear’s acoustic impedance changes [89. 153].
The effect is more pronounced at low frequencies
than at high frequencies and it is largest for a negative
Chapter 2 Sound Conduction to the Cochlea 33
FIGURE 2.16 Acoustic impedance measured with 2 weeks’ interval (from Møller, 1960, with permission
from the American Institute of Physics).
34 Section I The Ear
FIGURE 2.17 The acoustic impedance at the tympanic mem-
brane measured in a cat, before (dashed lines and triangles) and
after that the ossicular chain was immobilized (solid lines and
squares) (reprinted from Møller, 1965, with permission from Taylor
& Francis).
FIGURE 2.18 Comparison of the acoustic impedance at the tym-
panic membrane with the inverse velocity of the malleus for con-
stant sound pressure at the tympanic membrane in a cat. The
impedance is given in decibels relative to 100 cgs units and the
inverse vibration velocity is given in arbitrary decibel values.
Circles = accoustic impedance at the tympanic membrane;
triangles = sound pressure at the tympanic membrane divided
by the veloicty of the malleus (reprinted from Møller, 1963, with
permission from the American Institute of Physics).
BOX 2.8
ACOUSTIC PROPERTIES OF THE TYMPANIC MEMBRANE
If the tympanic membrane functions in the same way
as a (ideal) piston, the mechanical force that acts on the
manubrium of malleus is proportional to the sound pres-
sure at the tympanic membrane. The ratio between the
vibration velocity of the malleus and the sound pressure
will then be equivalent to the velocity of the manubrium
divided by the force that acts on the membrane, thus the
inverse impedance (namely, admittance). This means that
measurement of the vibration velocity of the malleus (for
constant sound pressure) is a measure of the ability of the
tympanic membrane to convert sound into vibration of
the malleus, thus a measure of the function of the tym-
panic membrane. (The velocity of the vibration is the first
derivative of the amplitude and the velocity for sinusoidal
vibrations at constant sound pressure level can be com-
puted from the vibration amplitude by multiplying it with
the frequency, which is the same as adding 6 dB/octave to
the amplitude when the amplitude is expressed in dB.)
pressure in the middle-ear cavity (corresponding to a
positive pressure in the ear canal). Animal experi-
ments have shown that the ear’s acoustic impedance is
lowest when the air pressure in the middle-ear cavity
is the same as that in the ear canal [89]. The ear’s
acoustic impedance increases both when the pressure
is increased and when it is decreased (Fig. 2.21) but not
exactly in the same way. While both positive pressure
and negative pressure in the middle-ear cavity cause
the stiffness of the middle ear to increase, negative
pressure in the middle-ear cavity reduces the resistive
component of the ear’s acoustic impedance more than
Chapter 2 Sound Conduction to the Cochlea 35
BOX 2.9
EFFECT OF THE BONY SEPTUM IN THE CAT
,
S MIDDLE-EAR CAVITY
The cat has a bony septum separating the middle-ear
cavity in two compartments that communicate by a small
hole in the septum. The reactive component of the
acoustic impedance of the cat’s ear changes rapidly as the
frequency is changed around 4 kHz because of the res-
onator. Comparison of the acoustic impedance of the cat’s
ear before and after removal of that septum confirms that
this hole together with the cavities act as a Helmholz res-
onator, which makes the effect of the middle-ear cavities
in the cat different from that in other animals such as the
rabbit, which does not have a similar septum in the
middle ear. Removing the bony septum of the middle ear
makes the middle-ear cavity act as a simple stiffness com-
ponent similar to that in the rabbit, which has a middle
ear that has a single middle-ear cavity adding stiffness
[89]. The middle-ear cavity in humans is different from
that of these animals in that it is much larger and it con-
tains many air cells.
FIGURE 2.19 (A) Effect of interrupting the incudo-stapedial joint on the acoustic impedance of the ear of
a cat. Absolute value of the impedance (given in decibels relative to 100 cgs units). (B) Effect of interrupting
the incudo-stapedial joint on the acoustic impedance of the ear of a cat. The same data as in (A) with the real
and the imaginary parts of the impedance shown separately (reprinted from Møller, 1965, with permission
from Taylor & Francis).
BOX 2.10
EARLY STUDIES OF THE EFFECT OF THE AIR PRESSURE
IN THE MIDDLE-EAR CAVITY
Some of the earliest published studies of the effect of a
difference in the static pressure in the ear canal were
published by von Békésy [6: 95–126] who used psycho-
acoustic methods (loudness balance) (Fig. 2.20) and
showed that the effect from a pressure difference between
the two sides of the tympanic membrane on the sound
transmission through the middle ear is largest at low
frequencies.
FIGURE 2.20 The effect on sound transmission through the middle ear from static air pressure of 10 cm
H
2
O measured by loudness matching. The attenuation is given in positive dB values (reprinted from Békésy,
1933, with permission from McGraw Hill).
FIGURE 2.21 (A) Effect of static air pressure in the middle ear cavity of a cat on the ear's acoustic imped-
ance (resistive [open circles] and reactive components [filled circles] shown separately) (reprinted from
Møller, 1965, with permission from Taylor & Francis). (B) Effect on static air pressure in the middle ear cavity
of a cat. Comparison between the change in the ear's acoustic admittance and change in its transmission. The
admittance is given in dB relative to 100 cgs units and the transmission is given in arbitrary dB values
(reprinted from Møller, 1965, with permission from Taylor & Francis).
positive pressure does (Fig. 2.21A). Positive pressure
in the middle-ear cavity causes the acoustic admit-
tance to decrease by approximately the same amount
as the decrease in the transmission of sound through
the middle ear (Fig. 2.21B). Negative pressure in the
middle ear cavity causes a larger decrease in trans-
mission than the same amount of positive pressure.
That may be explained by the fact that negative pres-
sure in the middle-ear cavity reduces the resistive com-
ponent of the ear’s acoustic impedance (Fig. 2.21A).
Since the resistive component of the ear’s acoustic
impedance mainly originates in the cochlea (Fig. 2.19)
a reduction of the resistive component of the ear’s
acoustic impedance indicates that negative pressure
causes the cochlea to become decoupled from the middle
ear explaining why a negative pressure causes a larger
decrease in the transmission of sound to the cochlea
than a positive pressure.
Measurement of changes in the ear’s acoustic imped-
ance when the air pressure in the sealed ear canal is
varied is known as tympanometry. Tympanometry has
found widespread clinical usage as a diagnostic tool
because it provides a non-invasive way to determine
the pressure in the middle-ear cavity. The use of tympa-
nometry for that purpose is based on the finding that
the ear’s impedance changes as a function of the differ-
ence between the air pressure in the ear canal and the
tympanic cavity and that the impedance has its lowest
value when the pressure is the same in the ear canal
as it is in the middle-ear cavity (see Fig. 2.21B) [89].
When tympanometry is used clinically, changes as a
function of air pressure in the ear canal are usually
expressed in acoustic admittance (also known as
immittance).
Tympanometry also provides information about the
function of the middle ear in general. Usually the
acoustic impedance (or admittance) is measured at
a single frequency but the variation in the ear’s imped-
ance as a result of air pressure in the ear canal is
different for different frequencies (Fig. 2.22). Some
investigators have made use of that fact to gain more
diagnostic information from tympanometry [20].
The middle-ear muscles normally contract as an
acoustic reflex (see Chapter 8). Contraction of the tensor
tympani muscle pulls the manubrium of malleus
inward, increasing the stiffness of the middle ear and
displacing the tympanic membrane inward. The
stapedius muscle pulls the stapes in a direction that is
perpendicular to the piston-like motion of the stapes
in response to sound causing a sliding movement in
the incudo-stapedial joint.
Animal studies have shown that contraction of the
tensor tympani muscle causes the tympanic membrane
to move inward, the sound transmission through the
middle ear to decrease and the ear’s acoustic imped-
ance to increase (Fig. 2.23) [102]. Contraction of the
stapedius muscle also changes the sound transmission
through the middle ear and it changes the ear’s acoustic
impedance but it causes little or no movement of the
tympanic membrane. When both muscles were brought
Chapter 2 Sound Conduction to the Cochlea 37
FIGURE 2.22 Acoustic impedance (A) and cochlear microphonics at constant sound pressure at the tym-
panic membrane (B) as a function of air pressure in the middle-ear cavity of a cat for different frequencies:
Open triangles = 0.5 kHz; filled circles = 1 kHz; filled triangles = 2 kHz; open circles = 3 kHz (reprinted from
Møller, 1965, with permission from Taylor & Francis).
to contraction simultaneously, the movement of the
tympanic membrane was smaller than it is when the
tensor tympani was brought to contract alone (Fig. 2.23)
but the change in transmission and the ear’s acoustic
impedance was larger than when these muscles were
brought to contract one at a time. Thus, contraction of
the stapedius muscle impedes the motion of the tym-
panic membrane induced by contraction of the tensor
tympani muscle.
The tensor tympani muscle contracts during swal-
lowing when the Eustachian tube is opening and it has
been suggested that contractions of the tensor tympani
38 Section I The Ear
FIGURE 2.23 Upper graphs: The movement of the tympanic membrane caused by contraction of the
tensor tympani muscle (A), the stapedius muscle (B), and both muscles together (C) recorded by measuring
the change in the air pressure in the sealed ear canal. The tensor tympani muscle and the stapedius muscle
were brought to contractions independently by electrical stimulation of these muscles independently
(or rather the nerve that innervates the muscle). Middle graphs: Change in the acoustic impedance or the ear
measured at 0.8 kHz. Lower graphs: Change in the CM recorded from the round window, for 800 Hz stimu-
lation (reprinted from Møller, 1965, with permission from Taylor & Francis).
BOX 2.11
EARLY STUDIES OF THE EFFECT OF CONTRACTION
OF THE MIDDLE-EAR MUSCLES
It was probably Hallpike (1935) that first showed experi-
mental evidence that contraction of the middle-ear muscles
caused a change in the sound transmission through the
middle ear. Several investigators [42, 152, 154] have used
recordings of the cochlear microphonic potential from the
round window of the cat and observed the change in this
potential when the middle-ear muscles were brought to con-
tract in response to a loud sound presented to the opposite
ear to elicit the acoustic middle-ear reflex (see Chapter 8).
The displacement of the tympanic membrane by con-
traction of the tensor tympani muscle can be recorded by
measuring the change in the air pressure in the sealed
ear canal. Kato (1913) was probably the first to report
on studies of contractions of the middle ear muscles
by recording the displacement of the tympanic membrane
by measuring changes in the air pressure in the sealed
external ear canal in animal experiments. At about the
same time Mangold (1913) used a similar method in
humans and elicited a contraction of the middle-ear mus-
cles by presenting a loud sound to the opposite ear.
Similar methods were later used by other investigators
[84, 142].
improve air exchange in the tympanic cavity by dis-
placing a small quantity of air in the middle-ear cavity
whenever it contracts. If the air is not replaced, the
content of oxygen in the air will decrease because
oxygen is absorbed at the mucosal surface in the
middle-ear cavity.
Contraction of the stapedius muscle decreases the
sound conduction through the middle ear. The con-
traction causes a gradual decrease of transmission as a
function of the stapes displacement (Fig. 2.24) [107].
The attenuation is largest in the low frequency range
but during strong contractions sound transmission is
also reduced in the high frequency range. The attenu-
ation caused by contraction of the stapedius muscle is
approximately 8 dB in the cat for frequencies below
1 kHz (Fig. 2.25) [89]. Comparisons of the change in
the acoustic impedance and the change in the trans-
mission properties of the middle ear (Fig. 2.25) sup-
port the hypothesis that contraction of the stapedius
muscle causes some kind of “decoupling” between the
middle ear and the cochlear fluid.
Chapter 2 Sound Conduction to the Cochlea 39
FIGURE 2.24 Change in transmission in one middle ear as a
function of frequency for six different sound intensities (expressed
in stapes displacement in millimeters) (reprinted from Pang and
Peake, 1986, with permission from Springer).
FIGURE 2.25 Change in sound transmission through the middle
ear in a cat as a result of contraction of the stapedius muscle (solid
lines and circles), together with the concomitant change in the ears
acoustic admittance (dashed lines and triangles) (reprinted from
Møller, 1965, with permission from Taylor & Francis).
This page intentionally left blank
41
HEARING: ANATOMY, PHYSIOLOGY, Copyright © 2006 by Academic Press, Inc.
AND DISORDERS OF THE AUDITORY SYSTEM Second Edition All rights of reproduction in any form reserved.
1. ABSTRACT
1. The cochlea separates sounds according to their
frequency (spectrum) so that different spectral
components of sounds activate different
populations of auditory nerve fibers.
2. Sensory transduction occurs in inner hair
cells.
3. Outer hair cells are active elements that act as
“motors” that reduce the influence of friction on
the motion of the basilar membrane. This action
of the outer hair cells increases the vibration
amplitude of the basilar membrane for low sound
intensities (by approximately 50 dB) and increases
its frequency selectivity.
4. The location of the maximal response shifts toward
the base of the cochlea.
5. The role of outer hair cells in increasing the
frequency selectivity of the basilar membrane is
greatest at low sound intensities.
6. The non-linear action of the cochlea provides
amplitude compression of sounds before initiation
of nerve impulses in the auditory nerve. Without
that, it was not possible to code sounds in the
auditory nerve in the large range of intensities
that are covered by hearing.
7. The cochlea can generate different kinds of
sounds. These sounds are conducted “backwards”
by the middle ear, setting the tympanic membrane
in motion and thereby generating sounds that can
be recorded by a sensitive microphone placed in
the ear canal. This is known as otoacoustic
emission (OAE).
8. There are several kinds of OAE:
i. Transient evoked otoacoustic emission (TEOAE)
is elicited by a transient sound and generated
by reflection of the traveling wave on the
basilar membrane.
ii. Spontaneous otoacoustic emission (SOAE) is a
sustained sound that is generated without any
sound being applied to the ear.
iii. Distortion product otoacoustic emission
(DPOAE) is a measure of non-linear distortion
in the cochlea. DPOAE is elicited by applying
two tones to the ear, and measuring the
amplitude of a difference tone (usually
the 2f
2
-f
1
tone).
9. The olivocochlear efferents influence the function
of outer hair cells and by that the OAE is affected.
2. INTRODUCTION
Sensory cells in the cochlea transform sound into a
code of nerve impulses in the auditory nerve and that
conveys the information to the brain about sounds
that reach the ear within the audible range. In addition
the cochlea separates sounds according to their spec-
trum (frequency) so that different populations of hair
cells become activated by sounds of different frequency
(spectrum). Besides that, the cochlea compresses the
amplitude of sounds and thereby makes it possible
to accommodate the large dynamic range of natural
sounds.
Interplay between theoretical and experimental
work has been extremely successful in unraveling the
CHAPTER
3
Physiology of the Cochlea
intricate functions of the cochlea both with regard to
the frequency analysis in the cochlea and with regard
to sensory transduction. The more knowledge that
is accumulated about the function of the cochlea the
more it becomes evident that the cochlea is a far more
complex organ than envisioned by early investigators.
Many features not included in the earlier hypothe-
ses have been added as a result of the extensive
experimental work.
An example of how new information has totally
revised the conception of the function of the cochlea
was the discovery that the two groups of sensory
cells, inner and outer hair cells, have fundamentally
different functions. While the inner hair cells convert
the vibration of the basilar membrane into a neural
code in the individual fibers of the auditory nerve, the
outer hair cells act as “motors” that compensate for
the loss of energy in the cochlea and thereby improve the
ear’s sensitivity and sharpens its frequency selectivity
for weak sounds.
It has been questioned whether the frequency
selectivity of the cochlea is indeed the basis for our
ability to detect changes in the frequency of a pure
tone, as small as only a few hertz. The results of recent
studies have also cast doubt about the role of spectral
analysis in the ear as the basis for discrimination of
complex sounds such as speech sounds and instead
emphasizing the role of the temporal coding of sounds
such as vowels and it is now believed that the main
role of frequency selectivity of the basilar membrane is
to divide sounds into different spectral bands before
the information is processed by the auditory nervous
system. The mammalian ear can process sounds the
spectrum of which covers 10 octaves and that would
not be possible without separation of the spectrum
into suitable sized pieces so that the temporal infor-
mation in different frequency bands can be coded
independently in the discharge pattern of auditory
nerve fibers (discussed in Chapters 5 and 6).
3. FREQUENCY SELECTIVITY OF
THE BASILAR MEMBRANE
Sound analysis in the cochlea is normally equated
with spectral analysis that is ascribed to the interplay
between the dynamic properties of the basilar mem-
brane and that of the surrounding fluid. Helmholtz
(1863) was the first to formulate and prove that the
ear performs spectral analysis of sounds. Before that,
Ohm (1843) suggested that the ear could separate a
sound into its frequency components. These earlier
hypotheses were inspired by the finding that any
complex waveform (such as natural sounds) can be
divided into a sum of a series of sinusoidal wave-
forms. Fourier analysis is the mathematical technique
of separating a complex waveform such as natural
sounds into a series of sine waves. Helmholtz sug-
gested that the basilar membrane performed such
spectral analysis and he believed that it was accom-
plished because the basilar membrane functioned as
a series of resonators that were tuned to different
frequencies covering the audible range, a function
similar to that of the strings of a piano.
Although it was already hypothesized 150 years
ago that the cochlea is involved in frequency analysis
of sounds it was the fundamental research by von
Békésy
1
that brought experimental proof that the
cochlea actually does perform spectral analysis of
sounds. He presented experimental evidence that a
tone of a certain frequency caused the highest vibra-
tion amplitude at a certain point along the basilar
membrane. This means that each point along the
basilar membrane is tuned to a certain frequency and
a frequency scale can be laid out along the cochlea
with high frequencies located at the base and low
frequencies at the apex of the cochlea (Fig 3.1).
Von Békésy [6] convincingly demonstrated that
sounds set up a traveling wave motion along the basi-
lar membrane and this traveling wave motion is the
basis for the frequency selectivity and not resonance of
the basilar membrane as proposed by Helmholz
(1883). He concluded that the motion of the basilar
membrane becomes a traveling wave motion because
the stiffness of the basilar membrane decreases from
the base of the cochlea to its apex. Other investigators
had earlier suggested other kinds of wave motion
along the basilar membrane. Ewald’s hypothesis that
sounds give rise to standing waves on the basilar
membrane is dated back to 1898.
During the time when our understanding of the
function of the cochlea steadily increased, theoretical
work by investigators such as Ranke (1950) and
Zwislocki (1948) were important in guiding work of
experimentalists by asking relevant questions.
Experimental studies of the vibration of the basilar
membrane that could confirm the various hypotheses
about the function of the basilar membrane as a spec-
trum analyzer have been hampered by the extremely
small amplitude of the vibration of the basilar mem-
brane. Until the early 1970s the only data about the
vibration of the basilar membrane and its frequency
selectivity that were available were obtained in studies
42 Section I The Ear
1
Georg von Békésy did his fundamental work on the function
of the ear between 1928 and 1956. His early work was published in
the German language and all his work is has been translated into
English and published in journal articles. His work is also collected
in a book [6].
done in human cadaver ears by a single investigator [6].
The results obtained showed that the basilar mem-
brane was broadly tuned. This work was mostly done
in the 1930s when limitations in technology made
it necessary to use extremely high sound levels to
observe the motion of the basilar membrane.
Other investigators took these results, obtained
at these extreme high sound intensities, to represent
auditory frequency selectivity in the entire intensity
range of hearing because it was assumed that the
basilar membrane functioned as a linear system that
allowed such extrapolations of these experimental
findings. (Readers who are interested in details about
the development of hypotheses and experimental
studies of the cochlea as a spectrum analyzer are
referred to extensive literature on the matter [22, 23,
54, 55, 151, 152].) It was not until the beginning of
the 1970s that it became evident that the motion of
the basilar membrane is non-linear and that it was
more frequency selective for low intensity sounds
than for high intensity sounds [120]. The cause for
the non-linearity was not discovered until 1983 [12].
3.1. Traveling Wave Motion
Sounds set the cochlear fluid into motion and the
motion of the cochlear fluid in turn sets the basilar
membrane into motion. The mechanical properties of
the basilar membrane and how they vary along the
membrane determine which kind of wave motion a
sound gives rise to. The traveling wave motion on the
basilar membrane is a result of the gradual decrease in
the stiffness of the basilar membrane from the basal
portion of the basilar membrane toward the cochlear
apex. The energy that is transferred to the basal por-
tion of the basilar membrane propagates as a traveling
wave motion toward the cochlear apex. As the wave
travels along the basilar membrane toward less
stiff parts of the basilar membrane, the propagation
velocity of the wave decreases (Fig. 3.2) and conse-
quently the wavelength of the motion decreases. (The
wavelength is the distance between two identical
points of the wave that travels along the basilar
membrane.) When the wave motion slows, energy
piles up, first causing the vibration amplitude to
increase [77]. The increase in amplitude is counter-
acted by frictional losses of energy and when the
wavelength of the traveling wave reaches small
values, these losses increase rapidly and the wave
propagation comes to a halt and the traveling wave
Chapter 3 Physiology of the Cochlea 43
FIGURE 3.1 Schematic drawing of the basilar membrane of the
human cochlea showing that the width of the basilar membrane
increases from the base of the cochlea to its apex. High frequencies
are represented in the basal end of the cochlea and lower frequencies
toward the apex (from Stuhlman, 1943, with permission from John
Wiley & Son).
FIGURE 3.2 Schematic illustration of the traveling wave motion
along the basilar membrane. The cochlea is shown schematically as
a straight tube (reprinted from Zweig et al., 1976, with permission
from the American Institute of Physics).