ANATOMY, PHYSIOLOGY, AND DISORDERS OF THE AUDITORY SYSTEM - PART 6 pot
Bạn đang xem bản rút gọn của tài liệu. Xem và tải ngay bản đầy đủ của tài liệu tại đây (2.36 MB, 33 trang )
151
HEARING: ANATOMY, PHYSIOLOGY, Copyright © 2006 by Academic Press, Inc.
AND DISORDERS OF THE AUDITORY SYSTEM Second Edition All rights of reproduction in any form reserved.
1. ABSTRACT
1. All neural structures of the ascending auditory
pathways can generate sound evoked electrical
potentials that can be recorded by an electrode
placed on the respective structure.
2. Compound action potentials (CAP) recorded
directly from the intracranial portion of the auditory
nerve in small animals are different from those
recorded in humans because the eighth cranial nerve
is longer in humans than in small animals (2.5 cm in
humans and approximately 0.8 cm in the cat).
3. In humans, the latency of the main negative peak
of the CAP recorded with a monopolar electrode
from the intracranial portion of the human auditory
nerve is approximately one millisecond longer
than that of the N
1
component of the action
potential (AP) recorded from the ear.
4. Evoked potentials recorded with a bipolar electrode
from a long nerve such as the human auditory
nerve represent propagated neural activity.
5. The responses recorded from the auditory nerve to
continuous, low frequency sounds is the frequency
following response (FFR).
6. The response recorded from the surface of a
nucleus (such as the cochlear nucleus and the
inferior colliculus) in response to transient sounds
has an initial positive–negative deflection, which is
generated by the termination of the nerve that
serves as the input to the nucleus. The slow
deflection that follows is generated by dendrites
and the fast components riding on the slow wave
are somaspikes generated by firings of nerve cells.
7. Far-field evoked potentials are the potentials
that can be recorded from locations that lie far
from the anatomical location of their generators,
such as the surface of the scalp.
8. Neural activity in many of the structures of the
classical ascending auditory pathways, but not all,
give rise to far-field evoked potentials that can be
recorded from electrodes placed on the scalp.
9. Auditory brainstem responses (ABR) and the
middle latency responses (MLR) are far-field
responses that are used in diagnosis and research.
10. Propagated neural activity in a nerve or a fiber
tract in the brain may generate stationary peaks
in the far-field potentials when the propagation is
halted, or when the electrical conductivity of the
medium surrounding the nerve changes or when
the nerve or fiber tract bends.
11. The far-field potentials from nuclei depend on
their internal organization.
12. The normal ABR consists of five prominent
and constant vertex positive peaks that occur
during the first 10 ms after presentation of
a transient sound. These peaks are labeled by
Roman numerals, I–V. Most studies of the neural
generators of the ABR have concentrated on the
generators of these vertex positive peaks.
13. Peak I and II of the human ABR are generated
exclusively by the auditory nerve (distal
respective proximal portion), while peaks III,
IV, V have contributions from more than one
anatomical structure. Other anatomical structures
of the ascending auditory pathways, contribute
to more than one peak.
CHAPTER
7
Evoked Potentials from the Nervous
System
14. Peak III is mainly generated by the cochlear
nucleus.
15. The sharp tip of peak V is generated by the
lateral lemniscus, where it terminates in the
inferior colliculus on the side contralateral to
the ear from which the response is elicited.
16. The individually variable slow negative
potential following peak V (SN
10
) is generated by
(dendritic) potentials in the contralateral inferior
colliculus.
17. The middle latency response (MLR) is composed
of the potentials that occur during the interval of
10–80 ms or 10–100 ms after presentation of a
stimulus sound.
18. The neural generators of the MLR are less well
understood than those of the ABR. Potentials
generated in the cerebral cortex contribute to the
MLR and muscle (myogenic) responses may also
contribute to the MLR.
19. The “40 Hz response” is a far field response
that results from summation of components of
the evoked potentials that repeat every 25 ms.
20. The frequency following response (FFR) may be
recorded from electrodes on the scalp in response
to low frequency tones.
2. INTRODUCTION
Evoked potentials can be divided into near-field
and far-field potentials, where near-field potentials
are the evoked potentials that can be recorded
from electrodes placed on the cochlea or directly on
specific structures of the auditory nervous system.
Auditory evoked potentials are important tools for
diagnosis of disorders of the ear and the auditory
system. Auditory brainstem responses (ABR) are the
most used auditory potentials in the clinic but middle
latency responses (MLR) are used in special situations.
Studies of evoked potentials have contributed to under-
standing of the function of the ear and the auditory
nervous system. In this chapter, I will discuss the
near-field and far-field potentials from the auditory
nervous system. The neural generators of the ABR will
also be discussed.
3. NEAR-FIELD POTENTIALS
FROM THE AUDITORY
NERVOUS SYSTEM
Evoked potentials recorded directly from a nerve or
a nucleus are known as near-field potentials whereas
far-field potentials are the evoked potentials that can
be recorded at a (large) distance from the active neural
structures. The near-field potentials have large ampli-
tudes and usually represent the neural activity in only
one structure whereas far-field potentials, such as the
ABR, have small amplitudes and often have contribu-
tions from many neural structures as well as muscles.
Studies of electrical potentials recorded directly from
exposed structures of the ascending auditory path-
ways have helped to understand how far field audi-
tory evoked potentials, such as the ABR, are generated
(see p. 167). Recordings of evoked potentials generated
by different parts of the auditory nervous system are
important in intraoperative neurophysiologic moni-
toring that is done for the purpose of reducing the
risks of surgically induced injuries.
Below, I will discuss the electrical potentials that
can be recorded directly from structures of the classi-
cal ascending auditory pathways in response to sound
stimulation. I will first discuss evoked potentials
recorded directly from the auditory nerve and then
discuss responses recorded from nuclei of the ascend-
ing auditory pathways.
3.1. Recordings from the Auditory Nerve
Recordings of the response from the exposed auditory
nerve have been done extensively in animals [23, 284]
and more recently in humans who underwent operations
where the central portion of the eighth cranial nerve was
exposed [80, 205]. Recordings in animals have provided
important information about the function of the ear and
recordings in humans have won clinical use in monitor-
ing of the neural conduction in the auditory nerve when
the nerve has been at risk of being injuring because of
surgical manipulations [185].
The waveform of the compound action potentials
(CAP
1
) in response to click stimulation recorded from
the intracranial portion of the eighth cranial nerve
using a monopolar recording electrode typically has
two negative peaks (N
1
, N
2
) (Fig. 7.1) thus similar to the
AP recorded from the round window of the cochlea as
described in Chapter 4.
In the cat the latency of the N
1
in the response
recorded from the auditory nerve in the internal audi-
tory meatus is approximately 0.2 ms longer than that of
the AP recorded from the round window (Fig. 7.2 [109]).
152 Section II The Auditory Nervous System
1
In the following, we will use the term compound action
potentials (CAP) for the potentials recorded from the exposed
auditory nerve, although they are similar to the potentials that are
recorded from the cochlea, and which are called action potentials
(AP) (p. 57).
The auditory nerve in a small animal, such as the cat,
is approximately 0.8 cm long [59]. The difference
between the latency of the N
1
of the AP and that of the
response from the intracranial portion of the auditory
nerve is the travel time in the auditory nerve from the
ear to the recording site.
Because the auditory nerve in small animals is
very short, any recording site on the auditory nerve
will be close to the cochlea and the cochlear nucleus
and potentials that originate in the cochlea and the
cochlear nucleus are conducted to the recording site by
passive conduction in the eighth cranial nerve and the
surrounding fluid. Intracranial recordings from the
auditory nerve using a monopolar recording electrode
will therefore not only yield potentials generated in
the auditory nerve but also potentials that originate in
the cochlea (mostly cochlear microphonics [CM]) and
in the cochlear nucleus. These passively conducted
potentials thus do not depend on the nerve being able
to conduct propagated neural activity through depo-
larization of nerve fibers. (Passive conduction is also
the reason that recordings from the cochlea in small
animals contain potentials that originate in the
cochlear nucleus as was discussed in Chapter 4.)
The contributions of evoked potentials from the ear
and the cochlear nucleus to the responses recorded
from the auditory nerve can be reduced by using bipo-
lar recording techniques [201]. Some investigators
[228] have used a concentric electrode for recording
from the intracranial portion of the auditory nerve to
reduce the contamination of the neural response by the
CM. However, a concentric electrode consisting of a
sleeve with an insulated wire inside does not provide
true bipolar recording because the two electrodes (the
center core and the sleeve) do not have identical elec-
trical properties. A concentric recording electrode is
anyhow much more spatially selective than a monopo-
lar electrode and the response recorded from the inter-
nal auditory meatus using a concentric electrode has
no visible CM component (Fig. 7.2).
The most commonly used stimuli in connection
with recordings of the CAP from the intracranial por-
tion of the auditory nerve have been clicks or short
bursts of tones or noise. Several studies have shown
that the amplitude of the CAP response increases with
increasing stimulus level in a similar way as the AP
recorded from the round window of the cochlea. The
main reason for that is that more nerve fibers fire as the
stimulus intensity is increased. The latency of the
response decreases with increasing stimulus intensity,
mainly because the generator potentials in the
cochlear hair cells rise more rapidly at high stimulus
intensities than at low stimulus intensities [188].
Cochlear non-linearities also affect the latency differ-
ently at different stimulus intensities (see Chapter 3)
and that contributes to the dependence of the latency
on the stimulus intensity [179]. The conduction veloc-
ity of nerve fibers and the synaptic delays are inde-
pendent of the level of excitation and thus do not
Chapter 7 Evoked Potentials from the Nervous System 153
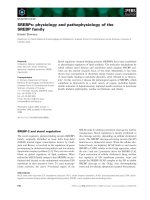
FIGURE 7.1 Recordings from the intracranial portion of the
auditory nerve in a rhesus monkey, at two different positions, near
the porus acousticus and near the brainstem. The stimuli were clicks
presented at 107 dB PeSPL (peak equivalent sound pressure level)
and at a rate of 10 pps (modified from Møller and Burgess, 1986,
with permission from Elsevier).
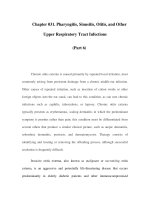
FIGURE 7.2 Comparison between recording from the round
window of the cochlea and from the intracranial portion of the
auditory nerve in a cat using a concentric electrode. The stimulation
was clicks. M is the cochlear microphonic potential (modified
from Peake et al., 1962, with permission from the American Institute
of Physics).
contribute to the intensity dependence of the latency
of the CAP recorded from the auditory nerve.
The amplitude of the CAP elicited by transient
stimuli decreases when the stimulus rate is increased
above a certain rate. Above a certain stimulus rate
the responses elicited by the individual stimuli
overlap, and the amplitude of one of the two peaks
may increase because the N
1
peak of one response
coincides with the N
2
peak of the previous response.
When the rate of the stimulus presentation is
increased beyond approximately 700 pps the ampli-
tude of the response decreases rapidly. The latency of
the response increases slightly when the stimulus rate
is increased.
Recordings of auditory evoked potentials from the
exposed auditory nerve in humans have helped in
the understanding of some of the differences between
the human auditory nervous system and that of small
animals often used in studies of the auditory system.
Several investigators [80, 205, 280] reported at about
the same time that the latency of the CAP recorded
from the exposed intracranial portion of the auditory
nerve in humans is longer than it is in animals when
recorded in a similar way. The reason for that is that
the eighth cranial nerve in humans is 2.5 cm [125], thus
much longer than it is in the animals such as the cat
(approximately 0.8 cm [59]). The latency of the main
negative peak of the CAP recorded from the intracra-
nial portion of the auditory nerve in response to loud
clicks is approximately 2.7 ms [205, 211] thus approxi-
mately 1 ms longer than the AP component of the elec-
trocochlear graphic (ECoG) potentials recorded from
the ear. Compare that to a difference of approximately
0.2 ms in the cat (Fig. 7.2 [228]).
In individuals with normal hearing a monopolar
electrode placed on the exposed intracranial portion of
the eighth nerve records a triphasic potential in
response to click stimulation (Fig. 7.4A) as is typical
for recordings with a monopolar electrode from a long
nerve. The latency of the response decreases with
154 Section II The Auditory Nervous System
BOX 7.1
HISTORICAL BACKGROUND
It was probably Ruben and Walker [255] who first
reported on recordings from the exposed intracranial
portion of the eighth cranial nerve. These investigators
recorded click evoked CAPs from the auditory nerve
during an operation for sectioning of the eighth nerve for
Ménière’s disease, using a retromastoid approach to the
cerebello-pontine angle. The waveform of the recorded
potentials was complex and it had several peaks and
valleys (Fig. 7.3). Ruben and his coauthor suggested that
the responses had contributions from cells of the cochlear
nucleus. Examination of their recordings (Fig. 7.3)
indicates that the intracranially recorded CAP had a longer
latency in humans than in the cat but the authors did not
speculate on the reason for the longer latency. (Accurate
assessment of the latency of the potentials from their
published recordings is not possible because the record
does not show the time the stimulus was applied.)
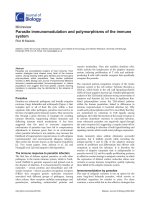
FIGURE 7.3 Recordings from the intracranial portion of the eighth
nerve in a patient undergoing an operation for Ménière’s disease
(reprinted from Ruben and Walker, 1963, with permission from
Lippincott Williams and Wilkins).
increasing stimulus intensity (Fig. 7.4B) and the ampli-
tude of the main peak of the CAP increases with
increasing stimulus intensity (Fig. 7.4A) similar to
what is seen in studies in animals. The response from
the exposed intracranial portion of the auditory nerve
to short tone bursts has a similar waveform as the
responses to click sounds but the latencies are slightly
longer (Fig. 7.5A) [205].
A monopolar recording electrode placed on a long
nerve along which an area of depolarization propagates
will record a characteristic triphasic potential (Fig. 7.6).
The initial positive deflection is generated as the area
of depolarization approaches the recording electrode.
The large negative deflection is generated when the
area of depolarization passes directly under the
recording electrode. The following small positivity is
generated when the area of depolarization is leaving
the location of the recording electrode. If the propaga-
tion of neural activity in such a nerve is brought to a
halt, for instance by injury to the nerve, a monopolar
electrode placed near that location would record a
single positive potential. Such a potential is known as
the “cut end” potential and described by Gasser and
Erlangen (1922) and Lorente de No [143].
Chapter 7 Evoked Potentials from the Nervous System 155
FIGURE 7.4 (A) Typical compound action potentials directly recorded from the exposed intracranial portion
of the eighth nerve in a patient with normal hearing. Responses to condensation (dashed lines) and rarefaction
(solid lines) clicks are shown for different stimulus intensities (given in dB PeSPL). (B) Latency of the negative
peak in the CAP shown in (A) (reprinted from Møller and Jho, 1990, with permission from Elsevier).
If the recording electrode is placed on the auditory
nerve near the porus acousticus it will be approxi-
mately 1.5 cm from the cochlea and it will therefore
not record any noticeable potentials from the cochlea
(CM or SP). (The total length of the auditory nerve in
humans is approximately 2.5 cm and the length of
the nerve between the point where it enters into the
skull cavity from the porous acousticus to its
entrance into the brainstem is approximately 1 cm.)
A recording electrode that is placed near the porus
acousticus will be approximately 1 cm from the cochlear
nucleus and the potentials generated in the cochlear
nucleus will be attenuated before they reach the
recording electrode provided that the eighth nerve in
its intracranial course is submerged in fluid. The
amplitude of the evoked potentials generated in the
cochlear nucleus will be greater when recording
from a location on the auditory nerve that is close to
the brainstem and thus near the cochlear nucleus. If
the eighth nerve is free of fluid in its intracranial
course, it will act as an extension of the recording
electrode that is placed anywhere on the nerve and it
may record potentials from the cochlear nucleus of
noticeable amplitude.
A bipolar recording electrode placed on a nerve
with one of its two tips located more peripherally
than the other will under ideal circumstances only
record propagated neural activity. The waveform of
the compound action potential recorded from a nerve
with a bipolar electrode is different from that recorded
by a monopolar electrode and is more difficult to
sinterpret.
156 Section II The Auditory Nervous System
BOX 7.2
INTRAOPERATIVE NEUROPHYSIOLOGIC MONITORING
Recording from the intracranial portion of the
auditory nerve requires that the eighth cranial nerve be
exposed in its course in the cerebellopontine angle.
That occurs in some operations such as those to treat vas-
cular compression of cranial nerves. Whenever such
recordings are done, it must be assured that the auditory
nerve is not injured by the surgical dissection necessary
to expose the nerve. Therefore, ABR must be recorded
during such dissections to monitor the conduction
velocity in the auditory nerve (for details about moni-
toring neural conduction in the auditory nerve, see
Møller [185]).
BOX 7.3
DISTINGUISHING BETWEEN PROPAGATED AND
ELECTRONICALLY CONDUCTED POTENTIALS
The fact that the latency of the response from the
auditory nerve to click sounds increases when the record-
ing electrode is moved from a location near the porus
acousticus toward the brainstem (Fig. 7.5) is an indication
that at least the main portion of the recorded potentials
are generated by the propagated neural activity in the
auditory nerve [205]. The latency of passively conducted
potentials would not change when the recording elec-
trode is moved along the auditory nerve but their ampli-
tude would decrease when the recording electrode is
moved away from their source. The response from the
exposed intracranial portion of the eighth nerve to low
intensity click sounds often yields a slow deflection of a
relatively large amplitude. That component is probably
generated in the cochlear nucleus and conducted
passively in the auditory nerve to the site of recording.
This slow component of the response is more pronounced
at low stimulus intensities because the amplitude of
the evoked response from the cochlear nucleus decreases
at a slower rate with decreasing stimulus intensity than
that generated by propagated neural activity in the
auditory nerve.
Chapter 7 Evoked Potentials from the Nervous System 157
BOX 7.3 (cont’d)
FIGURE 7.5 (A) Similar recordings as in Fig. 7.4 but showing the response to tone bursts
recorded at two locations along the intracranial portion of the exposed auditory nerve. The solid
lines are recordings close to the porous acousticus and the dashed lines are recordings from a
location approximately 3 mm more central. The stimuli were short 2 kHz tone bursts. The sound
pressure give is in dB PeSPL. (B) The latency of the main negative peak of the CAP recorded
from two different locations as shown in (A) (approximately 3 mm apart) on the exposed eighth
nerve as a function of the stimulus intensity (reprinted from Møller and Jannetta, 1983, with
permission from Taylor & Francis).
FIGURE 7.6 Illustration of recordings from a long nerve in which
an area of depolarization travels from left to right, using a monopo-
lar electrode.
Comparison between bipolar and monopolar record-
ings from the exposed intracranial portion of the audi-
tory cranial nerve [201] further supports the assumption
that click evoked potentials recorded from the auditory
nerve with a monopolar recording electrode, at least at
high stimulus intensities, is mainly the result of prop-
agated neural activity.
More space is required for placing a bipolar recording
electrode on a nerve compared with using a monopolar
recording electrode, but the intracranial portion of the
auditory nerve in the human is sufficiently long to allow
the use of bipolar recording electrodes.
The conduction velocity of the auditory nerve in
humans has been determined from bipolar recordings
from the exposed intracranial portion of the auditory
nerve. The difference in the latency of the CAP recorded
at two different locations on the exposed intracranial
portion of the auditory nerve has been used to deter-
mine the conduction velocity [202]. The value arrived
at, approximately 20 m/s, is similar to what has been
estimated on the basis of the fiber diameter of the
auditory nerve fibers [129].
BOX 7.4
INTERPRETATION OF POTENTIALS RECORDED
BY BIPOLAR ELECTRODES
The potentials that are recorded by a bipolar recording
electrode placed on the intracranial portion of the audi-
tory nerve can be understood by assuming that the bipo-
lar electrode consists of two monopolar electrodes, each
one recording the potentials at two adjacent locations
along the nerve and that the amplifier to which the elec-
trodes are connected senses the difference between the
electrical potentials that the two electrodes are recording
(Fig. 7.7). The electrical potentials generated in a nerve by
propagated neural activity appear with a slight time dif-
ference at the two tips of such a bipolar recording elec-
trode, the time difference being the time it takes the
neural activity to travel the distance between the two tips.
Under ideal circumstances, passively conducted poten-
tials will appear equal at the two electrodes and thus not
result in any output from the differential amplifier to
which the electrodes are connected. To achieve such ideal
performance of a bipolar recording electrode, the two tips
of the electrode must have identical recording properties
and be placed so that they both record from the same
population of nerve fibers. While that is rarely achieved
in practice, a bipolar electrode is less sensitive to poten-
tials generated by passively conducted potentials than a
monopolar recording electrode. If the two tips of the bipo-
lar recording electrode have different recording character-
istics or are not placed exactly symmetrical on the nerve,
passively conducted potentials may appear differently at
the two tips and thus appear as an output from the ampli-
fier to which the bipolar electrode is connected [201].
If no passively conducted potentials reach the record-
ing electrodes the response recorded by a bipolar record-
ing electrode will be the same as the potentials recorded
by a monopolar electrode from which is subtracted a
delayed version of the same response (Fig. 7.8). The dif-
ference between such a simulated bipolar recording and a
real bipolar recording is a measure of the amount of pas-
sively conducted potentials that are recorded by mono-
polar recording electrode.
158 Section II The Auditory Nervous System
FIGURE 7.7 (A) Separate recordings from the exposed
intracranial portion of the eighth cranial nerves with two elec-
trodes placed approximately 1 mm apart. (B) The difference
between the recordings by the two electrodes in (A) (reprinted
from Møller et al., 1994, with permission from Elsevier).
FIGURE 7.8 Recordings from the intracranial portion of the
auditory nerve in a patient whose vestibular nerve was just cut.
Rarefaction clicks presented at 98 dB PeSPL. Top curves:
monopolar recordings by the two tips of a bipolar electrode.
Middle curves: computed difference between the response
recorded by one tip (monopolar recording) and the same
response shifted in time with an amount that corresponds to the
distance between the two tips of the bipolar electrode. Lower
curves are the actual bipolar recording (reprinted from Møller
et al., 1994, with permission from Elsevier).
Direct recording of responses from the eighth nerve
is now in general use in monitoring neural conduction
in the auditory nerve in patients undergoing opera-
tions in the cerebellopontine angle. Such potentials can
be interpreted nearly instantaneously [184, 208]
because of their large amplitudes. Changes in the func-
tion of the nerve from stretching or from slight surgi-
cal trauma that may occur during surgical
manipulations can thereby be detected almost instanta-
neously because only few responses need to be added
(averaged) in order to obtain an interpretable record.
Similar monitoring of neural conduction in the audi-
tory nerve can be achieved by recording the ABR but it
takes much longer to obtain an interpretable record
because of the small amplitude of the ABR (see p. 163).
Click evoked compound action potentials recorded
from the intracranial portion of the eighth nerve
changes in a systematic fashion when the auditory
nerve is injured such as from surgical manipulations
or by heat from electrocoagulation [178]. Recorded
centrally to the location of the lesion, the latency of the
main negative peak increases and its amplitude
decreases. The main negative peak also becomes
broader because the prolongation of the conduction
time in different nerve fibers is different. More severe
injury causes the amplitude of the initial positive
deflection to increase and that is a sign that neural
block has occurred in some nerve fibers (Fig. 7.9).
The frequency following response (FFR), as the
name indicates, is a response that follows the wave-
form of the stimulating sound. FFR can be demon-
strated in the response from the auditory nerve to low
frequency tones and tones that are amplitude modu-
lated at low frequencies. The source of the FFR is
phase locked discharges in nerve fibers. Some investi-
gators have named these potentials the neurophonic
response. FFR has been recorded from the auditory
nerve in animals [276, 277] and from the exposed
intracranial portion of the auditory nerve in humans
[214, 215]. The FFR recorded from the human auditory
nerve is similar to that in the cat recorded by bipolar
electrodes [277]. When recorded directly from the
exposed intracranial portion of the auditory nerve
(Fig. 7.10) in humans, the FFR is prominent in the fre-
quency range from 0.5 to 1.5 kHz [214].
Recordings of the FFR from the auditory nerve in
animals and in humans have contributed to under-
standing of the function of the cochlea. At high stimu-
lus intensities the frequency following responses are
the results of excitation of the basilar membrane at a
location that is more basal than the location tuned to
the frequency of the stimulation [276]. This is a sign of
non-linearity of the basilar membrane vibration (see
Chapter 3).
The waveform of the recorded responses to stimula-
tion with a 0.5 kHz tone is a distorted sinewave
(Fig. 7.13). As a first approximation, the waveform of
the responses indicates that auditory nerve fibers are
excited by the half wave rectified stimulus sound, thus
a deflection of the basilar membrane in one direction.
The waveform of the response to high sound intensity
tones (104 dB SPL) is more complex than the response
to tones of lower intensities and has a high content
of second harmonics, similar to a full-wave rectified
sinewave. That indicates that hair cells respond to
deflection of the basilar membrane in both directions
at high stimulus intensities, thus supporting the find-
ings in animal experiments that some inner hair cells
respond to the condensation phase of a sound while
other inner hair cells respond to the rarefaction phase
[278, 336].
Chapter 7 Evoked Potentials from the Nervous System 159
FIGURE 7.9 Change in the CAP as a result of injury to the
intracranial portion of the auditory nerve in a patient undergoing an
operation where the auditory nerve was heated by electrocoagula-
tion (reprinted from Møller, 1988).
The distortion of the response to low frequency
pure tones could also be a result of what has been
known as “peak splitting” [256, 268]. The distortion
of the waveform of the responses from the human
auditory nerve seems to be less than it is in the cat at
the same sound pressure level. In the studies of the
responses from the exposed eighth nerve in humans,
the ABR was monitored during the surgical exposure
to ensure that the surgical manipulations of the audi-
tory nerve did not cause noticeable change in the neural
conduction in the auditory nerve.
3.2. Recordings from the Cochlear Nucleus
Recordings of the responses from the exposed
cochlear nucleus to various kinds of sound stimuli have
been done both in humans [203, 210] and in animals
[200]. When a monopolar recording electrode is placed
directly on the surface of the cochlear nucleus in
humans the response to a transient sound has an ini-
tial positive-negative deflection (P
1
and N
1
in Fig. 7.14)
[210]. These components represent the arrival of the
neural volley from the auditory nerve in the CN. They
are followed by a slower deflection on which peaks are
often riding. It is assumed that this component is
generated by dendrites in the nucleus and its polarity
depends on the placement of the recording electrode
(Fig. 7.15).
The source of the slow potential can be described by
a dipole with a certain orientation.
Since the activity of nerve cells may be regarded
as a dipole source (Fig. 7.15), a reversal of the polar-
ity occurs when a recording electrode is passed
160 Section II The Auditory Nervous System
FIGURE 7.10 Responses recorded from the exposed intracranial
portion of the auditory nerve to stimulation with 0.5 kHz tones
at 113 dB SPL. Rarefaction of the sound is shown as an upward
deflection (reprinted from Møller and Jho, 1989, with permission
from Elsevier).
BOX 7.5
SEPARATION OF AUDITORY NERVE GENERATED FFR
FROM COCHLEAR POTENTIALS
Studies of the FFR from the auditory nerve in response
to low frequency pure tones in animals are hampered by
the contamination from cochlear microphonics. Snyder
and Schreiner [276] reduced the contamination of the
neural response from potentials generated in the cochlea
by using a bipolar recording technique. The fact that the
auditory nerve is longer in humans than in the cat makes
it possible to record the FFR with a monopolar recording
electrode without any noticeable contamination from
cochlear potentials. That the FFR recorded from the human
auditory nerve with a monopolar electrode is the result of
propagated neural activity is supported by the finding
that the recorded potentials appear with a certain latency
and are shifted in time when the recording electrode is
moved along the eighth cranial nerve (Fig. 7.11).
The responses to low frequency tones recorded from the
human auditory nerve have two components, a frequency
following response and a slow component (Fig. 7.12) [214].
When the responses to tones of opposite phase were
added, the frequency following response was canceled and
the slow potential was seen alone. When the responses to
tones of opposite phase were subtracted the slow potential
was canceled and only the frequency following response
remained.
Chapter 7 Evoked Potentials from the Nervous System 161
through the nucleus [5]. When the recording elec-
trode is placed in between the two recording loca-
tions where the slow potential is positive and
negative it will record only a very small slow poten-
tial because the positive contribution is equal to the
negative contribution.
The peaks that are seen riding on this slow wave are
assumed to be generated by discharges of cells in the
nucleus (somaspikes). The latency of the sharp nega-
tive peak (N
2
) in the response from the auditory nerve
that follows the initial positive-negative deflection
(P
1
, N
1
) is approximately 1 ms longer than that of the
positive deflection (Fig. 7.14) which can be explained
by synaptic delay assuming that the N
2
response is
generated by cells in the cochlear nucleus. The
response from the cochlear nucleus shown in Fig. 7.14
was obtained from a monopolar electrodes placed in
the lateral recess of the fourth ventricle (Fig. 7.16) [119,
203, 216].
The cochlear nucleus consists of three major subdivi-
sions with different response characteristics as judged
from recordings from single nerve cells (see Chapter 6).
Therefore, the evoked responses recorded from the
surface of the cochlear nucleus are likely to be differ-
ent dependent on the subdivision from which they are
recorded.
BOX 7.5 (cont’d)
FIGURE 7.11 Comparison of the response to tone bursts and
clicks recorded at two different locations along the exposed
intracranial portion of the eighth cranial nerve (reprinted from
Møller and Jho, 1989, with permission from Elsevier).
FIGURE 7.12 Similar recordings as in Fig. 7.11 but showing
the responses of both polarities of the sound (0.5 kHz tone at
110 dB SPL) (top traces, solid and dashed lines). The difference
between these two responses (middle trace) and the sum
(bottom trace) is also shown (from Møller and Jho, 1989, with
permission from Elsevier).
The interpretation of the sources of the different
components of the waveform of the response from a
nucleus is based on studies of nuclei of the somatosen-
sory system, done early in the history of neurophysio-
logy. Experiments in a dog showed that a slow
wave that followed after these initial waves gradually
disappeared during anoxia [67]. The initial positive-
negative complex was only affected by prolonged
162 Section II The Auditory Nervous System
FIGURE 7.13 Examples of responses to 0.5 kHz tones recorded
from the exposed intracranial portion of the eighth cranial nerve to
show distortion of the waveform. The responses to tones of two
different intensities are shown. The two curves at each intensity are
the responses to stimulation of opposite polarity (reprinted from
Møller and Jho, 1989, with permission from Elsevier).
FIGURE 7.14 Recordings from the exposed eighth nerve (top
tracings) and the surface of the cochlear nucleus (bottom tracings).
The response from the cochlear nucleus was obtained by placing an
electrode in the lateral recess of the fourth ventricle. Solid lines are
the responses to rarefaction clicks and the dashed lines are the
responses to condensation clicks. Amplitude scales are 0.2 mV for
the auditory nerve recording and 0.1 mV for the cochlear nucleus
recording (reprinted from Møller et al., 1994, with permission from
Elsevier).
BOX 7.6
ANATOMY OF THE LATERAL RECESS OF THE FOURTH VENTRICLE
The caudal portion of the floor of the lateral recess is
the (dorsal) surface of the dorsal cochlear nucleus and the
rostral portion of the floor of the lateral recess is the dorsal
surface of the ventral cochlear nucleus [119]. When the lat-
eral side of the brainstem is viewed in operations using a
retromastoid craniectomy, the foramen of Luschka that
leads to the lateral recess of the fourth ventricle is found
dorsally to the exit of the ninth and tenth cranial nerves.
Often a portion of the choroid plexus is seen to protrude
from the foramen of Luschka and may have to be reduced
by coagulation in order to place a recording electrode in
the lateral recess of the fourth ventricle.
severe anoxia thus indicating that the slow component
was dependent on synaptic transmission while the
initial deflections were generated in a nerve or a fiber
tract. Synaptic transmission is more sensitive to anoxia
than propagation of neural activity in nerves and
fiber tracts.
Recordings from the surface of the cochlear nucleus
have found practical clinical use in intraoperative
neurophysiologic monitoring because it offers a more
stable electrode position compared with recordings
from the exposed eighth cranial nerve [216]. The
amplitude of the auditory evoked potentials obtained
by recording from these two locations is sufficiently
high to allow interpretation after only a few responses
have been added (averaged) [183].
3.3. Recordings from More Central Parts
of the Ascending Auditory Pathways
Reports on recordings from more central brainstem
structure of the ascending auditory pathways in humans
have been few compared with recordings from the
auditory nerve and the cochlear nucleus and such
recordings have not yet found practical use in intraop-
erative monitoring, but they have been important for
identification of the neural generators of the ABR.
Recordings from the inferior colliculus and its vicinity
using chronically implanted electrodes have been
done recently [329].
The waveform of the response to short tone bursts
(Fig. 7.17) recorded from the surface of the contralateral
inferior colliculus in humans [79. 80, 206] is typical of a
nucleus. The earliest positive deflection is presumably
generated when the volley of neural activity in the lat-
eral lemniscus reaches its termination in the inferior
colliculus and the slow negative deflection is likely a
result of dendritic activity, thus similar to the cochlear
nucleus. Recordings of the response from the inferior
colliculus to ipsilateral stimulation results in responses
with much smaller amplitudes and a different wave-
form and indicates that the input from the ipsilateral
ear that reaches the inferior colliculus is small [217].
4. FAR-FIELD AUDITORY
EVOKED POTENTIALS
Far-field evoked potentials are the responses
that can be recorded from electrodes placed far from
their source. Far-field potentials therefore have much
smaller amplitudes than near-field potentials and it is
Chapter 7 Evoked Potentials from the Nervous System 163
FIGURE 7.15 Schematic illustration of the potentials that
may be recorded from the surface of a sensory nucleus in response
to transient stimulation such as a click sound for the auditory
system. The three waveforms shown refer to recordings at
opposite locations on the nucleus and in between to illustrate
the dipole concept for describing the potentials that are generated
by a nucleus. The waveform of the response that can be
recorded from the nerve that terminates in the nucleus is also
shown (reprinted from Møller, A.R. 2006. Intraoperative
Neurophysiologic Monitoring, 2nd Edition, Humana Press Inc.
with permission from Humana Press Inc).
FIGURE 7.16 Placement of recording electrode in the lateral recess
of the fourth ventricle (reprinted from Møller, A.R. 2006. Intraoperative
Neurophysiologic Monitoring, 2nd Edition, Humana Press Inc, with
permission from Humana Press Inc; modified from Møller AR,
Jho HD, Jannetta PJ. Preservation of hearing in operations on acoustic
tumors: An alternative to recording ABR. Neurosurgery 1994; 34:
688–693, with permission by Lippincott Williams and Wilkins).
necessary to add the responses to many stimuli in
order to discern the various components of far-field
potentials from the background of other biologic sig-
nals such as the spontaneous electroencephalographic
(EEG) activity, potentials from muscles and electrical
interference signals. Far-field evoked potentials could
therefore not be studied before the development of the
signal averager.
While evoked potentials can always be recorded
from electrodes placed directly on nerves, fiber tracts
and nuclei, such structures generate far-field poten-
tials only when certain criteria are fulfilled. Thus, neural
activity that propagates in a nerve or a fiber tract gener-
ates stationary peaks in the far-field when the electri-
cal conductivity of the surrounding medium changes
or when it is bent [94]. Neural activity that propagates
in a straight nerve, the surrounding medium of which
has uniform electrical conductivity, generates very little
far-field potentials. A nucleus generates strong far-field
potentials when its dendrites are organized uniformly
whereas a nucleus where the dendrites are randomly
organized and point in all directions generates little
far-field potentials. These two different types of nuclei
are known to have an open and a closed field, respec-
tively [142].
Far-field potentials are more complex than near-field
potentials because they are likely to have contributions
from sources with different anatomical locations. Neural
structures activated sequentially by transient stimula-
tion may generate a sequence of components, each of
which occur with different latencies. The brainstem
auditory evoked potentials (ABR) (Fig. 7.18) are exam-
ples of far-field-evoked potentials that are commonly
used for clinical diagnosis and for intraoperative mon-
itoring. The ABR is recorded from electrodes placed
on the scalp and the earlobe (or mastoid). It is the
most important functional test for detecting vestibular
Schwannoma. The middle latency responses (MLR)
are another kind of far-field auditory evoked poten-
tials that can be recorded from electrodes placed on the
scalp and which are used clinically to a lesser extent
than the ABR. Proper interpretation of these auditory
164 Section II The Auditory Nervous System
FIGURE 7.17 Responses recorded from the inferior colliculus in patients undergoing operations where the inferior colliculus was exposed
or responses recorded from an electrode placed along the path of the fourth cranial nerve (reprinted from Møller and Jannetta, 1982, with
permission from Elsevier).
Chapter 7 Evoked Potentials from the Nervous System 165
evoked potentials for diagnostic purposes depends on
knowledge about the anatomical origin of the different
components of these potentials and how they are
affected by pathologies. During the past two decades
much knowledge about the neural generators of the ABR
has accumulated but the neural generators of the MLR
are not as well known and that has hampered the use
of the MLR in diagnosis of neurologic disorders. The
MLR is considerably more variable than the ABR and
it is mainly used as an objective test of hearing thresh-
old. The MLR has a potentially important role for
diagnosis of disorders of the auditory nervous system,
but insufficient knowledge about the origin of these
potentials has so far prevented such use.
The far-field FFR to periodic sounds such as pure
tones sounds can also be recorded from electrodes
placed on the scalp. The modulation waveform of
amplitude-modulated sounds likewise give rise to far-
field potentials that can be recorded from electrodes
placed on the scalp.
Electrodes placed on the scalp also record responses
from muscles that are elicited by sound stimulation
(myogenic evoked potentials). Muscle activity that is
not related to the sound stimulation act as interference
and prolong the time it takes to obtain an interpretable
record.
4.1. Auditory Brainstem Responses
The human auditory brainstem response (ABR)
consists of far-field evoked potentials from the audi-
tory nervous system that occur during the first 10 ms
after the presentation of a transient sound such as a
click sound or a tone burst. The amplitudes of the ABR
are small, less than 0.5 µV, and thus much smaller than
the ongoing spontaneous activity of the brain (EEG).
Therefore responses to many stimuli must be added to
obtain a recording where the individual components
can be discerned. The different components of the ABR
are generated by neural activity in the ear, the auditory
nerve and the nuclei and fiber tracts of the ascending
auditory pathways.
When recorded differentially between two elec-
trodes, one placed at the vertex and one at the mastoid
or earlobe on the side where the stimulus sounds are
presented, the ABR typically is characterized by five to
seven vertex positive waves (Fig. 7.18). These waves
(or peaks) are traditionally labeled with roman numer-
als. The first five of these peaks of the human ABR
except peak IV can usually be discerned in individuals
with normal hearing.
The labeling of the vertex positive waves by Roman
numerals that Jewett and Williston [96] introduced is
still the most common way to label the components of
the ABR. This labeling is different from the way differ-
ent components of other sensory evoked potentials
are labeled. Usually, both positive and negative com-
ponents of evoked potentials are labeled with the
letter P and N respectively, followed by a number that
gives the normal value of the latency of the respective
component.
One of the consequences of only labeling the vertex
positive peaks of the ABR has been that only the latency
of these positive peaks have been used for diagnostic
purposes and most studies of neural generators of the
ABR have ignored the negative waves. At the time
when this labeling was introduced it was not known
which of the different components of the ABR were
most important for diagnostic purposes. It would
seem likely that the vertex negative waves would also
be of diagnostic value as these negative waves also
have distinct neural generators [217].
Some authors prefer to show the ABR with the
vertex positivity as an upward deflection, whereas
FIGURE 7.18 Typical recording of ABR obtained in a person with
normal hearing. The curves are the average of 4,096 responses to
rarefaction clicks, recorded from electrodes placed on the forehead
at the hairline and the mastoid on the side where the stimuli were
applied. The upper recording is shown with vertex positivity as an
upward deflection, the middle curve is the same recording shown
with positivity downward. These two curves are recordings that
were filtered electronically with a band-pass of 10–3,000 Hz. The
bottom curve is the same recording after digital filtering designed to
enhance all five peaks of the ABR (from Møller, 1988).
others display the ABR with the vertex positivity as
a downward deflection (Fig. 7.18), the latter being in
accordance with the common convention of displaying
negative potentials as an upward deflection, assuming
the vertex electrode to be the most active electrode.
In this book, ABRs are always shown with vertex
positivity as a downward deflection.
Many factors affect the waveform and the ampli-
tude of the ABR. Recording parameters, filtering of
the recorded potentials, individual variations some of
which are related to age and size of the head, all influ-
ence the recorded potentials.
The main purpose of filtering the ABR is to reduce
the number of responses that must be averaged in
order to obtain an interpretable record. Filtering can
also enhance specific components of the ABR and the
appearance of the ABR depends on the way that the
potentials are filtered (Fig. 7.19). Since it is the latencies
of the different peaks that are important for diagnostic
purposes, the filters used should enhance the peaks
that are of diagnostic importance without shifting the
peaks in time. When recorded with an open band pass
(10–3,000 Hz), the ABR has the appearance of a series
of three clear positive peaks (Fig. 7.19) followed by
peak V. When low frequency components of the ABR
are not attenuated by filtering (Fig. 7.19), peak V is
seen to be followed by a broad negative peak, the SN
10
component (Fig. 7.20). Electronic filters shift the peaks
in time to an extent that depends on the spectrum of
the peaks, the type of filters used, and their settings.
Electronic filters may shift the different peaks of the
ABR differently. It is possible to design electronic filters
166 Section II The Auditory Nervous System
BOX 7.7
HISTORY OF THE AUDITORY BRAINSTEM RESPONSE
It was probably Kiang [107] and his colleagues at the
Eaton Peabody Laboratory in Boston who first demon-
strated these potentials. Dr Kiang belonged to the group
at MIT assembled by Professor Walter Rosenblith, who
pioneered signal analysis of neuroelectric potentials and
was in the forefront for developing signal averaging into
a routine method for studies of neuroelectric potentials.
Dr Kiang also predicted that these potentials might be
useful in diagnosis of disorders of the auditory system and
in intraoperative monitoring [107]. However, systematic
studies of the ABR were not published until 10-15 years
later at which time Jewett and his collaborators [95, 96]
identified and described the different components of
the ABR and introduced the placement of the recording
electrodes that is now commonly used: one electrode
placed at the vertex and the other placed at the mastoid
on the side where the stimuli are applied [96]. This place-
ment, however, is not the ideal montage from a physio-
logical point of view.
When evoked potentials are recorded differentially
between two electrodes, one electrode is usually placed at a
location where the potential to be recorded is large and the
other electrode (reference electrode) is placed on a location
where it records as little as possible of the evoked potentials
that are studied. With the electrode placement commonly
used for recording ABR both recording electrodes record
auditory evoked potentials. Peak V has a larger amplitude
in the vertex recording than in the recording from the mas-
toid while peaks I–III have larger amplitudes in the record-
ings from the mastoid or earlobe than from the vertex.
FIGURE 7.19 The same ABR, filtered in three different ways.
Top traces: low pass filter with a digital filter with a triangular
shaped weighting function with a base of 0.4 ms. Middle trace: dig-
ital band pass filter with a W shaped weighting function with a base
of approximately 1 ms. Lower trace: digital filter with a W shaped
weighting function with a base of approximately 2 ms (assuming a
40 µS sampling time).
Chapter 7 Evoked Potentials from the Nervous System 167
with linear phase shift and such filters (known as
Bessel filters [37]) will shift all components of the ABR
with same amount but such filters are rarely available.
Digital filters are more flexible than electronic filters
and optimal filtering can be obtained using digital fil-
ters whereas electronic filters have considerable limita-
tions [20, 185]. Digital filters are computer programs
that operate on the averaged waveform of the ABR.
Zero-phase digital filters can be designed so that they
do not shift any peak of the ABR at all. Aggressive
filtering that is made possible using digital filters can
enhance specific components of the ABR that are of
interest (peaks). Peak II and peak IV of the ABR are
often difficult to identify, but appropriate (digital) fil-
tering can make these peaks appear clearly (Fig. 7.19).
Such filtering also makes it possible to have computer
programs identify the individual peaks and print their
latencies automatically (Fig. 7.19). It is common in
commercially available equipment to use digital filters
that emulate electronic filters. However, such filters
do not provide all the advantages of digital filters.
So called zero phase finite impulse filters offer other
advantages that cannot be achieved with electronic
filters (or digital filters that emulate electronic filters)
such as reduced effect of stimulus artifacts [185].
The amplitude of the ABR decreases with decreas-
ing stimulus intensity
2
and the latencies increase but
the different components of the ABR are affected
differently. Decrease in stimulus intensity cause the
amplitude of early peaks (I, II, and III) to decrease
more than that of peak V (Fig. 7.21). That means that
at low stimulus intensities, practically only peak V is
discernible.
For diagnosis of disorders of the auditory nervous
system (or for excluding such disorders) the ABR is
commonly elicited by click simulation presented to
one ear at a time. Clicks can be either condensation
clicks or rarefaction clicks. Condensation clicks move
the tympanic membrane (initially) inward while rar-
efaction clicks cause movement of the tympanic mem-
brane in the opposite direction. In attempts to reduce
the stimulus artifact, it has been common to use alter-
nating condensation and rarefaction clicks. While the
ABR in individuals with normal hearing are nearly
identical when elicited by condensation or rarefaction
clicks, the ABR may differ considerably in response to
these two types of clicks in individuals with cochlear
hearing loss [212]. The use of alternating condensation
and rarefaction clicks as stimuli is therefore not recom-
mended. (For more details about the use of ABR in
diagnostics, see Hall [75] or Jacobson [88].)
At a first approximation, the different components
of the ABR are generated by neural activity in sequen-
tially activated structures of the ascending auditory
pathways. However, the classical auditory nervous
system is not just a string of nuclei connected with fiber
tracts but rather a complex series of nuclei with many
interconnections, including a high degree of parallel
processing, and that complicates the interpretation of
the ABR (see Chapter 9).
The generation of ABR has been studied in animals
and more recently, in humans during neurosurgical
operations where the intracranial portion of the auditory
FIGURE 7.20 The effect of filtering on the broad negative peak at
approximately 12 ms latency (SN
10
). Top trace: unfiltered. Bottom
trace: digitally band-pass filtered. Note that the time scale is 20 ms
(reprinted from Møller and Jannetta, 1982, with permission from
Elsevier).
2
The intensity of clicks used for recording ABR is often given in
“peak equivalent SPL” (PeSPL), which is the sound pressure of a
pure tone with the same peak sound pressure as the clicks. It is also
common to give the intensity of click stimulation in dB above the
normal hearing threshold (dB HL). (Hearing level [HL] is the sound
level in dB above the average threshold of young individuals without
disorders of the ear.) While the physical measure of click intensity
(PeSPL) is independent of the rate at which the clicks are presented,
the behavioral threshold (dB HL) decreases with increasing repetition
rate because of temporal integration in hearing. Thus at a rate of
5 pps the threshold is approximately 37 dB PeSPL, at 20 pps it is
35 dB PeSPL and at a rate of 80 pps, the threshold is 32 dB PeSPL
[283]. This means that the HL of clicks of (physical) intensity of which
is 105 dB PeSPL is 70 dB when presented at 20 pps.
nerve and other structures of the ascending auditory
pathways become exposed. Most studies of the genera-
tors of the ABR have focused on generators of the vertex
positive peaks in the ABR and only a few studies have
concerned the vertex negative waves of the ABR.
Much of our understanding of the contributions
from the ascending auditory nervous system to the
ABR has been gained from studies in animals but
the specific anatomical differences between the audi-
tory nerve in humans and the commonly used experi-
mental animals including the monkey have caused
misinterpretation of the neural generators of the ABR
in humans. During the past 20–25 years extensive
studies of the responses recorded directly from
exposed structures of the human auditory nervous
system during neurosurgical operations have con-
tributed to the understanding of the generation of the
human ABR.
The abnormalities of the ABR in patients with
known pathologies such as tumors, etc., have also
been used to identify the neural generators of the ABR.
The use of pathologies presumes that the pathology in
question affects specific parts of the ascending audi-
tory pathways and that the anatomical location of the
pathology is known. The disadvantages of using such
methods are related to difficulties in assessment of the
anatomical location and extent of the pathologies.
Imaging studies such as the magnetic resonance imag-
ing (MRI) scans can only detect changes in structure
and not in function and it is uncertain how specific
morphological abnormalities, as they appear in imag-
ing studies, relate to functional abnormalities.
Reconstruction of the dipoles of the generators of
sensory evoked potentials based on recordings of
three-dimensional evoked potentials make it possible
to obtain some information about the anatomical
location of generators of sensory evoked potentials.
The spatial resolution is, however, limited. Such
recordings (three-dimensional Lissajous trajectories,
3-CLT) are made by placing three pairs of electrodes
orthogonal on the scalp.
Perhaps the most successful method for identifying
the neural generators of the ABR is the one that makes
use of comparisons between the ABR and evoked
potentials recorded directly from specific structures of
the ascending auditory pathways in patients undergo-
ing neurosurgical operations. Coincidence in time
between the main components of the directly recorded
potentials and the different (vertex positive) peaks of
the ABR has been taken as an indication, but not a
proof, that a specific structure is the generator of a cer-
tain component of the ABR. Such studies can be made
in selected neurosurgical operations where it becomes
possible to place a recording electrode directly on the
intracranial portion of the auditory nerve, the cochlear
nucleus or other structures of the ascending auditory
pathways or in their immediate vicinity. In such stud-
ies, the ABR is recorded simultaneously before and
during intracranially recordings to ensure that the sur-
gical manipulations have not affected the function of
the structures that contribute to the ABR [80, 147, 205,
253, 280]. Some investigators [79] have recorded directly
from the auditory nervous system by inserting elec-
trodes through burr holes in the skull and passing
them through the brain to reach the desired location.
Clicks have been the most commonly used stimuli in
such studies, but some investigators have used tone
bursts as stimuli.
Recordings from the intracranial portion of the
eighth cranial nerve in operations where that portion of
the nerve became exposed revealed that the negative
peak of the response (CAP) occurs with approximately
168 Section II The Auditory Nervous System
FIGURE 7.21 Effect of stimulus intensity on the ABR. ABRs in
response to click stimulation presented at a rate of 30 pps at differ-
ent sound intensities (given in dB SL). Two thousand responses were
averaged and one repetition is shown. Note that vertex positivity is
shown as an upward deflection (reprinted from Galambos and
Hecox, 1977, with permission from Karger).
Chapter 7 Evoked Potentials from the Nervous System 169
the same latency as the second vertex positive peak
(peak II) in the ABR [80, 147, 205, 280]. This has been
taken to indicate that peak II is generated by the cen-
tral portion of the auditory nerve (Fig. 7.22). The rela-
tionship between the negative peak in the CAP
recorded directly from the intracranial portion of the
eighth nerve became even more convincing when the
latencies of peak II of the ABR and the main negative
peak of the CAP were compared over a large range of
stimulus intensities (Fig. 7.23) [204].
Before these studies were published, comparison of
the ECoG potentials with the ABR had shown that
peak I of the ABR occurs with the same latency as the
negative peak (N
1
) in the ECoG [233]. The N
1
peak of
the ECoG is generated by the most peripheral portion
of the auditory nerve and therefore also peak I of the
ABR is assumed to be generated in the most peripheral
portion of the auditory nerve (in the ear). That means
that in humans, peak I is generated by the distal
portion of the auditory nerve and peak II is generated
by the proximal (intracranial) portion of the auditory
nerve, thus the auditory nerve is the generator of two
peaks in the ABR. This is different from animals used
in auditory research where the auditory nerve is the
generator of only one peak in the ABR. The reason for
that is that the auditory nerve is much shorter in ani-
mals than in humans (0.8 cm in the cat [59] versus
2.5 cm in humans [124]).
The response recorded directly from the surface of
the cochlear nucleus has a less clear relationship with
the simultaneously recorded ABR than the CAP
recorded directly from the auditory nerve. Comparison
between the responses recorded from the exposed
eighth cranial nerve, the cochlear nucleus and the
ABR (Figs 7.24 and 7.25) show that the initial positive-
negative deflection in the response from the cochlear
nucleus has the same latency as peak II of the ABR
and the sharp negative peak (N
2
) that follows in the
response from the cochlear nucleus has the same latency
as peak III of the ABR. This large negative peak in the
cochlear nucleus response is probably a result of firings
of nerve cells.
Peak III is thus the earliest manifestation of neural
activity in secondary neurons. The cochlear nucleus is
also the main generator of the vertex negative wave
between peak III and peak IV of the ABR. The fiber
tract that leaves the cochlear nucleus may contribute to
peak III of the ABR (including the negative component
FIGURE 7.22 Comparison between intracranial recordings made
from the exposed eighth nerve and the ABR. IAM = recording of the
CAP from the intracranial portion of the eighth nerve where it exits
the bony canal (porus acousticus). CPA = recordings of the CAP
directly from the exposed eighth nerve in the cerebello pontine
angle (CPA). C3 = ABR recorded between the ipsilateral earlobe and
the C3 on the parietal ipsilateral scalp (international EEG recording
nomenclature) (reproduced from Hashimoto et al., 1981, with
permission from Oxford University Press).
FIGURE 7.23 Latency of the negative peak in the CAP recorded
from the intracranial portion of the eighth nerve as a function of the
stimulus intensity (open triangles) and the latency of peak II of the
ABR postoperatively (open circles). The sound stimuli were 5 ms
long 2 kHz tone bursts (modified from Møller and Jannetta, 1981,
with permission from Elsevier).
that follows peak III) [210]. Peak III may in addition
receive contributions from (late) firings of auditory
nerve fibers but peak III probably does not receive
input from neurons of a higher order than the cochlear
nucleus.
The timing of the neural activities in the three dif-
ferent divisions of the cochlear nucleus may be differ-
ent and the different divisions may contribute to
different peaks of the ABR. The three striae where they
merge to form the lateral lemniscus may also con-
tribute to peak III and the following negative deflec-
tion in the ABR.
The anatomical locations of the neural generators of
peak IV are poorly understood and only few pub-
lished studies have addressed the sources of peak IV
of the ABR. Recordings of evoked potentials directly
from the exposed lateral brainstem, rostral to the
entrance of the eighth cranial nerve near the fifth cra-
nial nerve have revealed a distinct component with a
latency value that is similar to that of peak IV of the
ABR (Fig. 7.25). This recording location is anatomically
close to the superior olivary complex, indicating that
the superior olivary complex might generate these near
field potentials and thus suggesting that peak IV of the
ABR might be generated by the nuclei of the superior
olivary complex [79, 209].
170 Section II The Auditory Nervous System
FIGURE 7.24 Comparison of the response (A) from the eighth
nerve, (B) entrance of the eighth nerve into the brainstem, (C) the
lateral side of the brainstem about 4 mm rostral to the entrance of
the eighth nerve and digitally filtered ABR recorded differentially
between the mastoid and vertex. Negativity of the near-field poten-
tials is shown as an upward deflection and vertex positivity of the
ABR is shown as a downward deflection. The stimuli were 2 kHz
tone bursts at 90 dB SPL (reprinted from Møller and Jametta, 1984,
with permission from Butterworth Publishers).
FIGURE 7.25 Recordings of the response from the floor of the
fourth ventricle to click stimulation in a patient undergoing an oper-
ation where the floor of the fourth ventricle was exposed surgically.
The stimulation was applied to the right ear. Amonopolar recording
electrode was used to record the responses from the ipsilateral,
contralateral dorsal cochlear nucleus (DCN) and at the midline over
the dorsal stria. Negativity is shown as an upward deflection.
V–N = ABR recorded differentially between vertex and the upper neck,
vertex positivity is displayed as a downward deflection; E–E = ABR
recorded between the two earlobes, ipsilateral earlobe negativity is dis-
played as a downward deflection. Solid lines: responses to rarefaction
clicks (105 dB peSPL), dashed lines responses to condensation clicks
(reproduced from Møller et al., 1994, with permission from Elsevier).
Responses to contralateral stimulation that can be
recorded from the floor of the fourth ventricle near the
inferior colliculus [79, 80, 206, 217] reveal a sharp positive
deflection that is followed by a broad negative wave. The
sharp positive deflection occurs with nearly the same
latency as peak V of the ABR (Fig. 7.25) [80, 206]. The
response is larger and more distinct to contralateral stim-
ulation than to ipsilateral stimulation (Fig. 7.25) [217].
That supports the hypothesis that the initial sharp pos-
itive deflection is generated by the terminations of the
lateral lemniscus in the inferior colliculus on the side
that is contralateral to the stimulation. Peak V is thus
generated mainly by structures that are activated by
contralateral stimulation.
The slow deflection in the response from the infe-
rior colliculus (Fig. 7.26) has a similar latency as the
broad negative deflection seen to follow peak V in the
ABR. This peak (SN
10
[34]) is variable in humans and
usually attenuated by the commonly used filtering of
the ABR. When the responses recorded directly from
the inferior colliculus or its close vicinity are filtered
so that low frequency components are attenuated, a
series of sharp waves appear after the initial positive
peaks. These waves probably reflect firings of nerve
cells in the inferior colliculus (somaspikes). Comparison
between the ABR and such filtered recordings from the
inferior colliculus indicate that these components may
be the generators of peaks VI and VII of the ABR
(Fig. 7.26).
Identification of the anatomical location of the gen-
erators of the ABR has been attempted by recording
the ABR in three orthogonal planes [93, 147, 234, 262].
Such three-dimensional recordings, known as the three-
channel Lissajous’ trajectory (3 CLT), display evoked
potentials as a line, each point of which represents the
voltage at any given time after the stimulus (Fig. 7.27).
Chapter 7 Evoked Potentials from the Nervous System 171
FIGURE 7.26 Responses recorded from the vicinity of the inferior
colliculus with the reference electrode on the clavicle (solid lines)
compared with the ABR recorded in the same operation between the
vertex and a position immediately above the ipsilateral pinna
(dashed lines). The top tracings: recordings with electronic filtering
0.003–10 kHz and digital low-pass filtering by a triangular weight-
ing function with a 0.8 ms base. Bottom tracings: the same record-
ings after digital filtering with a triangular weighting function that
has a band-pass characteristic and attenuates slow potentials. The
stimuli were 5 ms long, 2 kHz tone bursts at 95dB SPL, presented at
a rate of 7 pps (reprinted from Møller and Jannetta, 1983, with per-
mission from Taylor & Francis).
FIGURE 7.27 Illustration of the 3 CLT. Upper graph shows
recordings of the ABR in three orthogonal planes. Lower graphs
are two-dimensional plots (Lissajous' trajectories). (reprinted from
Pratt et al., 1985, with permission from Elsevier).
The use of the 3 CLT recordings to identify the anatom-
ical location of the generators of evoked potentials such
as the ABR is based on the assumption that the head
acts as a sphere. A dipole source that is located inside
the sphere generates electrical potentials that can be
recorded from electrodes placed on the surface of
the sphere. These potentials can be calculated when the
location of the dipole source is known. However,
the opposite, namely calculating the location of gener-
ators when the potentials on the surface are known,
can only be done when certain conditions are fulfilled.
This is because a certain voltage distribution on the
sphere can be caused by more than one location of a
dipole source. Thus while such 3 CLT recordings
provide a complete description of the potentials on
the surface of the head, determination of the location
of a source of the potentials on the basis of distribution
of the electrical voltage on the surface of the head
does not have a unique solution. Despite this defi-
ciency, the 3 CLT method has yielded valuable results
regarding identifying the anatomical location of
individual generators of the components of the ABR
[147, 235, 262, 309].
Scherg and von Cramon [262] showed that the gen-
eration of the ABR could be synthesized by six dipoles,
approximately located in the coronal plane (a vertical
plane that is perpendicular to the sagittal plane).
Dipole I is nearly horizontally oriented and represents
the auditory nerve (Fig. 7.28). The negative deflection
that follows peak I (I-) has a slightly different orienta-
tion. Dipole III and III- are also horizontally oriented
toward the contralateral ear, and located in the lower
brainstem on the ipsilateral side at approximately the
same distance from the midline as the cochlear
nucleus. The fifth and sixth dipole representing peaks
IV and V are oriented vertically but the resolution of
these vertical components did not allow determination
of their exact location, nor was it possible to determine
whether they were located ipsilaterally or contralater-
ally to the stimulated ear.
Studies of such 3-CLT recordings thus confirmed
results obtained by other methods particularly regard-
ing the generator of peak I and II and helped to explain
how the recorded ABR depends on the electrode posi-
tions. Since the orientation of the dipoles of peaks I, II,
and III are mostly along a line between the two ears,
these peaks will appear with their highest amplitudes
in recordings where the electrodes are placed at each
earlobe (or mastoid), whereas peaks IV and V are best
recorded from electrodes placed on the vertex and one
earlobe or with a non-cephalic reference (such as the
upper neck).
Studies of pathologies that affect the auditory nerv-
ous system have confirmed that peak II is generated
by the intracranial portion of the auditory nerve.
Some studies of abnormalities of the ABR in indi-
viduals with known pathologies have produced
results that at a glance contradict other studies of the
neural generators of the ABR [146]. One such disagree-
ment regards the question about laterality of the gen-
erators of the ABR.
While most investigators agree that peaks I, II, and
III are generated on the ipsilateral side of the brain-
stem, some investigators disagree about the anatomi-
cal location of the generators of the later peaks [217].
Thus, Markand and coworkers [146] have interpreted
available data and came to the conclusion that peak V
is generated by brainstem structures on the side from
which the ABR is elicited.
Determining the anatomical location of the neural
generators of peak V of the ABR on the basis of
abnormalities in the ABR in patients with lesions that
affect the ascending auditory pathways has pitfalls
that are often overlooked. The results of such studies
are also more difficult to interpret than results from
intracranial recordings. Nevertheless, such methods
have the advantage that the results are directly related
to the use of the ABR in diagnosis of disease processes
that may affect the auditory nervous system.
Animal experiments make it possible to study the
effect of inactivation (ablation) of specific neural struc-
tures on the ABR in addition to comparing the poten-
tials recorded from specific structures of the ascending
auditory pathways with the ABR. However, the ABR
in the animals that have been studied differs from that
of humans. Thus the ABR obtained from animals,
172 Section II The Auditory Nervous System
FIGURE 7.28 Orientation and strength of the six dipoles identi-
fied from recordings from electrodes placed in three planes. The hori-
zontal line is a line between the two ears and it is also the time axis.
The vertical axis is a line between the middle of that line and the
vertex. The origin of the vectors is the latency of the first peak in
the dipole and the length is the relative strength of the dipoles. Note
the short distance between the two first dipoles (peak I and II of the
ABR) and the third (peak III) (reprinted from Scherg and von
Cramon, 1985, with permission from Elsevier).
Chapter 7 Evoked Potentials from the Nervous System 173
BOX 7.8
DIFFERENT INTERPRETATIONS OF ABR NEURAL GENERATORS
BASED ON PATHOLOGY
The results of studies of the abnormalities of the ABR
in patients with discrete intrinsic lesions of the brainstem
[146, 222, 325] have been interpreted to show that the
neural generators of all peaks, including peak V are located
on the side from which the ABR is elicited. The results have
been summarized by the widely cited statement: “When
ABR abnormalities either occur exclusively on stimulation
of one ear or are asymmetric on right and left ear stimula-
tion, the responsible lesion in the brain stem is on the side
of the ear eliciting maximal abnormality” [146].
Garg et al. [64] studied patients with a certain kind of
hereditary motor-sensory neuropathy (type I) and found
evidence that both peak I and peak II of the ABR were
generated by the auditory nerve. That peak III is gener-
ated in the pontine region of the ipsilateral brainstem was
supported by studies of the abnormalities of the ABR in
patients with discrete lesions in the brainstem [64, 146].
Chiappa [26] in a recognized handbook on evoked
potentials has extended the conclusions from lesion studies
on the ABR to mean that the ABR does not reflect the parts
of the ascending auditory pathways that are normally
associated with hearing (the crossed pathways). This
seems too strong a statement and the results from studies
of pathologies can be explained in a more plausible way.
As mentioned above, there is overwhelming evidence
from physiological studies that peak V is mainly generated
by structures located on the contralateral side with the main
crossing occurring at the level of the superior olivary com-
plex (see Chapter 5), but anatomical studies show uncrossed
pathways as well. It is not known how many fibers cross
and how many continue on the same side and the impor-
tance of the uncrossed pathways for hearing is unknown.
The findings that lesions (tumors, bleeding, etc.) verified
by imaging techniques (such as MRI) affect components of
the ABR elicited from the side of the lesion more than
they affect (peak V) of the ABR elicited from the contralat-
eral ear [146] does not need to be a contradiction to results
of electrophysiologic studies that show that peak V of the
ABR is generated mainly by structures located on the oppo-
site side from which the ABR is elicited. These findings can
be explained without resorting to such a drastic assump-
tion that the uncrossed pathways are the (main) generator
of the ABR [26].
First, recognize that changes at the peripheral levels are
imposed on more centrally located structures. Lesions of
peripheral structures will therefore also affect compo-
nents of the ABR that are generated by more centrally
located structures. Assume that peak V is generated when
propagated neural activity in the lateral lemniscus (LL)
halts, which normally occurs where the lateral lemniscus
terminates in the inferior colliculus. Lesions to the LL
from disease processes, such as a tumor, may cause a
total or partial arrest of propagation of neural activity at
the location of the lesion. Such a halt in propagation of
neural activity in the LL can generate a stationary peak in
the far field that is indistinguishable from a normal peak
V. A lesion located at the LL anywhere between the ipsi-
lateral cochlear nucleus and the contralateral inferior col-
liculus will have the same effect. The only obvious
abnormalities in the ABR would be a slightly shorter
latency of peak V that is unlikely to be noticeable. The
SN
10
would be abolished by interruption of the neural
transmission in the LL but the SN
10
is normally not
detectable because the high-pass filter commonly used
attenuates the SN
10
. That means that a lesion of the LL in
its contralateral course may not produce any noticeable
change in the ABR. For the same reason, the effect of a
tumor or other lesion on the inferior colliculus may not
change the ABR noticeably.
The finding of changes in the ABR elicited from the
ipsilateral side in patients with lesions in the brainstem
may be explained by the fact that the anatomical extension
of the lesions were poorly defined and lesions in the mid-
brain as determined by MRI scans may extend further
caudally and affect the cochlear nucleus and superior
olivary complex.
Studies that show that lesions that affect the midbrain
may cause changes in peak V of the ABR elicited from
the contralateral ear have often been overlooked. Thus,
Zanette et al. [328] found that peak V was absent in the
ABR of certain patients with brainstem hemorrhage when
elicited from the ear contralateral to the bleeding. Fischer
et al. [53] showed that wave V of the ABR was delayed
and had a reduced amplitude when elicited from the
opposite side in a patient with a lesion involving the infe-
rior colliculus. It should also be noted that the study by
Markand [146] indeed found changes in the ABR elicited
from the side opposite to the lesion, but the changes were
not noticeably larger than those in the ABR elicited from
the side of the lesion.
including the monkey, consists of only four constant
vertex positive peaks (Fig. 7.29). The reason is that
the auditory nerve is much shorter in animals
used in auditory experiments than it is in humans.
This causes the travel time in the auditory nerve to be
too short to generate two clearly separated peaks in
animals. There may be other differences attributable
to the differences in the ascending auditory pathways,
mainly concerning the superior olivary complex
(see [158, 159]).
A synthesis of the results using several different
methods has provided the following general descrip-
tion of the neural generators of vertex positive
peaks of the click evoked ABR recorded between
electrodes placed on the vertex and the earlobe or
mastoid on the side where the stimulation is applied
(Fig. 7.30):
Peak
I: Distal (peripheral) portion of the auditory nerve
II: Proximal (central) portion of the auditory nerve
III: Cochlear nucleus
IV: Probably structures that are close to the midline
(superior olivary complex?)
V: Sharp vertex positive peak: The termination of
the lateral lemniscus in the inferior colliculus on
the contralateral side. The slow negative peak
(SN
10
): Dendritic potentials from the inferior
colliculus.
It seems unlikely that any structure of the auditory
system other than the auditory nerve can contribute
to peaks I and II because cochlear nucleus cells would
not fire earlier than 0.5 to 0.7 ms after the arrival of the
neural volley in the auditory nerve. Peaks I and II
are the only components that are generated by a
single structure. Later components of the ABR are
likely to receive contributions from several structures.
All structures of the ascending auditory nervous
174 Section II The Auditory Nervous System
FIGURE 7.29 ABR recorded from a rhesus monkey. Solid lines:
responses to rarefaction clicks, dashed lines: responses to condensation
clicks. The reference electrodes were placed on the shoulder. In the
mastoid and vertex recordings, negativity is shown as upward
deflections and the vertex-mastoid recording vertex positivity is
shown as a downward deflection (reprinted from Møller et al., 1986,
with permission from Elsevier).
BOX 7.9
NEURAL GENERATOR OF PEAK II AND AUDITORY NERVE LENGTH
The results of early studies of the neural generators of
the ABR in animals [23], which showed that peak II of the
cat ABR was generated in the cochlear nucleus resulted in
the erroneous assumption that also peak II of the human
ABR was generated in the cochlear nucleus. The anatomical
differences between the auditory nerve in humans and in
the animals used in such experiments were not recognized
and that caused the misinterpretation of the neural genera-
tors of the ABR in humans. The auditory nerve in humans
is approximately 2.5 cm long [125, 126] compared with
0.5–0.8 cm in the cat [59]. The auditory nerve in humans is
therefore sufficiently long to generate two well-separated
peaks in the ABR (I and II) while it generates only one peak
in the ABR in animals. The auditory nerve in humans is
longer than in small animals because humans have a larger
head and a much larger sub-arachnoidal space in the
cerebello-pontine angle than animals commonly used for
studies of the auditory system, including the monkey.
It has been shown that under favorable circumstances
two separate peaks that are generated by the auditory
nerve could be identified in the ABR of small animals
[1, 284]. The latency of the second peak was approximately
0.4 ms longer than that of peak I and it may correspond to
peak II in humans.
system other than the auditory nerve are likely to con-
tribute to more than one peak of the ABR.
It is also important to consider that not only the
vertex positive peaks are generated by specific struc-
tures of the auditory nervous system, but also the vertex
negative waves have more or less specific neural
generators [217, 329]. It is interesting to speculate what
would have happened if it had been the vertex nega-
tive waves that were labeled and attention therefore
drawn to these components instead of the vertex posi-
tive peaks.
It is not known with certainty whether the different
components of the ABR are generated by fiber tracts
(white matter) or cell bodies in nuclei (gray matter).
Both of those two kinds of structures may contribute
to far-field potentials. The fact that the auditory nerve
is the sole generator of peaks I and II shows that a
nerve can contribute to the ABR. This means that it is
also reasonable to assume that fiber tracts can generate
stationary peaks in the far field and thus contribute
to the ABR. The contribution to the ABR that has
been ascribed as coming from nuclei may in fact be
generated by fiber tracts that lead to and from the
nuclei. An example is the sharp peak of peak V, which
is generated by the termination of the LL in the IC.
Whatever structures generate the sharp peaks in the
far-field auditory potentials, their amplitude seems to
depend on how well synchronized the neural activity
is in the structure in question (nerve, fiber tracts or
nuclei). Since these sources of the ABR can be regarded
as dipoles that are oriented differently, the amplitude of
the components of the ABR that they generate depends
on the orientation of the pair of electrodes from which
the ABR is recorded.
4.2. Middle Latency Responses
The middle latency response (MLR) consists of
evoked potentials that occur in the interval between
10 and 80 ms (or 10–100 ms) after a sound stimulus.
The MLR is commonly recorded in a similar way
as the ABR, thus differentially between electrodes on
the vertex and the earlobe on the side where the
sound stimuli are applied. The different components
of the MLR are generated by more central neural
structures than the ABR, including the auditory cortex.
The MLR were first described by Geisler et al. [65],
and were later studied by many investigators such
as Picton et al. [232] and by Nina Kraus and her
co-workers [117].
The labeling of the components of the MLR is per-
haps even more confusing than what is the case for
the ABR. The most prominent components are labeled
Na, Pa, and Nb, Pb, Nc, Pc, Nd with N for negative
and P for positive waves (Fig. 7.31) [61]. The slow
negative (SN
10
) component of peak V of the ABR is
usually visible in the MLR (as Na) because the MLR is
Chapter 7 Evoked Potentials from the Nervous System 175
FIGURE 7.30 Schematic summary of the anatomical location of
the neural generators of the ABR (reprinted from Møller, 2006, with
permission from Cambridge University Press).
FIGURE 7.31 Middle latency responses (MLR) shown on a
100 ms time scale. The responses were elicited by click stimula-
tion, presented at a rate of 10 pps (reprinted from Galambos
et al., 1981).