Human Physiology: The Mechanism of Body Function - part 6 pps
Bạn đang xem bản rút gọn của tài liệu. Xem và tải ngay bản đầy đủ của tài liệu tại đây (926.5 KB, 80 trang )
Vander et al.: Human
Physiology: The
Mechanism of Body
Function, Eighth Edition
III. Coordinated Body
Functions
14. Circulation
© The McGraw−Hill
Companies, 2001
concerning different areas of the heart. The shapes
and sizes of the P wave, QRS complex, and T wave
vary with the electrode locations.
To reiterate, the ECG is not a direct record of the
changes in membrane potential across individual car-
diac muscle cells but is rather a measure of the cur-
rents generated in the extracellular fluid by the
changes occurring simultaneously in many cardiac
cells. To emphasize this point, the bottom of Figure
14–20 shows the simultaneously occurring changes
in membrane potential in a single ventricular cell.
Because many myocardial defects alter normal im-
pulse propagation, and thereby the shapes and timing
of the waves, the ECG is a powerful tool for diagnos-
ing certain types of heart disease. Figure 14–21 gives
one example. It must be emphasized, however, that the
ECG provides information concerning only the electri-
cal activity of the heart. Thus, if something is wrong
with the heart’s mechanical activity, but this defect
does not give rise to altered electrical activity, then the
ECG will not be of diagnostic value.
Excitation-Contraction Coupling
As described in Chapter 11, the mechanism that cou-
ples excitation—an action potential in the plasma
membrane of the muscle cell—and contraction is an
increase in the cell’s cytosolic calcium concentration.
As is true for skeletal muscle, the increase in cytosolic
calcium concentration in cardiac muscle is due mainly
to release of calcium from the sarcoplasmic reticulum.
This calcium combines with the regulator protein tro-
ponin, and cross-bridge formation between actin and
myosin is initiated.
But there is a difference between skeletal and car-
diac muscle in the sequence of events by which the ac-
tion potential leads to increased release of calcium
from the sarcoplasmic reticulum. In both muscle types,
the plasma-membrane action potential spreads into the
interior of muscle cells via the T tubules (the lumen of
each tubule is continuous with the extracellular fluid).
In skeletal muscle, as we saw in Chapter 11, the action
potential in the T tubules then causes the direct open-
ing of calcium channels in the sarcoplasmic reticulum
adjacent to the T tubules. In cardiac muscle (Figure
14–22): (1) The action potential in the T tubule opens
voltage-sensitive calcium channels in the T tubule
membrane itself; calcium diffuses from the extracellu-
lar fluid through these channels into the cells, causing
a small increase in cytosolic calcium concentration in
394
PART THREE Coordinated Body Functions
0.3
Time (s)
+20
–90
+1
0
P
R
T
Q
S
ECG
Potential (mV)Membrane potential (mV)
Ventricular
action potential
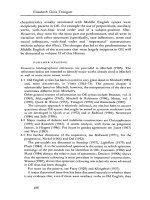
FIGURE 14–20
(Top) Typical electrocardiogram recorded from electrodes
connecting the arms. P, atrial depolarization; QRS,
ventricular depolarization; T, ventricular repolarization.
(Bottom) Ventricular action potential recorded from a single
ventricular muscle cell. Note the correspondence of the QRS
complex with depolarization and the correspondence of the
T wave with repolarization.
P
T
P
P
T
T
P
T
P
(b)
(a)
(c)
T
P
P
P
P
P
P
P
P
T
T
T
+
QRSQRS
QRS QRSQRS
T
P
P
QRS QRS QRS QRS QRS
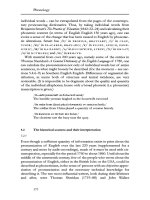
FIGURE 14–21
Electrocardiograms from a healthy person and from two
persons suffering from atrioventricular block. (a) A normal
ECG. (b) Partial block. Damage to the AV node permits only
one-half of the atrial impulses to be transmitted to the
ventricles. Note that every second P wave is not followed by
a QRS and T. (c) Complete block. There is absolutely no
synchrony between atrial and ventricular electrical activities,
and the ventricles are being driven by a pacemaker in the
bundle of His.
Vander et al.: Human
Physiology: The
Mechanism of Body
Function, Eighth Edition
III. Coordinated Body
Functions
14. Circulation
© The McGraw−Hill
Companies, 2001
the region of the T tubules and immediately adjacent
sarcoplasmic reticulum. (2) This small increase in cal-
cium concentration then causes calcium to bind to
calcium receptors on the external surface of the sar-
coplasmic reticulum membranes. (3) These calcium-
sensitive receptors contain intrinsic calcium channels,
and activation of the receptors opens the channels,
allowing a large net diffusion of calcium from the
calcium-rich interior of the sarcoplasmic reticulum
into the cytosol (this is termed “calcium-induced
calcium release”). (4) It is mainly this calcium that
causes the contraction.
Thus, even though most of the calcium causing
contraction comes from the sarcoplasmic reticulum,
the process—unlike that in skeletal muscle—is de-
pendent on the movement of extracellular calcium into
the muscle, the calcium then acting as the signal for
release of the sarcoplasmic-reticulum calcium.
Contraction ends when the cytosolic calcium con-
centration is restored to its original extremely low
value by active transport of calcium back into the
sarcoplasmic reticulum. Also, an amount of calcium
equal to the small amount that had entered the cell
from the extracellular fluid during excitation is trans-
ported out of the cell, so that the total cellular calcium
content remains constant. (The transport mechanisms
involved in these movements offer an excellent review
of key aspects of calcium transport described in Chap-
ter 6. The transport into the sarcoplasmic reticulum is
by primary active Ca-ATPase pumps; the transport
across the plasma membrane is also by Ca-ATPase
pumps plus Ca/Na exchangers.)
As we shall see, how much cytosolic calcium con-
centration increases during excitation is a major de-
terminant of the strength of cardiac-muscle contrac-
tion. In this regard, cardiac muscle differs importantly
from skeletal muscle, in which the increase in cyto-
solic calcium occurring during membrane excitation is
always adequate to produce maximal “turning-on” of
cross bridges by calcium binding to all troponin sites.
In cardiac muscle, the amount of calcium released from
the sarcoplasmic reticulum is not usually sufficient to
saturate all troponin sites. Therefore, the number of ac-
tive cross bridges and thus the strength of contraction
can be increased still further if more calcium is released
from the sarcoplasmic reticulum.
Refractory Period of the Heart
Ventricular muscle, unlike skeletal muscle, is incapable
of any significant degree of summation of contractions,
and this is a very good thing. Imagine that cardiac
muscle were able to undergo a prolonged tetanic con-
traction. During this period, no ventricular filling
could occur since filling can occur only when the ven-
tricular muscle is relaxed, and the heart would there-
fore cease to function as a pump.
The inability of the heart to generate tetanic con-
tractions is the result of the long absolute refractory
period of cardiac muscle, defined as the period dur-
ing and following an action potential when an ex-
citable membrane cannot be re-excited. As described
in Chapter 11, the absolute refractory periods of skele-
tal muscle are much shorter (1 to 2 ms) than the du-
ration of contraction (20 to 100 ms), and a second con-
traction can therefore be elicited before the first is over
(summation of contractions). In contrast, because of
the long plateau in the cardiac-muscle action potential,
the absolute refractory period of cardiac muscle lasts
almost as long as the contraction (250 ms), and the
muscle cannot be re-excited in time to produce sum-
mation (Figure 14–23).
In this and previous sections, we have presented
various similarities and differences between cardiac
and skeletal muscle. These were summarized in Table
11–6.
395
Circulation CHAPTER FOURTEEN
“Excitation”
(Depolarization of
plasma membrane)
Opening of voltage-sensitive
plasma membrane
Ca
2+
channels in T tubules
Flow of Ca
2+
into cytosol
Flow of Ca
2+
into cytosol
Ca
2+
binds to Ca
2+
receptors on
the external surface of the
sarcoplasmic reticulum
Contraction
Cytosolic Ca
2+
concentration
Multiple steps
Opening of Ca
2+
channels intrinsic
to these receptors
FIGURE 14–22
Excitation-contraction coupling in cardiac muscle.
Vander et al.: Human
Physiology: The
Mechanism of Body
Function, Eighth Edition
III. Coordinated Body
Functions
14. Circulation
© The McGraw−Hill
Companies, 2001
Mechanical Events of the
Cardiac Cycle
The orderly process of depolarization described in the
previous sections triggers a recurring cardiac cycle of
atrial and ventricular contractions and relaxations (Fig-
ure 14–24). For orientation, we shall first merely name
the parts of this cycle and their key events. Then we
shall go through the cycle again, this time describing
the pressure and volume changes that cause the events.
The cycle is divided into two major phases, both
named for events in the ventricles: the period of ven-
tricular contraction and blood ejection, systole, fol-
lowed by the period of ventricular relaxation and
blood filling, diastole. At an average heart rate of
72 beats/min, each cardiac cycle lasts approximately
0.8 s, with 0.3 s in systole and 0.5 s in diastole.
As illustrated in Figure 14–24, both systole and di-
astole can be subdivided into two discrete periods.
During the first part of systole, the ventricles are con-
tracting but all valves in the heart are closed, and so
no blood can be ejected. This period is termed isovol-
umetric ventricular contraction because the ventricu-
lar volume is constant. The ventricular walls are de-
veloping tension and squeezing on the blood they
enclose, raising the ventricular blood pressure, but be-
cause the volume of blood in the ventricles is constant
and because blood, like water, is essentially incom-
pressible, the ventricular muscle fibers cannot shorten.
Thus, isovolumetric ventricular contraction is analo-
gous to an isometric skeletal-muscle contraction: the
muscle develops tension, but does not shorten.
Once the rising pressure in the ventricles exceeds
that in the aorta and pulmonary trunk, the aortic and
pulmonary valves open, and the ventricular ejection
period of systole occurs. Blood is forced into the aorta
and pulmonary trunk as the contracting ventricular
muscle fibers shorten. The volume of blood ejected
from each ventricle during systole is termed the stroke
volume (SV).
During the first part of diastole, the ventricles be-
gin to relax, and the aortic and pulmonary valves close.
(Physiologists and clinical cardiologists do not all agree
on the dividing line between systole and diastole; as
presented here, the dividing line is the point at which
ventricular contraction stops and the pulmonary and
aortic valves close.) At this time the AV valves are also
closed. Accordingly, no blood is entering or leaving the
ventricles since once again all the valves are closed. Ac-
cordingly, ventricular volume is not changing, and this
period is termed isovolumetric ventricular relaxation.
Note then, that the only times during the cardiac cy-
cle that all valves are closed are the periods of isovol-
umetric ventricular contraction and relaxation. The AV
valves then open, and ventricular filling occurs as
blood flows in from the atria. Atrial contraction occurs
at the end of diastole, after most of the ventricular fill-
ing has taken place. This is an important point: The
ventricle receives blood throughout most of diastole,
not just when the atrium contracts. Indeed, in a per-
son at rest, approximately 80 percent of ventricular fill-
ing occurs before atrial contraction.
This completes the basic orientation. We can now
analyze, using Figure 14–25, the pressure and volume
changes that occur in the left atria, left ventricle, and
aorta during the cardiac cycle. Events on the right side
of the heart are described later. Electrical events (ECG)
and heart sounds, the latter described in a subsequent
section, are at the top of the figure so that their timing
can be correlated with phases of the cycle.
Mid-Diastole to Late Diastole
Our analysis of events in the left atrium and ventricle,
and the aorta begins at the far left of Figure 14–25 with
the events of mid-diastole to late diastole. The left
atrium and ventricle are both relaxed, but atrial pres-
sure is very slightly higher than ventricular pressure.
Because of this pressure difference, the AV valve is
open, and blood entering the atrium from the pul-
monary veins continues on into the ventricle. To reem-
phasize a point made earlier: All the valves of the heart
offer very little resistance when they are open, and so
only very small pressure differences across them are
required to produce relatively large flows. Note that at
this time—indeed, throughout all of diastole—the aor-
tic valve is closed because the aortic pressure is higher
than the ventricular pressure.
396
PART THREE Coordinated Body Functions
+20
0
–80
Membrane potential (mV)
0 150 300
Time (ms)
Refractory
period
Tension
developed
Plateau
Action
potential
FIGURE 14–23
Relationship between membrane potential changes and
contraction in a ventricular muscle cell. The refractory period
lasts almost as long as the contraction.
Vander et al.: Human
Physiology: The
Mechanism of Body
Function, Eighth Edition
III. Coordinated Body
Functions
14. Circulation
© The McGraw−Hill
Companies, 2001
397
Circulation CHAPTER FOURTEEN
Systole(a)
(b)
Blood flows out of ventricle
Atrium
relaxed
Ventricle
contracts
Ventricle contractsAtrium
relaxed
Closed
Closed Closed
Open
Diastole
Blood flows into ventricle
Atrial contraction
Atrium
contracts
Ventricle
relaxed
Open
ClosedClosed
Closed
Closed
Open
Ventricle
relaxed
Atrium
relaxed
Ventricle
relaxed
Atrium
relaxed
Aortic and
pulmonary valves:
AV valve:
Aortic and
pulmonary valves:
AV valve:
Isovolumetric ventricular contraction
Isovolumetric ventricular relaxation
Ventricular ejection
Ventricular filling
FIGURE 14–24
Divisions of the cardiac cycle: (a) systole; (b) diastole. For simplicity, only one atrium and ventricle are shown. The phases of
the cycle are identical in both halves of the heart. The direction in which the pressure difference favors flow is denoted by an
arrow; note, however, that flow, although favored by a pressure difference, will not actually occur if a valve prevents it.
Vander et al.: Human
Physiology: The
Mechanism of Body
Function, Eighth Edition
III. Coordinated Body
Functions
14. Circulation
© The McGraw−Hill
Companies, 2001
Throughout diastole, the aortic pressure is slowly
falling because blood is moving out of the arteries and
through the vascular system. In contrast, ventricular
pressure is rising slightly because blood is entering the
relaxed ventricle from the atrium, thereby expanding
the ventricular volume.
Near the end of diastole the SA node discharges,
the atrium depolarizes (as signified by the P wave of
the ECG) and contracts (note the rise in atrial pressure),
and a small volume of blood is added to the ventricle
(note the small rise in ventricular pressure and blood
volume). The amount of blood in the ventricle at the
end of diastole is called the end-diastolic volume
(EDV).
Systole
From the AV node, the wave of depolarization passes
into and through the ventricle (as signified by the QRS
complex of the ECG), and this triggers ventricular con-
traction. Remember that just before the contraction, the
aortic valve was closed and the AV valve was open.
As the ventricle contracts, ventricular pressure rises
very rapidly, and almost immediately this pressure ex-
ceeds the atrial pressure, closing the AV valve and thus
preventing backflow of blood into the atrium. Since the
aortic pressure still exceeds the ventricular pressure,
the aortic valve remains closed, and the ventricle can-
not empty despite its contraction.
398
PART THREE Coordinated Body Functions
DiastoleDiastole Systole
QRS
P T ECG
Heart sounds
Aortic pressure
Left ventricular pressure
Left ventricular volume
Position of AV Valves
Phase of cardiac cycle
Position of aortic and
pulmonary valves
Open Open
14321
Open
1 = Ventricular filling
2 = Isovolumetric ventricular contraction
3 = Ventricular ejection
4 = Isovolumetric ventricular relaxation
End-
systolic
volume
End-diastolic
volume
130
65
0
50
110
1st 2d
Pressure (mmHg)Left ventricular volume (ml)
Left atrial pressure
FIGURE 14–25
Summary of events in the left atrium, left ventricle, and aorta during the cardiac cycle.
Vander et al.: Human
Physiology: The
Mechanism of Body
Function, Eighth Edition
III. Coordinated Body
Functions
14. Circulation
© The McGraw−Hill
Companies, 2001
This brief phase of isovolumetric ventricular con-
traction ends when the rapidly rising ventricular pres-
sure exceeds aortic pressure. The aortic valve opens,
and ventricular ejection occurs. The ventricular vol-
ume curve shows that ejection is rapid at first and then
tapers off. Note that the ventricle does not empty com-
pletely. The amount of blood remaining after ejection
is called the end-systolic volume (ESV). Thus:
Stroke volume ϭ End-diastolic volume Ϫ End-systolic volume
SV EDV ESV
As shown in Figure 14–25, normal values for an adult
at rest are stroke volume ϭ 70 ml, end-diastolic vol-
ume ϭ 135 ml, and end-systolic volume ϭ 65 ml.
As blood flows into the aorta, the aortic pressure
rises along with the ventricular pressure. Throughout
ejection, only very small pressure differences exist be-
tween the ventricle and aorta because the aortic valve
opening offers little resistance to flow.
Note that peak ventricular and aortic pressures are
reached before the end of ventricular ejection; that is,
these pressures start to fall during the last part of sys-
tole despite continued ventricular contraction. This is
because the strength of ventricular contraction and rate
of blood ejection diminish during the last part of sys-
tole as shown by the ventricular volume curve. There-
fore the ejection rate becomes less than the rate at
which blood is leaving the aorta. Accordingly, the vol-
ume and therefore the pressure in the aorta begin to
decrease.
Early Diastole
Diastole begins as ventricular contraction and ejection
stop and the ventricular muscle begins to relax (recall
that the T wave of the ECG corresponds to the end of
the plateau phase of ventricular action potentials—
that is, to the onset of ventricular repolarization). Im-
mediately, the ventricular pressure falls significantly
below aortic pressure, and the aortic valve closes.
However, at this time, ventricular pressure still exceeds
atrial pressure, so that the AV valve also remains
closed. This early diastolic phase of isovolumetric ven-
tricular relaxation ends as the rapidly decreasing ven-
tricular pressure falls below atrial pressure, the AV
valve opens, and rapid ventricular filling begins.
The ventricle’s previous contraction compressed
the elastic elements of this chamber in such a way that
the ventricle actually tends to recoil outward once sys-
tole is over. This expansion, in turn, lowers ventricu-
lar pressure more rapidly than would otherwise occur
and may even create a negative (subatmospheric) pres-
sure in the ventricle, which enhances filling. Thus,
some energy is stored within the myocardium during
contraction, and its release during the subsequent re-
laxation aids filling.
The fact that ventricular filling is almost complete
during early diastole is of the greatest importance. It
ensures that filling is not seriously impaired during pe-
riods when the heart is beating very rapidly, and the
duration of diastole and therefore total filling time are
reduced. However, when rates of approximately 200
beats/min or more are reached, filling time does be-
come inadequate, and the volume of blood pumped
during each beat is decreased. The significance of this
will be described in Section F.
Early ventricular filling also explains why the con-
duction defects that eliminate the atria as effective
pumps do not seriously impair ventricular filling, at
least in otherwise normal individuals at rest. This is
true, for example, of atrial fibrillation, a state in which
the cells of the atria contract in a completely uncoor-
dinated manner and so fail to serve as effective pumps.
Thus, the atrium may be conveniently viewed as
merely a continuation of the large veins.
Pulmonary Circulation Pressures
The pressure changes in the right ventricle and pul-
monary arteries (Figure 14–26) are qualitatively simi-
lar to those just described for the left ventricle and
aorta. There are striking quantitative differences, how-
ever; typical pulmonary artery systolic and diastolic
pressures are 24 and 8 mmHg, respectively, compared
to systemic arterial pressures of 120 and 70 mmHg.
Thus, the pulmonary circulation is a low-pressure sys-
tem, for reasons to be described in a later section. This
difference is clearly reflected in the ventricular archi-
tecture, the right ventricular wall being much thinner
399
Circulation CHAPTER FOURTEEN
1 = Ventricular filling
2 = Isovolumetric ventricular contraction
3 = Ventricular ejection
4 = Isovolumetric ventricular relaxation
50
0
Pressure
(mmHg)
Time
Right ventricular
pressure
4312 1
Pulmonary artery
pressure
FIGURE 14–26
Pressures in the right ventricle and pulmonary artery during
the cardiac cycle. This figure is done on the same scale as
Figure 14–25 to facilitate comparison.
Vander et al.: Human
Physiology: The
Mechanism of Body
Function, Eighth Edition
III. Coordinated Body
Functions
14. Circulation
© The McGraw−Hill
Companies, 2001
than the left. Despite its lower pressure during con-
traction, however, the right ventricle ejects the same
amount of blood as the left over a given period of time.
In other words, the stroke volumes of the two ventri-
cles are identical.
Heart Sounds
Two sounds, termed heart sounds, stemming from car-
diac contraction are normally heard through a stetho-
scope placed on the chest wall. The first sound, a soft
low-pitched lub, is associated with closure of the AV
valves at the onset of systole and isovolumetric ven-
tricular contraction (see Figure 14–24); the second
sound, a louder dup, is associated with closure of the
pulmonary and aortic valves at the onset of diastole
and isovolumetric ventricular relaxation (see Figure
14–24). These sounds, which result from vibrations
caused by the closing valves, are perfectly normal, but
other sounds, known as heart murmurs, are frequently
a sign of heart disease.
Murmurs can be produced by blood flowing rap-
idly in the usual direction through an abnormally nar-
rowed valve (stenosis), by blood flowing backward
through a damaged, leaky valve (insufficiency), or by
blood flowing between the two atria or two ventricles
via a small hole in the wall separating them.
The exact timing and location of the murmur pro-
vide the physician with a powerful diagnostic clue.
For example, a murmur heard throughout systole sug-
gests a stenotic pulmonary or aortic valve, an insuffi-
cient AV valve, or a hole in the interventricular sep-
tum. In contrast, a murmur heard during diastole
suggests a stenotic AV valve or an insufficient pul-
monary or aortic valve.
The Cardiac Output
The volume of blood pumped by each ventricle per
minute is called the cardiac output (CO), usually ex-
pressed in liters per minute. It is also the volume of
blood flowing through either the systemic or the pul-
monary circuit per minute.
The cardiac output is determined by multiplying
the heart rate (HR)—the number of beats per minute—
and the stroke volume (SV)—the blood volume ejected
by each ventricle with each beat:
CO ϭ HR ϫ SV
Thus, if each ventricle has a rate of 72 beats/min and
ejects 70 ml of blood with each beat, the cardiac out-
put is:
CO ϭ 72 beats/min ϫ 0.07 L/beat ϭ 5.0 L/min
These values are within the normal range for a resting
average-sized adult. Since, by coincidence, total blood
volume is also approximately 5 L, this means that es-
sentially all the blood is pumped around the circuit
once each minute. During periods of strenuous exer-
cise in well-trained athletes, the cardiac output may
reach 35 L/min; that is, the entire blood volume is
pumped around the circuit seven times a minute. Even
sedentary, untrained individuals can reach cardiac out-
puts of 20–25 L/min during exercise.
The following description of the factors that alter
the two determinants of cardiac output—heart rate
and stroke volume—applies in all respects to both the
right and left heart since stroke volume and heart rate
are the same for both under steady-state conditions. It
must also be emphasized that heart rate and stroke vol-
ume do not always change in the same direction. For
example, as we shall see, stroke volume decreases fol-
lowing blood loss while heart rate increases. These
changes produce opposing effects on cardiac output.
Control of Heart Rate
Rhythmical beating of the heart at a rate of approxi-
mately 100 beats/min will occur in the complete ab-
sence of any nervous or hormonal influences on the
SA node. This is, as we have seen, the inherent au-
tonomous discharge rate of the SA node. The heart rate
may be much lower or higher than this, however, since
the SA node is normally under the constant influence
of nerves and hormones.
As mentioned earlier, a large number of parasym-
pathetic and sympathetic postganglionic fibers end on
the SA node. Activity in the parasympathetic (vagus)
nerves causes the heart rate to decrease, whereas ac-
tivity in the sympathetic nerves increases the heart rate.
In the resting state, there is considerably more parasym-
pathetic activity to the heart than sympathetic, and so
the normal resting heart rate of about 70 beats/min is
well below the inherent rate of 100 beats/min.
Figure 14–27 illustrates how sympathetic and
parasympathetic activity influences SA-node function.
Sympathetic stimulation increases the slope of the
pacemaker potential, causing the SA-node cells to
reach threshold more rapidly and the heart rate to in-
crease. Stimulation of the parasympathetics has the
opposite effect—the slope of the pacemaker potential
decreases, threshold is reached more slowly, and heart
rate decreases. Parasympathetic stimulation also hy-
perpolarizes the plasma membrane of the SA-node
cells so that the pacemaker potential starts from a more
negative value.
How do the neurotransmitters released by the au-
tonomic neurons change the slope of the potential?
They mainly influence the special set of ion channels
through which sodium ions move into the cell to cause
the diastolic depolarization. Norepinephrine, the sym-
pathetic neurotransmitter, enhances this current by
400
PART THREE Coordinated Body Functions
Vander et al.: Human
Physiology: The
Mechanism of Body
Function, Eighth Edition
III. Coordinated Body
Functions
14. Circulation
© The McGraw−Hill
Companies, 2001
opening more of these channels, whereas acetyl-
choline, the parasympathetic neurotransmitter, closes
them. [This last fact is surprising since, as described
earlier for synapses (Chapter 8) and motor endplates
(Chapter 11), the usual effect of acetylcholine is to
open, not close, channels that allow ion movement; this
should reinforce the generalization that a messenger’s
effect on its target cells is determined by the signal
transduction pathways triggered by binding of that
messenger to its receptors, pathways that can differ
from target to target.]
Factors other than the cardiac nerves can also
alter heart rate. Epinephrine, the main hormone lib-
erated from the adrenal medulla, speeds the heart
by acting on the same beta-adrenergic receptors in the
SA node as norepinephrine released from neurons.
The heart rate is also sensitive to changes in body
temperature, plasma electrolyte concentrations, hor-
mones other than epinephrine, and a metabolite—
adenosine—produced by myocardial cells. These
factors are normally of lesser importance, however,
than the cardiac nerves. Figure 14–28 summarizes the
major determinants of heart rate.
As stated in the previous section on innervation,
sympathetic and parasympathetic neurons innervate
not only the SA node but other parts of the conduct-
ing system as well. Sympathetic stimulation also in-
creases conduction velocity through the AV node,
whereas parasympathetic stimulation decreases the
rate of spread of excitation through the AV node and
other portions of the conducting system.
Control of Stroke Volume
The second variable that determines cardiac output is
stroke volume, the volume of blood ejected by each
ventricle during each contraction. As stated earlier, the
ventricles do not completely empty themselves of
blood during contraction. Therefore, a more forceful
contraction can produce an increase in stroke volume
by causing greater emptying. Changes in the force of
contraction can be produced by a variety of factors, but
three are dominant under most physiological and
pathophysiological conditions: (1) changes in the end-
diastolic volume (that is, the volume of blood in the
401
Circulation CHAPTER FOURTEEN
60
0
–40
–60
Time
Membrane potential (mV)
a, b and c
are pacemaker potentials:
a
= control
b
= during sympathetic stimulation
c
= during parasympathetic stimulation
Threshold
potential
ba
c
FIGURE 14–27
Effects of sympathetic and parasympathetic nerve
stimulation on the slope of the pacemaker potential of an
SA-nodal cell. Note that parasympathetic stimulation not
only reduces the slope of the pacemaker potential but also
causes the membrane potential to be more negative before
the pacemaker potential begins.
Adapted from Hoffman and Cranefield.
SA node
Activity of
parasympathetic
nerves to heart
Plasma epinephrine
Activity of
sympathetic
nerves to heart
Heart rate
FIGURE 14–28
Major factors that influence heart rate. All effects are exerted upon the SA node. The figure shows how heart rate is increased;
reversal of all the arrows in the boxes would illustrate how heart rate is decreased.
Vander et al.: Human
Physiology: The
Mechanism of Body
Function, Eighth Edition
III. Coordinated Body
Functions
14. Circulation
© The McGraw−Hill
Companies, 2001
ventricles just before contraction); (2) changes in the
magnitude of sympathetic nervous system input to the
ventricles; and (3) afterload (that is, the arterial pres-
sures against which the ventricles pump).
Relationship between Ventricular End-Diastolic Vol-
ume and Stroke Volume: The Frank-Starling Mech-
anism
The mechanical properties of cardiac muscle
are the basis for an inherent mechanism for altering
stroke volume: The ventricle contracts more forcefully
during systole when it has been filled to a greater de-
gree during diastole. In other words, all other factors
being equal, the stroke volume increases as the end-
diastolic volume increases, as illustrated in Figure
14–29, termed a ventricular function curve. This rela-
tionship between stroke volume and end-diastolic vol-
ume is known as the Frank-Starling mechanism (also
called Starling’s law of the heart) in recognition of the
two physiologists who identified it.
What accounts for the Frank-Starling mechanism?
Basically it is simply a length-tension relationship, as
described for skeletal muscle in Chapter 11, in that end-
diastolic volume is a major determinant of how
stretched the ventricular sarcomeres are just before
contraction. Thus, the greater the end-diastolic vol-
ume, the greater the stretch, and the more forceful the
contraction. However, a comparison of Figure 14–29
with Figure 11–25 reveals an important difference be-
tween the length-tension relationship in skeletal and
cardiac muscle. The normal point for cardiac muscle
in a resting individual is not at its optimal length for
contraction, as it is for most resting skeletal muscles,
but is on the rising phase of the curve; for this reason,
additional stretching of the cardiac-muscle fibers by
greater filling causes increased force of contraction.
The significance of the Frank-Starling mechanism
is as follows: At any given heart rate, an increase in
the venous return—the flow of blood from the veins
into the heart—automatically forces an increase in car-
diac output by increasing end-diastolic volume and
hence stroke volume. One important function of this
relationship is maintaining the equality of right and
left cardiac outputs. Should the right heart, for exam-
ple, suddenly begin to pump more blood than the left,
the increased blood flow to the left ventricle would au-
tomatically produce an increase in left ventricular out-
put. This ensures that blood will not accumulate in the
lungs.
The Sympathetic Nerves Sympathetic nerves are
distributed not only to the conducting system, as de-
scribed earlier, but to the entire myocardium. The
effect of the sympathetic mediator norepinephrine
acting on beta-adrenergic receptors is to increase
ventricular contractility, defined as the strength of
contraction at any given end-diastolic volume. Plasma
epinephrine acting on these receptors also increases
myocardial contractility. Thus, the increased force of con-
traction and stroke volume resulting from sympathetic-
nerve stimulation or epinephrine is independent of a
change in end-diastolic ventricular volume.
Note that a change in contraction force due to in-
creased end-diastolic volume (the Frank-Starling
mechanism) does not reflect increased contractility. In-
creased contractility is specifically defined as an in-
creased contraction force at any given end-diastolic
volume.
The relationship between the Frank-Starling mech-
anism and the cardiac sympathetic nerves is illustrated
in Figure 14–30. The orange ventricular function curve
402
PART THREE Coordinated Body Functions
4003002001000
Ventricular end-diastolic volume (ml)
Normal
resting
value
100
200
Stroke volume (ml)
FIGURE 14–29
A ventricular function curve, which expresses the relationship
between ventricular end-diastolic volume and stroke volume
(the Frank-Starling mechanism). The horizontal axis could
have been labeled “sarcomere length,” and the vertical
“contractile force.” In other words, this is a length-tension
curve, analogous to that for skeletal muscle (“see” Figure
11–25).
200
100
1000 200 300 400
Ventricular end-diastolic volume (ml)
Control
Sympathetic
stimulation
Normal
resting
value
Stroke volume (ml)
FIGURE 14–30
Effects on stroke volume of stimulating the sympathetic
nerves to the heart. Stroke volume is increased at any given
end-diastolic volume; that is, the sympathetic stimulation has
increased ventricular contractility.
Vander et al.: Human
Physiology: The
Mechanism of Body
Function, Eighth Edition
III. Coordinated Body
Functions
14. Circulation
© The McGraw−Hill
Companies, 2001
is the same as that shown in Figure 14–29. The blue
ventricular function curve was obtained for the same
heart during sympathetic-nerve stimulation. The
Frank-Starling mechanism still applies, but during
nerve stimulation the stroke volume is greater at any
given end-diastolic volume. In other words, the in-
creased contractility leads to a more complete ejection
of the end-diastolic ventricular volume.
One way of quantitating contractility is as the ejec-
tion fraction (EF), defined as the ratio of stroke vol-
ume (SV) to end-diastolic volume (EDV):
EF ϭ SV/EDV
Expressed as a percentage, the ejection fraction nor-
mally averages 67 percent under resting conditions.
Increased contractility causes an increased ejection
fraction.
Not only does enhanced sympathetic-nerve ac-
tivity to the myocardium cause the contraction to be
more powerful, it also causes both the contraction and
relaxation of the ventricles to occur more quickly
(Figure 14–31). These latter effects are quite impor-
tant since, as described earlier, increased sympathetic
activity to the heart also increases heart rate. As heart
rate increases, the time available for diastolic filling
decreases, but the quicker contraction and relaxation
induced simultaneously by the sympathetic neurons
partially compensate for this problem by permitting
a larger fraction of the cardiac cycle to be available
for filling.
There are multiple mechanisms by which the sig-
nal transduction pathways triggered by the binding of
norepinephrine or epinephrine to their receptors
causes increased contractility. These include: (1) open-
ing more plasma-membrane calcium channels during
excitation; (2) stimulating active calcium pumping into
the sarcoplasmic reticulum; and (3) altering the bind-
ing of calcium by troponin. The net effect of these
changes is that cytosolic calcium concentration in-
creases to a greater value during excitation (thus fa-
cilitating contraction) and then returns to its preexci-
tation value more quickly following excitation (thus
facilitating relaxation).
There is little parasympathetic innervation of the
ventricles (in contrast to the SA node, as described in
the section on control of heart rate) and so the
parasympathetic system normally has only a negligi-
ble effect on ventricular contractility.
Table 14–6 summarizes the effects of the auto-
nomic nerves on cardiac function.
Afterload An increased arterial pressure tends to re-
duce stroke volume. This is because, in analogy to the
situation in skeletal muscle (Chapter 11), the arterial
pressure constitutes the “load” (technically termed the
afterload) for contracting ventricular muscle; the
greater this load, the less the contracting muscle fibers
can shorten. This factor will not be dealt with further,
however, since in the normal heart, several inherent ad-
justments minimize the over-all influence of arterial
pressure on stroke volume. We will see, however, in
the sections on high blood pressure and heart fail-
ure that long-term elevations of arterial pressure
can weaken the heart and, thereby, influence stroke
volume.
403
Circulation CHAPTER FOURTEEN
During stimulation
of sympathetic nerves
to heart
Control
Force developed
during contraction
Time
FIGURE 14–31
Effects of sympathetic stimulation on ventricular contraction
and relaxation. Note that both the rate of force
development and the rate of relaxation are increased, as is
the maximal force developed. All these changes reflect an
increased contractility.
Area Affected Sympathetic Nerves Parasympathetic Nerves
SA node Increased heart rate Decreased heart rate
AV node Increased conduction rate Decreased conduction rate
Atrial muscle Increased contractility Decreased contractility
Ventricular muscle Increased contractility Decreased contractility (minor)
TABLE 14–6
Effects of Autonomic Nerves on the Heart
Vander et al.: Human
Physiology: The
Mechanism of Body
Function, Eighth Edition
III. Coordinated Body
Functions
14. Circulation
© The McGraw−Hill
Companies, 2001
In summary (Figure 14–32), the two most impor-
tant physiologic controllers of stroke volume are a
mechanism (the Frank-Starling mechanism) depend-
ent upon changes in end-diastolic volume, and a mech-
anism that is mediated by the cardiac sympathetic
nerves and circulating epinephrine and that causes
increased ventricular contractility. The contribution of
each of these two mechanisms in specific physiologi-
cal situations is described in later sections.
A summary of the major factors that determine car-
diac output is presented in Figure 14–33, which com-
bines the information of Figures 14–28 and 14–32.
404
PART THREE Coordinated Body Functions
End-diastolic ventricular volume
Cardiac muscle
Stroke volume
Activity of
sympathetic
nerves to heart
Plasma epinephrine
FIGURE 14–32
Major physiological controllers of stroke volume. The figure
as drawn shows how stroke volume is increased. A reversal
of all arrows in the boxes would illustrate how stroke volume
is decreased.
Cardiac muscle
Begin
End-diastolic
ventricular
volume
Plasma
epinephrine
Activity of
parasympathetic
nerves to heart
Stroke volume
SA node
Heart rate
Cardiac output
Cardiac output Stroke volume Heart rate
Activity of sympathetic
nerves to heart
=x
FIGURE 14–33
Major factors determining cardiac output
(an amalgamation of Figures 14–28 and
14–32).
Vander et al.: Human
Physiology: The
Mechanism of Body
Function, Eighth Edition
III. Coordinated Body
Functions
14. Circulation
© The McGraw−Hill
Companies, 2001
Measurement of Cardiac
Function
Cardiac output in human beings can be measured by
a variety of methods. Moreover, two- and three-
dimensional images of the heart can be obtained
throughout the entire cardiac cycle. For example, in
echocardiography, ultrasound is beamed at the heart,
and returning echoes are electronically plotted by
computer to produce continuous images of the heart.
This technique can detect abnormal functioning of car-
diac valves or contractions of the cardiac walls and can
also be used to measure ejection fraction.
Echocardiography is a “noninvasive” technique
because everything used remains external to the body.
Other visualization techniques are invasive. One, car-
diac angiography, requires the temporary threading of
a thin flexible tube (catheter) into the heart, via an ar-
tery or vein, under fluoroscopy. A dye is then injected
through the catheter during high-speed x-ray filming.
This technique is useful not only for evaluating car-
diac function but also for identifying narrowed coro-
nary arteries.
Anatomy
I. The atrioventricular (AV) valves prevent flow from
the ventricles back into the atria.
II. The pulmonary and aortic valves prevent backflow
from the pulmonary trunk into the right ventricle
and from the aorta into the left ventricle,
respectively.
III. Cardiac-muscle cells are joined by gap junctions that
permit action potentials to be conducted from cell to
cell.
IV. The myocardium also contains specialized muscle
cells that constitute the conducting system of the
heart, initiating the cardiac action potentials and
speeding their spread through the heart.
Heartbeat Coordination
I. Action potentials must be initiated in cardiac-muscle
cells for contraction to occur.
a. The rapid depolarization of the action potential in
atrial and ventricular cells (other than those in the
conducting system) is due mainly to a positive-
feedback increase in sodium permeability.
b. Following the initial rapid depolarization, the
cardiac-muscle cell membrane remains
depolarized (the plateau phase) for almost the
entire duration of the contraction because of
prolonged entry of calcium into the cell through
slow plasma-membrane channels.
SECTION C SUMMARY
II. The SA node generates the current that leads to
depolarization of all other cardiac-muscle cells.
a. The SA node manifests a pacemaker potential,
which brings its membrane potential to threshold
and initiates an action potential.
b. The impulse spreads from the SA node
throughout both atria and to the AV node, where
a small delay occurs. The impulse then passes, in
turn, into the bundle of His, right and left bundle
branches, Purkinje fibers, and nonconducting-
system ventricular fibers.
III. Calcium, mainly released from the sarcoplasmic
reticulum (SR), functions as the excitation-
contraction coupler in cardiac muscle, as in skeletal
muscle, by combining with troponin.
a. The major signal for calcium release from the SR
is extracellular calcium entering through voltage-
gated calcium channels in the T-tubular
membrane during the action potential.
b. The amount of calcium released does not usually
saturate all troponin binding sites, and so the
number of active cross bridges can be increased if
cytosolic calcium is increased still further.
IV. Cardiac muscle cannot undergo summation of
contractions because it has a very long refractory
period.
Mechanical Events of the Cardiac Cycle
I. The cardiac cycle is divided into systole (ventricular
contraction) and diastole (ventricular relaxation).
a. At the onset of systole, ventricular pressure
rapidly exceeds atrial pressure, and the AV valves
close. The aortic and pulmonary valves are not
yet open, however, and so no ejection occurs
during this isovolumetric ventricular contraction.
b. When ventricular pressures exceed aortic and
pulmonary trunk pressures, the aortic and
pulmonary valves open, and ventricular ejection
of blood occurs.
c. When the ventricles relax at the beginning of the
diastole, the ventricular pressures fall significantly
below those in the aorta and pulmonary trunk,
and the aortic and pulmonary valves close.
Because the AV valves are also still closed, no
change in ventricular volume occurs during this
isovolumetric ventricular relaxation.
d. When ventricular pressures fall below the pressures
in the right and the left atria, the AV valves open,
and the ventricular filling phase of diastole begins.
e. Filling occurs very rapidly at first so that atrial
contraction, which occurs at the very end of
diastole, usually adds only a small amount of
additional blood to the ventricles.
II. The amount of blood in the ventricles just before
systole is the end-diastolic volume. The volume
remaining after ejection is the end-systolic volume,
and the volume ejected is the stroke volume.
405
Circulation CHAPTER FOURTEEN
Vander et al.: Human
Physiology: The
Mechanism of Body
Function, Eighth Edition
III. Coordinated Body
Functions
14. Circulation
© The McGraw−Hill
Companies, 2001
III. Pressure changes in the systemic and pulmonary
circulations have similar patterns, but the pulmonary
pressures are much lower.
IV. The first heart sound is due to the closing of the AV
valves, and the second to the closing of the aortic
and pulmonary valves.
The Cardiac Output
I. The cardiac output is the volume of blood pumped
by each ventricle and equals the product of heart
rate and stroke volume.
a. Heart rate is increased by stimulation of the
sympathetic nerves to the heart and by
epinephrine; it is decreased by stimulation of the
parasympathetic nerves to the heart.
b. Stroke volume is increased mainly by an increase
in end-diastolic volume (the Frank-Starling
mechanism) and by an increase in contractility
due to sympathetic-nerve stimulation or to
epinephrine. Afterload can also play a significant
role in certain situations.
pericardium P wave
myocardium QRS complex
endothelial cell T wave
endothelium refractory period (of cardiac
atrioventricular (AV) valve muscle)
tricuspid valve cardiac cycle
mitral valve systole
papillary muscles diastole
pulmonary valve isovolumetric ventricular
aortic valve contraction
intercalated disks ventricular ejection
conducting system stroke volume (SV)
coronary artery isovolumetric ventricular
coronary blood flow relaxation
sinoatrial (SA) node ventricular filling
heart rate end-diastolic volume (EDV)
atrioventricular (AV) node end-systolic volume (ESV)
bundle of His heart sounds
right and left bundle cardiac output (CO)
branches afterload
Purkinje fibers ventricular function curve
slow channel Frank-Starling mechanism
pacemaker potential venous return
automaticity contractility
electrocardiogram (ECG) ejection fraction (EF)
SECTION C KEY TERMS
1. List the structures through which blood passes from
the systemic veins to the systemic arteries.
2. Contrast and compare the structure of cardiac
muscle with skeletal and smooth muscle.
3. Describe the autonomic innervation of the heart,
including the types of receptors involved.
4. Draw a ventricular action potential. Describe the
changes in membrane permeability that underlie the
potential changes.
5. Contrast action potentials in ventricular cells with
SA-node action potentials. What is the pacemaker
potential due to, and what is its inherent rate? By
what mechanism does the SA node function as the
pacemaker for the entire heart?
6. Describe the spread of excitation from the SA node
through the rest of the heart.
7. Draw and label a normal ECG. Relate the P, QRS,
and T waves to the atrial and ventricular action
potentials.
8. Describe the sequence of events leading to
excitation-contraction coupling in cardiac muscle.
9. What prevents the heart from undergoing
summation of contractions?
10. Draw a diagram of the pressure changes in the left
atrium, left ventricle, and aorta throughout the
cardiac cycle. Show when the valves open and close,
when the heart sounds occur, and the pattern of
ventricular ejection.
11. Contrast the pressures in the right ventricle and
pulmonary trunk with those in the left ventricle and
aorta.
12. What causes heart murmurs in diastole? In systole?
13. Write the formula relating cardiac output, heart rate,
and stroke volume; give normal values for a resting
adult.
14. Describe the effects of the sympathetic and
parasympathetic nerves on heart rate. Which is
dominant at rest?
15. What are the two major factors influencing force of
contraction?
16. Draw a ventricular function curve illustrating the
Frank-Starling mechanism.
17. Describe the effects of the sympathetic nerves on
cardiac muscle during contraction and relaxation.
18. Draw a family of curves relating end-diastolic
volume and stroke volume during different levels of
sympathetic stimulation.
19. Summarize the effects of the autonomic nerves on
the heart.
20. Draw a flow diagram summarizing the factors
determining cardiac output.
SECTION C REVIEW QUESTIONS
406
PART THREE Coordinated Body Functions
Vander et al.: Human
Physiology: The
Mechanism of Body
Function, Eighth Edition
III. Coordinated Body
Functions
14. Circulation
© The McGraw−Hill
Companies, 2001
_
The functional and structural characteristics of the
blood vessels change with successive branching. Yet
the entire cardiovascular system, from the heart to the
smallest capillary, has one structural component in
common, a smooth, single-celled layer of endothelial
cells, or endothelium, which lines the inner (blood-
contacting) surface of the vessels. Capillaries consist
only of endothelium, whereas all other vessels have,
in addition, layers of connective tissue and smooth
muscle. Endothelial cells have a large number of ac-
tive functions. These are summarized for reference in
Table 14–7 and are described in relevant sections of
this chapter or subsequent chapters.
We have previously described the pressures in the
aorta and pulmonary arteries during the cardiac cycle.
Figure 14–34 illustrates the pressure changes that oc-
cur along the rest of the systemic and pulmonary vas-
cular systems. Text sections below dealing with the in-
dividual vascular segments will describe the reasons
for these changes in pressure. For the moment, note
only that by the time the blood has completed its jour-
ney back to the atrium in each circuit, virtually all the
pressure originally generated by the ventricular con-
traction has been dissipated. The reason pressure at
any point in the vascular system is less than that at an
earlier point is that the blood vessels offer resistance
to the flow from one point to the next.
Arteries
The aorta and other systemic arteries have thick walls
containing large quantities of elastic tissue. Although
they also have smooth muscle, arteries can be viewed
most conveniently as elastic tubes. Because the arter-
ies have large radii, they serve as low-resistance tubes
conducting blood to the various organs. Their second
major function, related to their elasticity, is to act
as a “pressure reservoir” for maintaining blood flow
through the tissues during diastole, as described
below.
Arterial Blood Pressure
What are the factors determining the pressure within
an elastic container, such as a balloon filled with wa-
ter? The pressure inside the balloon depends on (1) the
volume of water, and (2) how easily the balloon walls
can be stretched. If the walls are very stretchable, large
quantities of water can be added with only a small rise
in pressure. Conversely, the addition of a small quan-
tity of water causes a large pressure rise in a balloon
that is difficult to stretch. The term used to denote how
easily a structure can be stretched is compliance:
Compliance ϭ⌬volume/⌬ pressure
The higher the compliance of a structure, the more eas-
ily it can be stretched.
407
Circulation CHAPTER FOURTEEN
THE VASCULAR SYSTEM
SECTION D
120
Diastolic
Systolic
Diastolic
Systolic
Pressure (mmHg)
Pulmonary
circulation
Systemic
circulation
Arteries
Arterioles
Capillaries
Venules
Veins
80
0
40
FIGURE 14–34
Pressures in the vascular system.
Vander et al.: Human
Physiology: The
Mechanism of Body
Function, Eighth Edition
III. Coordinated Body
Functions
14. Circulation
© The McGraw−Hill
Companies, 2001
These principles can be applied to an analysis of
arterial blood pressure. The contraction of the ventri-
cles ejects blood into the pulmonary and systemic ar-
teries during systole. If a precisely equal quantity of
blood were to flow simultaneously out of the arteries,
the total volume of blood in the arteries would remain
constant and arterial pressure would not change. Such
is not the case, however. As shown in Figure 14–35, a
volume of blood equal to only about one-third the
stroke volume leaves the arteries during systole. The
rest of the stroke volume remains in the arteries dur-
ing systole, distending them and raising the arterial
pressure. When ventricular contraction ends, the
stretched arterial walls recoil passively, like a stretched
rubber band being released, and blood continues to be
driven into the arterioles during diastole. As blood
leaves the arteries, the arterial volume and therefore
the arterial pressure slowly fall, but the next ventricu-
lar contraction occurs while there is still adequate
blood in the arteries to stretch them partially. There-
fore, the arterial pressure does not fall to zero.
The aortic pressure pattern shown in Figure
14–36a is typical of the pressure changes that occur in
all the large systemic arteries. The maximum arterial
pressure reached during peak ventricular ejection is
called systolic pressure (SP). The minimum arterial
pressure occurs just before ventricular ejection begins
and is called diastolic pressure (DP). Arterial pressure
is generally recorded as systolic/diastolic—that is,
125/75 mmHg in our example (see Figure 14–36b for
average values at different ages in the population of
the United States).
408
PART THREE Coordinated Body Functions
Aortic or pulmonary valve
Entry
from
heart
Arteries
Exit via
arterioles
Systole
Diastole
FIGURE 14–35
Movement of blood into and out of the arteries during the
cardiac cycle. The lengths of the arrows denote relative
quantities flowing into and out of the arteries and remaining
in the arteries.
1. Serve as a physical lining of heart and blood vessels to which blood cells do not normally adhere.
2. Serve as a permeability barrier for the exchange of nutrients, metabolic end products, and fluid between plasma and interstitial
fluid; regulate transport of macromolecules and other substances.
3. Secrete paracrine agents that act on adjacent vascular smooth-muscle cells; these include vasodilators—prostacyclin and nitric
oxide (endothelium-derived relaxing factor, EDRF)—and vasoconstrictors—notably endothelin-1.
4. Mediate angiogenesis (new capillary growth).
5. Play a central role in vascular remodeling by detecting signals and releasing paracrine agents that act on adjacent cells in the
blood vessel wall.
6. Contribute to the formation and maintenance of extracellular matrix (Chapter 1).
7. Produce growth factors in response to damage.
8. Secrete substances that regulate platelet clumping, clotting, and anticlotting.
9. Synthesize active hormones from inactive precursors (Chapter 16).
10. Extract or degrade hormones and other mediators (Chapter 15).
11. Secrete cytokines during immune responses (Chapter 20).
12. Influence vascular smooth-muscle proliferation in the disease atherosclerosis.
TABLE 14–7
Functions of Endothelial Cells
The difference between systolic pressure and di-
astolic pressure (125 Ϫ 75 ϭ 50 mmHg in the example)
is called the pulse pressure. It can be felt as a pulsa-
tion or throb in the arteries of the wrist or neck with
each heartbeat. During diastole, nothing is felt over the
Vander et al.: Human
Physiology: The
Mechanism of Body
Function, Eighth Edition
III. Coordinated Body
Functions
14. Circulation
© The McGraw−Hill
Companies, 2001
artery, but the rapid rise in pressure at the next systole
pushes out the artery wall, and it is this expansion of
the vessel that produces the detectable throb.
The most important factors determining the mag-
nitude of the pulse pressure—that is, how much
greater systolic pressure is than diastolic—are (1)
stroke volume, (2) speed of ejection of the stroke vol-
ume, and (3) arterial compliance. Specifically, the pulse
pressure produced by a ventricular ejection is greater
if the volume of blood ejected is increased, if the speed
at which it is ejected is increased, or if the arteries are
less compliant. This last phenomenon occurs in athero-
sclerosis, the “hardening” of the arteries that pro-
gresses with age and accounts for the increasing pulse
pressure seen so often in older people.
It is evident from Figure 14–36a that arterial pres-
sure is continuously changing throughout the cardiac
cycle. The average pressure (mean arterial pressure,
MAP) in the cycle is not merely the value halfway be-
tween systolic pressure and diastolic pressure because
diastole usually lasts longer than systole. The true
mean arterial pressure can be obtained by complex
methods, but for most purposes it is approximately
equal to the diastolic pressure plus one-third of the
pulse pressure (SP Ϫ DP), largely because diastole
lasts about twice as long as systole:
MAP ϭ DP ϩ 1/3 (SP Ϫ DP)
Thus, in our example: MAP ϭ 75 ϩ 1/3 (50) ϭ 92
mmHg.
The MAP is the most important of the pressures de-
scribed because it is the pressure driving blood into the
tissues averaged over the entire cardiac cycle. We can say
mean “arterial” pressure without specifying to which ar-
tery we are referring because the aorta and other large
arteries have such large diameters that they offer only
negligible resistance to flow, and the mean pressures are
therefore similar everywhere in the large arteries.
One additional important point should be made:
We have stated that arterial compliance is an impor-
tant determinant of pulse pressure, but for complex rea-
sons, compliance does not influence the mean arterial
pressure. Thus, for example, a person with a low arte-
rial compliance (due to atherosclerosis) but an other-
wise normal cardiovascular system will have a large
pulse pressure but a normal mean arterial pressure.
The determinants of mean arterial pressure are de-
scribed in Section E.
Measurement of Systemic Arterial Pressure
Both systolic and diastolic blood pressure are readily
measured in human beings with the use of a sphyg-
momanometer. An inflatable cuff is wrapped around
the upper arm, and a stethoscope is placed in a spot
on the arm just below the cuff and beneath which the
major artery to the lower arm runs.
The cuff is then inflated with air to a pressure
greater than systolic blood pressure (Figure 14–37).
The high pressure in the cuff is transmitted through
the tissue of the arm and completely compresses the
artery under the cuff, thereby preventing blood flow
through the artery. The air in the cuff is then slowly
released, causing the pressure in the cuff and on the
artery to drop. When cuff pressure has fallen to a value
just below the systolic pressure, the artery opens
slightly and allows blood flow for a brief time at the
peak of systole. During this interval, the blood flow
through the partially compressed artery occurs at a
very high velocity because of the small opening and
the large pressure difference across the opening. The
high-velocity blood flow is turbulent and, therefore,
produces vibrations that can be heard through the
stethoscope. Thus, the pressure, measured on the
409
Circulation CHAPTER FOURTEEN
Time
125
75
Pressure (mmHg)
(a)
200
Pressure (mmHg)
(b)
150
100
50
20 40 60 80
Age (years)
0
0
Diastolic
pressure
Systolic pressure
Aortic valve
closure
Mean pressure
Systolic pressure
Mean pressure
Diastolic pressure
FIGURE 14–36
(a) Typical arterial pressure fluctuations during the cardiac
cycle. (b) Changes in arterial pressure with age in the U.S.
population.
Adapted from Guyton.
Vander et al.: Human
Physiology: The
Mechanism of Body
Function, Eighth Edition
III. Coordinated Body
Functions
14. Circulation
© The McGraw−Hill
Companies, 2001
gauge attached to the cuff, at which sounds are first
heard as the cuff pressure is lowered is identified as
the systolic blood pressure.
As the pressure in the cuff is lowered farther, the
duration of blood flow through the artery in each cy-
cle becomes longer. When the cuff pressure reaches the
diastolic blood pressure, all sound stops because flow
is now continuous and nonturbulent through the open
artery. Thus, diastolic pressure is identified as the cuff
pressure at which sounds disappear.
It should be clear from this description that the
sounds heard during measurement of blood pressure
are not the same as the heart sounds described earlier,
which are due to closing of cardiac valves.
Arterioles
The arterioles play two major roles: (1) The arterioles
in individual organs are responsible for determining
the relative blood flows to those organs at any given
mean arterial pressure, and (2) the arterioles, as a
whole, are a major factor in determining mean arterial
pressure itself. The first function will be described in
this section, and the second in Section E.
Figure 14–38 illustrates the major principles of
blood-flow distribution in terms of a simple model, a
fluid-filled tank with a series of compressible outflow
tubes. What determines the rate of flow through each
exit tube? As stated in Section B of this chapter,
F ϭ⌬P/R
Since the driving pressure (the height of the fluid col-
umn in the tank) is identical for each tube, differences
in flow are completely determined by differences in
the resistance to flow offered by each tube. The lengths
of the tubes are approximately the same, and the vis-
cosity of the fluid is constant; therefore, differences in
resistance offered by the tubes are due solely to dif-
ferences in their radii. Obviously, the widest tubes have
the greatest flows. If we equip each outflow tube with
an adjustable cuff, we can obtain various combinations
of flows.
This analysis can now be applied to the cardio-
vascular system. The tank is analogous to the arteries,
which serve as a pressure reservoir, the major arteries
themselves being so large that they contribute little re-
sistance to flow. Therefore, all the large arteries of the
body can be considered a single pressure reservoir.
The arteries branch within each organ into pro-
gressively smaller arteries, which then branch into ar-
terioles. The smallest arteries are narrow enough to of-
fer significant resistance to flow, but the still narrower
arterioles are the major sites of resistance in the vas-
cular tree and are therefore analogous to the outflow
tubes in the model. This explains the large decrease in
410
PART THREE Coordinated Body Functions
No sound; cuff
pressure above
systolic pressure;
artery completely
occluded during
cycle
Cuff pressure
just below
systolic pressure;
first sounds heard;
soft, tapping, and
intermittent
Sounds loud,
tapping, and
intermittent
Low muffled
sound lasting
continuously
Cuff pressure
below diastolic
pressure; thus
vessel is always
open; no turbulence,
no sound
Time
120
80
Pressure (mmHg)
(c) (d)
(e)
(b)
(a)
Cuff pressure
Arterial pressure
Period of turbulent
flow through
constricted vessel
FIGURE 14–37
Sounds heard through a stethoscope while the cuff pressure of a sphygmomanometer is gradually lowered. Sounds are first
heard at systolic pressure, and they disappear at diastolic pressure.
Vander et al.: Human
Physiology: The
Mechanism of Body
Function, Eighth Edition
III. Coordinated Body
Functions
14. Circulation
© The McGraw−Hill
Companies, 2001
mean pressure—from about 90 mmHg to 35 mmHg—
as blood flows through the arterioles (see Figure
14–34). Pulse pressure also diminishes to the point that
flow beyond the arterioles—that is, through capillar-
ies, venules, and veins—is much less pulsatile.
Like the model’s outflow tubes (Figure 14–38), the
arteriolar radii in individual organs are subject to in-
dependent adjustment. The blood flow through any
organ is given by the following equation:
F
organ
ϭ (MAP Ϫ venous pressure)/Resistance
organ
Since venous pressure is normally approximately zero,
we may write:
F
organ
ϭ MAP/Resistance
organ
Since the MAP, the driving force for flow through each
organ, is identical throughout the body, differences in
flows between organs depend entirely on the relative
resistances offered by the arterioles of each organ. Ar-
terioles contain smooth muscle, which can either relax
and cause the vessel radius to increase (vasodilation)
or contract and decrease the vessel radius (vasocon-
striction). Thus the pattern of blood-flow distribution
depends upon the degree of arteriolar smooth-muscle
contraction within each organ and tissue. Look back at
Figure 14–9, which illustrates the distribution of blood
flows at rest; these are due to differing resistances in
the various locations. Such distribution can be changed
markedly, as during exercise, for example, by chang-
ing the various resistances.
How can resistance be changed? Arteriolar smooth
muscle possesses a large degree of spontaneous activ-
ity (that is, contraction independent of any neural,
hormonal, or paracrine input). This spontaneous con-
tractile activity is called intrinsic tone (also termed
basal tone). It sets a baseline level of contraction that
can be increased or decreased by external signals, such
as neurotransmitters. These signals act by inducing
changes in the muscle cells’s cytosolic calcium concen-
tration (see Chapter 11 for a description of excitation-
contraction coupling in smooth muscle). An increase
in contractile force above the vessel’s intrinsic tone
causes vasoconstriction, whereas a decrease in con-
tractile force causes vasodilation. The mechanisms
controlling vasoconstriction and vasodilation in arte-
rioles fall into two general categories: (1) local controls,
and (2) extrinsic (or reflex) controls.
Local Controls
The term local controls denotes mechanisms inde-
pendent of nerves or hormones by which organs and
tissues alter their own arteriolar resistances, thereby
self-regulating their blood flows. It does include
changes caused by autocrine/paracrine agents. This
self-regulation includes the phenomena of active hy-
peremia, flow autoregulation, reactive hyperemia, and
local response to injury.
Active Hyperemia Most organs and tissues manifest
an increased blood flow (hyperemia) when their meta-
bolic activity is increased (Figure 14–39a); this is
termed active hyperemia. For example, the blood flow
to exercising skeletal muscle increases in direct pro-
portion to the increased activity of the muscle. Active
hyperemia is the direct result of arteriolar dilation in
the more active organ or tissue.
411
Circulation CHAPTER FOURTEEN
(a)
12345
(b)
12345
Pressure reservoir
(“arteries”)
Variable-resistance
outflow tubes
(“arterioles”)
Flow to “organs”
1,2,3,4, and 5
P
FIGURE 14–38
Physical model of the relationship between arterial pressure, arteriolar radius in different organs, and blood-flow distribution.
In (a), blood flow is high through tube 2 and low through tube 3, whereas just the opposite is true for (b). This shift in blood
flow was achieved by constricting tube 2 and dilating tube 3.
Vander et al.: Human
Physiology: The
Mechanism of Body
Function, Eighth Edition
III. Coordinated Body
Functions
14. Circulation
© The McGraw−Hill
Companies, 2001
The factors acting upon arteriolar smooth muscle
in active hyperemia to cause it to relax are local chem-
ical changes in the extracellular fluid surrounding the
arterioles. These result from the increased metabolic
activity in the cells near the arterioles. The relative con-
tributions of the various factors implicated vary, de-
pending upon the organs involved and on the dura-
tion of the increased activity. Therefore, we shall name
but not quantify some of these local chemical changes
that occur in the extracellular fluid: decreased oxygen
concentration; increased concentrations of carbon
dioxide, hydrogen ion, the metabolite adenosine,
potassium (as a result of enhanced potassium move-
ment out of muscle cells during the more frequent ac-
tion potentials) and eicosanoids (Chapter 7); increased
osmolarity (resulting from the increased breakdown of
high-molecular-weight substances); and, in some
glands, increased concentration of a peptide known as
bradykinin. The last substance is generated locally
from a circulating protein called kininogen by the ac-
tion of an enzyme, kallikrein, secreted by the active
gland cells.
Local changes in all these chemical factors have
been shown to cause arteriolar dilation under con-
trolled experimental conditions, and they all probably
contribute to the active-hyperemia response in one or
more organs. It is likely, moreover, that additional im-
portant local factors remain to be discovered. It must
be emphasized that all these chemical changes in the
extracellular fluid act locally upon the arteriolar
smooth muscle, causing it to relax. No nerves or hor-
mones are involved.
It should not be too surprising that active hyper-
emia is most highly developed in skeletal muscle, car-
diac muscle, and glands, tissues that show the widest
range of normal metabolic activities in the body. It is
highly efficient, therefore, that their supply of blood be
primarily determined locally.
Flow Autoregulation During active hyperemia, in-
creased metabolic activity of the tissue or organ is the
initial event leading to local vasodilation. However, lo-
cally mediated changes in arteriolar resistance can oc-
cur when a tissue or organ suffers a change in its blood
supply resulting from a change in blood pressure (Fig-
ure 14–39b). The change in resistance is in the direc-
tion of maintaining blood flow nearly constant in the
face of the pressure change and is therefore termed
flow autoregulation. For example, when arterial pres-
sure in an organ is reduced, say, because of a partial
occlusion in the artery supplying the organ, local con-
trols cause arteriolar vasodilation, which tends to
maintain flow relatively constant.
What is the mechanism of flow autoregulation?
One mechanism is the same metabolic factors de-
scribed for active hyperemia. When an arterial pres-
sure reduction lowers blood flow to an organ, the sup-
ply of oxygen to the organ is diminished, and the local
extracellular oxygen concentration decreases. Simulta-
neously, the extracellular concentrations of carbon
dioxide, hydrogen ion, and metabolites all increase be-
cause they are not removed by the blood as fast as they
are produced. Also, eicosanoid synthesis is increased
by still unclear stimuli. Thus, the local metabolic
412
PART THREE Coordinated Body Functions
Active Hyperemia
Flow autoregulation
Metabolic
activity
of organ
Begin
Begin
metabolites
in organ
interstitial fluid
O
2
, Arteriolar
dilation
in organ
Blood flow
to organ
Blood flow
to organ
Arteriolar
dilation
in organ
Arterial
pressure
in organ
Restoration
of blood
flow toward
normal
in organ
metabolites,
vessel-wall
stretch
in organ
O
2
,
(a)
(b)
FIGURE 14–39
Local control of organ blood flow in response to (a) increases in metabolic activity, and (b) decreases in blood pressure.
Decreases in metabolic activity or increases in blood pressure would produce changes opposite those shown here.
Vander et al.: Human
Physiology: The
Mechanism of Body
Function, Eighth Edition
III. Coordinated Body
Functions
14. Circulation
© The McGraw−Hill
Companies, 2001
changes occurring during decreased blood supply at
constant metabolic activity are similar to those that oc-
cur during increased metabolic activity. This is because
both situations reflect an initial imbalance between
blood supply and level of cellular metabolic activity.
Note then that the vasodilations of active hyperemia
and of flow autoregulation in response to low arterial
pressure do not differ in their major mechanisms,
which involve local metabolic factors, but in the
event—altered metabolism or altered blood
pressure—that brings these mechanisms into play.
Flow autoregulation is not limited to circum-
stances in which arterial pressure decreases. The op-
posite events occur when, for various reasons, arterial
pressure increases: The initial increase in flow due to
the increase in pressure removes the local vasodilator
chemical factors faster than they are produced and also
increases the local concentration of oxygen. This causes
the arterioles to constrict, thereby maintaining local
flow relatively constant in the face of the increased
pressure.
Although our description has emphasized the role
of local chemical factors in flow autoregulation, it
should be noted that another mechanism also partici-
pates in this phenomenon in certain tissues and organs.
Some arteriolar smooth muscle responds directly to in-
creased stretch, caused by increased arterial pressure,
by contracting to a greater extent. Conversely, de-
creased stretch, due to decreased arterial pressure,
causes this vascular smooth muscle to decrease its
tone. These direct responses of arteriolar smooth mus-
cle to stretch are termed myogenic responses. They
are due to changes in calcium movement into the
smooth-muscle cells through stretch-sensitive calcium
channels in the plasma membrane.
Reactive Hyperemia When an organ or tissue has
had its blood supply completely occluded, a profound
transient increase in its blood flow occurs as soon as
the occlusion is released. This phenomenon, known as
reactive hyperemia, is essentially an extreme form of
flow autoregulation. During the period of no blood
flow, the arterioles in the affected organ or tissue di-
late, owing to the local factors described above. Blood
flow, therefore, is very great through these wide-open
arterioles as soon as the occlusion to arterial inflow is
removed.
Response to Injury Tissue injury causes a variety of
substances to be released locally from cells or gener-
ated from plasma precursors. These substances make
arteriolar smooth muscle relax and cause vasodilation
in an injured area. This phenomenon, a part of the gen-
eral process known as inflammation, will be described
in detail in Chapter 20.
Extrinsic Controls
Sympathetic Nerves Most arterioles receive a rich
supply of sympathetic postganglionic nerve fibers.
These neurons release mainly norepinephrine, which
binds to alpha-adrenergic receptors on the vascular
smooth muscle to cause vasoconstriction.
In contrast, recall that the receptors for norepi-
nephrine on heart muscle, including the conducting
system, are mainly beta-adrenergic. This permits the
pharmacologic use of beta-adrenergic antagonists to
block the actions of norepinephrine on the heart but
not the arterioles, and vice versa for alpha-adrenergic
antagonists.
Control of the sympathetic nerves to arterioles can
also be used to produce vasodilation. Since the sympa-
thetic nerves are seldom completely quiescent but dis-
charge at some finite rate that varies from organ to or-
gan, they always are causing some degree of tonic
constriction in addition to the vessels’ intrinsic tone.
Dilation can be achieved by decreasing the rate of sym-
pathetic activity below this basal level.
The skin offers an excellent example of the role of
the sympathetic nerves. At room temperature, skin ar-
terioles are already under the influence of a moderate
rate of sympathetic discharge. An appropriate stimu-
lus—cold, fear, or loss of blood, for example—causes
reflex enhancement of this sympathetic discharge, and
the arterioles constrict further. In contrast, an increased
body temperature reflexly inhibits the sympathetic
nerves to the skin, the arterioles dilate, and the skin
flushes.
In contrast to active hyperemia and flow autoreg-
ulation, the primary functions of sympathetic nerves
to blood vessels are concerned not with the coordina-
tion of local metabolic needs and blood flow but with
reflexes that serve whole body “needs.” The most com-
mon reflex employing these nerves, as we shall see, is
that which regulates arterial blood pressure by influ-
encing arteriolar resistance throughout the body. Other
reflexes redistribute blood flow to achieve a specific
function (for example, to increase heat loss from the
skin).
Parasympathetic Nerves With few exceptions, there
is little or no important parasympathetic innervation
of arterioles. In other words, the great majority of
blood vessels receive sympathetic but not parasympa-
thetic input.
Noncholinergic, Nonadrenergic Autonomic Neu-
rons
As described in Chapter 8, there is a population
of autonomic postganglionic neurons that are labeled
noncholinergic, nonadrenergic neurons because they
release neither acetylcholine nor norepinephrine. In-
stead they release nitric oxide, which is a vasodilator,
413
Circulation CHAPTER FOURTEEN
Vander et al.: Human
Physiology: The
Mechanism of Body
Function, Eighth Edition
III. Coordinated Body
Functions
14. Circulation
© The McGraw−Hill
Companies, 2001
and, possibly, other noncholinergic vasodilator sub-
stances. These neurons are particularly prominent in
the enteric nervous system, which plays a significant
role in the control of the gastrointestinal system’s blood
vessels (Chapter 17). These neurons also innervate ar-
terioles in certain other locations, for example, in the
penis, where they mediate erection (Chapter 19).
Hormones Epinephrine, like norepinephrine re-
leased from sympathetic nerves, can bind to alpha-
adrenergic receptors on arteriolar smooth muscle and
cause vasoconstriction. The story is more complex,
however, because many arteriolar smooth-muscle cells
possess beta-adrenergic receptors as well as alpha-
adrenergic receptors, and the binding of epinephrine
to these beta-adrenergic receptors causes the muscle
cells to relax rather than contract (Figure 14–40).
In most vascular beds, the existence of beta-
adrenergic receptors on vascular smooth muscle is of
little if any importance since they are greatly outnum-
bered by the alpha-adrenergic receptors. The arterioles
in skeletal muscle are an important exception, how-
ever. Because they have a large number of beta-
adrenergic receptors, circulating epinephrine usually
causes vasodilation in this vascular bed.
Another hormone important for arteriolar control
is angiotensin II, which constricts most arterioles. This
peptide is part of the renin-angiotensin system (Chap-
ter 16).
Yet another important hormone that, when pres-
ent at high plasma concentrations, causes arteriolar
constriction is vasopressin, which is released into the
blood by the posterior pituitary gland (Chapter 10).
The functions of vasopressin will be described more
fully in Chapter 16.
Finally, the hormone secreted by the cardiac
atria—atrial natriuretic factor—is a potent vasodila-
tor. Whether this hormone, whose actions on the kid-
neys are described in Chapter 16, plays a widespread
physiologic role in control of arterioles is unsettled.
Endothelial Cells and Vascular Smooth Muscle
It should be clear from the previous sections that a
large number of substances can induce the contraction
or relaxation of vascular smooth muscle. Many of these
substances do so by acting directly on the arteriolar
smooth muscle, but others act indirectly via the en-
dothelial cells adjacent to the smooth muscle. En-
dothelial cells, in response to these latter substances as
well as certain mechanical stimuli, secrete several
paracrine agents that diffuse to the adjacent vascular
smooth muscle and induce either relaxation or con-
traction, resulting in vasodilation or vasoconstriction,
respectively.
414
PART THREE Coordinated Body Functions
Norepinephrine in extracellular fluid
Plasma epinephrine
Release norepinephrine
Secretes epinephrine
into blood
Altered arteriolar radius
α
β
(Causes
vasoconstriction)
(Causes
vasodilation)
Sympathetic postganglionic
neurons to skeletal muscle arterioles
Smooth muscle in skeletal muscle arterioles
Adrenal medulla
FIGURE 14–40
Effects of sympathetic nerves and plasma epinephrine on the arterioles in skeletal muscle. After its release from neuron
terminals, norepinephrine diffuses to the arterioles, whereas epinephrine, a hormone, is blood-borne. Note that activation of
alpha-adrenergic receptors and beta-adrenergic receptors produces opposing effects. For simplicity, norepinephrine is shown
binding only to alpha-adrenergic receptors; it can also bind to beta-adrenergic receptors on the arterioles, but this occurs
to a lesser extent.
Vander et al.: Human
Physiology: The
Mechanism of Body
Function, Eighth Edition
III. Coordinated Body
Functions
14. Circulation
© The McGraw−Hill
Companies, 2001
One very important paracrine vasodilator released
by endothelial cells is nitric oxide; note that we are
dealing here with nitric oxide released from endothe-
lial cells, not nerve endings as described in an earlier
section. [Before the identity of the vasodilator
paracrine agent released by the endothelium was de-
termined to be nitric oxide, it was called endothelium-
derived relaxing factor (EDRF), and this name is still
often used because there may be substances other than
nitric oxide that also fit this general definition.] Nitric
oxide is released continuously in significant amounts
by endothelial cells in the arterioles and contributes to
arteriolar vasodilation in the basal state. In addition,
its secretion is rapidly and markedly increased in re-
sponse to a large number of the chemical mediators
involved in both reflex and local control of arterioles.
For example, nitric oxide release is stimulated by
bradykinin and histamine, substances produced lo-
cally during inflammation (Chapter 20).
Another vasodilator released by endothelial cells is
the eicosanoid prostacyclin (PGI
2
). Unlike the case for
nitric oxide, there is little basal secretion of PGI
2
, but se-
cretion can increase markedly in response to various in-
puts. The roles of PGI
2
in the vascular responses to blood
clotting are described in Section G of this chapter.
One of the important vasoconstrictor paracrine
agents released by endothelial cells in response to cer-
tain mechanical and chemical stimuli is endothelin-1
(ET-1). ET-1 is a member of the endothelin family
of peptide paracrine agents secreted by a variety
of cells in diverse tissues, including the brain, kid-
neys, and lungs. Not only does ET-1 serve as a
paracrine agent but under certain circumstances it can
also achieve high enough concentrations in the blood
to serve as a hormone, causing widespread arteriolar
vasoconstriction.
This discussion has so far focused only on arteri-
oles. However, endothelial cells in arteries can also se-
crete various paracrine agents that influence the arter-
ies’ smooth muscle and, hence, their diameters and
resistances to flow. The force exerted on the inner sur-
face of the arterial wall, specifically on the endothelial
cells, by the flowing blood is termed shear stress; it in-
creases as the blood flow through the vessel increases.
In response to this increased shear stress, arterial en-
dothelium releases PGI
2
, increased amounts of nitric
oxide, and less ET-1. All these changes cause the arte-
rial vascular smooth muscle to relax and the artery to
dilate. This flow-induced arterial vasodilation (which
should be distinguished from arteriolar flow autoregu-
lation) may be important in remodeling of arteries and
in optimizing the blood supply to tissues under cer-
tain conditions.
Arteriolar Control in Specific Organs
Figure 14–41 summarizes the factors that determine
arteriolar radius. The importance of local and reflex
controls varies from organ to organ, and Table 14–8
lists for reference the key features of arteriolar control
in specific organs.
415
Circulation CHAPTER FOURTEEN
Arteriolar smooth muscle
Altered arteriolar radius
Vasoconstrictors
Sympathetic nerves
Vasodilators
Neurons that release
nitric oxide
Vasoconstrictors
Epinephrine
Angiotensin II
Vasopressin
Vasodilators
Epinephrine
Atrial natriuretic
hormone
Vasoconstrictors
Internal blood pressure
(myogenic response)
Endothelin-1
Vasodilators
Oxygen
K
+
, CO
2
, H
+
Osmolarity
Adenosine
Eicosanoids
Bradykinin
Substances released
during injury
Nitric oxide
Neural controls Hormonal controls Local controls
FIGURE 14–41
Major factors affecting
arteriolar radius. Note
that epinephrine can be
a vasodilator or
vasoconstrictor,
depending on the tissue.
Vander et al.: Human
Physiology: The
Mechanism of Body
Function, Eighth Edition
III. Coordinated Body
Functions
14. Circulation
© The McGraw−Hill
Companies, 2001
Capillaries
As mentioned at the beginning of Section B, at any
given moment, approximately 5 percent of the total cir-
culating blood is flowing through the capillaries, and
it is this 5 percent that is performing the ultimate func-
tion of the entire cardiovascular system—the exchange
of nutrients and metabolic end products. Some ex-
change also occurs in the venules, which can be viewed
as extensions of capillaries.
The capillaries permeate almost every tissue of the
body. Since most cells are no more than 0.1 mm (only
a few cell widths) from a capillary, diffusion distances
are very small, and exchange is highly efficient. There
are an estimated 25,000 miles of capillaries in an adult,
each individual capillary being only about 1 mm long
with an inner diameter of 5 m, just wide enough for
an erythrocyte to squeeze through. (For comparison, a
human hair is about 100 m in diameter.)
The essential role of capillaries in tissue function
has stimulated many questions concerning how capil-
laries develop and grow (angiogenesis). For example,
what turns on angiogenesis during wound healing and
how do cancers stimulate growth of the new capillar-
ies required for continued cancer growth? It is known
that the vascular endothelial cells play a central role in
the building of a new capillary network by cell loco-
motion and cell division. They are stimulated to do so
416
PART THREE Coordinated Body Functions
Heart
High intrinsic tone; oxygen extraction is very high at rest, and so flow must increase when oxygen consumption increases if
adequate oxygen supply is to be maintained.
Controlled mainly by local metabolic factors, particularly adenosine, and flow autoregulation; direct sympathetic influences are
minor and normally overridden by local factors.
Vessels are compressed during systole, and so coronary flow occurs mainly during diastole.
Skeletal Muscle
Controlled by local metabolic factors during exercise.
Sympathetic nerves cause vasoconstriction (mediated by alpha-adrenergic receptors) in reflex response to decreased arterial
pressure.
Epinephrine causes vasodilation, via beta-adrenergic receptors, when present in low concentration and vasoconstriction, via alpha-
adrenergic receptors, when present in high concentration.
GI Tract, Spleen, Pancreas, and Liver (“Splanchnic Organs”)
Actually two capillary beds partially in series with each other; blood from the capillaries of the GI tract, spleen, and pancreas flows
via the portal vein to the liver. In addition, the liver also receives a separate arterial blood supply.
Sympathetic nerves cause vasoconstriction, mediated by alpha-adrenergic receptors, in reflex response to decreased arterial
pressure and during stress. In addition, venous constriction causes displacement of a large volume of blood from the liver to
the veins of the thorax.
Increased blood flow occurs following ingestion of a meal and is mediated by local metabolic factors, neurons, and hormones
secreted by the GI tract.
Kidneys
Flow autoregulation is a major factor.
Sympathetic nerves cause vasoconstriction, mediated by alpha-adrenergic receptors, in reflex response to decreased arterial
pressure and during stress. Angiotensin II is also a major vasoconstrictor. These reflexes help conserve sodium and water.
Brain
Excellent flow autoregulation.
Distribution of blood within the brain is controlled by local metabolic factors.
Vasodilation occurs in response to increased concentration of carbon dioxide in arterial blood.
Influenced relatively little by the autonomic nervous system.
Skin
Controlled mainly by sympathetic nerves, mediated by alpha-adrenergic receptors; reflex vasoconstriction occurs in response to
decreased arterial pressure and cold, whereas vasodilation occurs in response to heat.
Substances released from sweat glands and noncholinergic, nonadrenergic neurons also cause vasodilation.
Venous plexus contains large volumes of blood, which contributes to skin color.
Lungs
Very low resistance compared to systemic circulation.
Controlled mainly by gravitational forces and passive physical forces within the lung.
Constriction, mediated by local factors, occurs in response to low oxygen concentration—just opposite that which occurs in the
systemic circulation.
TABLE 14–8
Reference Summary of Arteriolar Control in Specific Organs
Vander et al.: Human
Physiology: The
Mechanism of Body
Function, Eighth Edition
III. Coordinated Body
Functions
14. Circulation
© The McGraw−Hill
Companies, 2001
by a variety of angiogenic factors [for example, vas-
cular endothelial growth factor (VEGF)] secreted lo-
cally by various tissue cells (fibroblasts, for example)
and the endothelial cells themselves. Cancer cells also
secrete angiogenic factors, and development of drugs
to interfere with the secretion or action of these factors
is a promising research area in anticancer therapy. For
example, substances that inhibit blood-vessel growth
have been found to reduce the size of almost any tu-
mor (or eliminate the tumor completely) in mice; these
agents are presently being studied in people with
cancer.
Anatomy of the Capillary Network
Capillary structure varies considerably from organ to
organ, but the typical capillary (Figure 14–42) is a thin-
walled tube of endothelial cells one layer thick resting
on a basement membrane, without any surrounding
smooth muscle or elastic tissue. Capillaries in several
organs (for example, the brain) have a second set of
cells that adhere to the opposite side of the basement
membrane and influence the ability of substances to
penetrate the capillary wall.
The flat cells that constitute the endothelial tube
are not attached tightly to each other but are separated
by narrow water-filled spaces termed intercellular
clefts. The endothelial cells generally contain large
numbers of endocytotic and exocytotic vesicles, and
sometimes these fuse to form continuous fused-
vesicle channels across the cell (Figure 14–42).
Blood flow through capillaries depends very much
on the state of the other vessels that constitute the mi-
crocirculation (Figure 14–43). Thus, vasodilation of the
arterioles supplying the capillaries causes increased
capillary flow, whereas arteriolar vasoconstriction re-
duces capillary flow.
In addition, in some tissues and organs, blood does
not enter capillaries directly from arterioles but from
vessels called metarterioles, which connect arterioles
to venules. Metarterioles, like arterioles, contain scat-
tered smooth-muscle cells. The site at which a capil-
lary exits from a metarteriole is surrounded by a ring
of smooth muscle, the precapillary sphincter, which
relaxes or contracts in response to local metabolic fac-
tors. When contracted, the precapillary sphincter
closes the entry to the capillary completely. The more
active the tissue, the more precapillary sphincters are
open at any moment and the more capillaries in
the network are receiving blood. Precapillary sphinc-
ters may also exist at the site of capillary exit from
arterioles.
Velocity of Capillary Blood Flow
Figure 14–44 illustrates a simple mechanical model of
a series of 1-cm-diameter balls being pushed down a
single tube that branches into narrower tubes. Al-
though each tributary tube has a smaller cross section
than the wide tube, the sum of the tributary cross sec-
tions is three times greater than that of the wide tube.
Let us assume that in the wide tube each ball moves
3 cm/min. If the balls are 1 cm in diameter and they
move two abreast, six balls leave the wide tube per
minute and enter the narrow tubes, and six balls leave
the narrow tubes per minute. At what speed does each
ball move in the small tubes? The answer is 1 cm/min.
This example illustrates the following important
principle: When a continuous stream moves through
consecutive sets of tubes, the velocity of flow decreases
as the sum of the cross-sectional areas of the tubes in-
creases. This is precisely the case in the cardiovascular
system (Figure 14–45). The blood velocity is very great
in the aorta, slows progressively in the arteries and ar-
terioles, and then slows markedly as the blood passes
through the huge cross-sectional area of the capillar-
ies. The velocity of flow then progressively increases
in the venules and veins because the cross-sectional
area decreases. To reemphasize, flow velocity is not de-
pendent on proximity to the heart but rather on total
cross-sectional area of the vessel type.
The huge cross-sectional area of the capillaries
accounts for another important feature of capillaries:
417
Circulation CHAPTER FOURTEEN
Basement
membrane
Endothelial cell 1
Endothelial cell 2
Capillary
lumen
Intercellular
cleft
Fused-vesicle
channel
Nucleus
Exocytotic
vesicles
FIGURE 14–42
Capillary cross section. There are two endothelial cells in the
figure, but the nucleus of only one is seen because the other
is out of the plane of section. The fused-vesicle channel is
part of endothelial cell 2.
Adapted from Lentz.