COMPOST UTILIZATION in HORTICULTURAL CROPPING SYSTEMS - SECTION 4 docx
Bạn đang xem bản rút gọn của tài liệu. Xem và tải ngay bản đầy đủ của tài liệu tại đây (805.88 KB, 77 trang )
S
ECTION
IV
Potential Hazards, Precautions, and
Regulations of Compost Production
and Utilization
© 2001 by CRC Press LLC
CHAPTER
16
Heavy Metal Aspects of Compost Use
Rufus L. Chaney, James A. Ryan, Urszula Kukier, Sally L. Brown,
Grzegorz Siebielec, Minnie Malik, and J. Scott Angle
CONTENTS
I. Introduction
A. Industrial Pretreatment Improves Quality of Biosolids
and Composts
B. Nutrient Supply from Biosolids and Composts
C. Defining High-Quality Biosolids and Composts for
Sustainable Use
II. Risk Assessment Methodology for Contaminants in Beneficially
Used Biosolids and Composts
A. Pathway Risk Assessment Used for the U.S. EPA
Section 503 Rule
B. U.S. Limits on Contaminants in Biosolids and Composts
C. Hidden Safety Factors in Pathway Calculations
D. Phytotoxicity of Trace Elements
E. Phytoavailability of Applied Trace Elements over Time
F. Labels May Confuse Risk Communication
G. Soil Cadmium Risk to Humans
H. Food Consumption Rates vs. Cadmium Risk Potential
I. Are Soil Microbes Protected by the U.S. EPA Section 503 Rule?
J. Using the U.S. EPA Section 503 Biosolids Limits for Other
Composts and Organic Amendments
III. Some Future Directions for Composts and Biosolids in Agriculture
A. Remediation of Metal Toxic Soils Using Composts
and Biosolids
© 2001 by CRC Press LLC
B. Lime-Induced Manganese Deficiency
IV. Summary
References
I. INTRODUCTION
Composts prepared from municipal solid waste (MSW), biosolids (municipal
sewage sludge), food processing wastes, manures, yard debris, and agricultural
byproducts and residues are increasingly available for agricultural use. Utilization
of composts as fertilizers and soil conditioners provides benefits from nutrients, from
organic matter, from biodegradation of organic matter, and from organisms in the
composts. Remarkable benefits have been identified in new approaches for control
of plant diseases by use of composts in media or in field plantings, and in revegetation
of disturbed soils and mine wastes. Production of composts provides an important
cost saving to cities, industries, and agricultural users, and allows recycling for
beneficial use of more of society’s discards. Although some compost products
continue to be poorly manufactured, scientists have discovered improved manufac-
turing methods, methods to monitor or evaluate composts inexpensively, and criteria
for quality control of compost products. Because production of composts will offer
large cost savings to both urban and agricultural areas, such composts will be
available at relatively low cost to horticultural industries for use as fertilizers, soil
conditioners, and when prepared properly, potting media components.
Although many benefits are possible from use of composts, these products must
be safe for sustainable agriculture for their use to be permitted by governments.
These products also must reliably supply nutrient and organic matter benefits to
become competitive in the marketplace. The potential presence of pathogenic organ-
isms, heavy metals/trace elements, potentially toxic synthetic organic compounds
(compounds that are not normally biosynthesized are referred to as “xenobiotic”
compounds), and possible element imbalance in composts have caused concern to
some potential compost users. Some believe that because the concentration of zinc
(Zn) or copper (Cu) in composts is higher than found in background soils, these
materials must not be utilized on soils. However, practicing horticulturists and
researchers have used high-quality organic matter/compost products for decades
without adverse effects (Andersson, 1983; Chaney and Ryan, 1993; de Haan, 1981;
Mays and Giordano, 1989; Sanderson, 1980; Woodbury, 1992). Boron (B) phyto-
toxicity was observed when high rates of MSW-compost were used in media in the
1970s, but changes in glue formulations removed this possible adverse effect of
MSW-composts (Chaney and Ryan, 1993; Sanderson, 1980). How could such high
benefits be observed so often if the metals and other constituents were so dangerous?
In brief, the logical flaw, in presuming that metals in composts must cause adverse
effects in the future, is the focus on total concentrations, when phytoavailability of
microelements is well known to vary as a function of source. Similarly, biosolids,
pet excreta in yard debris, and manures contain pathogenic organisms, but proper
composting generates products that comprise no human or plant pathogen risk. It is
not biosolids and composts that should cause concern, but whether these products
© 2001 by CRC Press LLC
meet enforceable standards of acceptable quality composting technologies, maturity
of composts, and composition of composts that are to enter the marketplace of
organic amendments and media components.
In 1970, when modern interest in the safety of utilizing organic byproducts and
composts on cropland began its rapid increase, biosolids were often highly contam-
inated with metals and xenobiotics. Few MSW composts were available for use, and
only a few of these were mature composts ready for use in crop production. Sub-
stantial efforts were undertaken in many countries to conduct research to characterize
the potential for adverse effects from use of composts and biosolids so that regula-
tions could be developed to protect soil fertility and food-chain safety.
In the U.S., these efforts culminated in the development of the U.S. Environ-
mental Protection Agency (U.S. EPA) Clean Water Act Section 503 Rule on land
application of biosolids (U.S. EPA, 1989a, 1993), hereafter called the 503 Rule.
Such U.S. rules are “proposed” for public comment, to allow errors and omissions
to be identified, and other data to be provided to the U.S. EPA to improve the
scientific basis of the rule. Errors were found and questions were raised after the
U.S. EPA prepared the first Proposed Draft 503 Rule (U.S. EPA, 1989b). Therefore,
the scientific community thoroughly evaluated data from many experiments to
develop improved risk assessment models to protect soil fertility and food-chain
safety during use of composts and biosolids. Development of the final corrected 503
Rule is discussed later.
A. Industrial Pretreatment Improves Quality of Biosolids and Composts
Fortunately, pretreatment of industrial wastewaters has allowed most municipal-
ities to produce biosolids and composts with low concentrations of metals and
synthetic organic compounds (Table 16.1), reducing the potential for adverse effects.
The median concentrations of metals in biosolids have fallen substantially over the
last 25 years. When pretreatment of industrial sources is complete, biosolids still
contain significant levels of Zn, Cu, and some other elements because such elements
are in foods (hence in human wastes) and food wastes, or are leached from the pipes
which carry water to and in our homes. Interestingly, the need to keep lead (Pb) in
drinking water at low concentration at the home tap to protect children is requiring
many municipalities to treat their water to reduce the corrosion of water pipes. This
improvement in drinking water treatment to reduce risks from Pb in water transmis-
sion systems has reduced Zn, Cu, Pb, and cadmium (Cd) levels in biosolids formed
during treatment of domestic wastewaters.
These management options have made it possible to attain biosolids and com-
posts with reduced concentrations of metals and xenobiotics. Some have argued that
only products which are as low in contaminants as possible should be allowed to
be used in agriculture. Although common sense dictates that avoidable metals should
be avoided, costs involved with avoidance of metals in biosolids or composts become
an issue. At some point, the increase in benefits from lower concentrations are less
than the costs associated with reduction. It is especially difficult to define concen-
tration limits in composts for the elements that are naturally present in all soils and
foods; it is even more difficult to do so for those metals that are micronutrients for
© 2001 by CRC Press LLC
plants and animals, but can become phytotoxic or zootoxic when present in excess
under soil management conditions that maximize phytoavailability. These questions
can be addressed through field experiments to learn what the response to different
quality composts and biosolids may be when these products are used in a range of
soils for production of a wide assortment of crops, considering long-term high
cumulative applications. Data are usually available as needed for such quantitative
risk assessment for soil or compost trace element limits.
For MSW composts, “pretreatment” to separate compostable and noncom-
postable materials can significantly reduce the levels of metals and xenobiotics in
the compost (see Table 16.1) (Cook and Beyea, 1998; Epstein et al., 1992; Richards
and Woodbury, 1992). Here pretreatment is more complex because there are at least
two major ways to obtain this pretreatment. One is requiring all citizens to separate
home solid wastes into different fractions to allow recycling of glass, plastics, clean
paper and metals; composting of biodegradable organic materials; and safely dis-
posing of the noncompostable materials. Depending on one’s view, this is either
having government encourage the lower cost better solution, or the imposition of
intrusive government into one’s kitchen. The alternative to home separation is devel-
opment of machines to separate the recyclable materials from those that are best
used in producing composts. Charging a higher rate for MSW that has not been
preseparated in the home might increase compliance, but with human fallibility, such
home separation cannot be perfect. Separation at the MSW handling facility can be
done before or after shredding, and the completeness of separation of recyclable and
compostable materials is variable when different technologies are used at different
facilities. None of these separation technologies are as effective as home separation
Table 16.1 Range of Contaminant Concentrations Reported for Biosolids Before
Pretreatment Enforcement
Historic
Reported Range
MSW-Compost
(Median)
Element Min. Max.
1990
Survey
Median Mixed Separated
“Green”
MSWC
German
Richtwert
NOAEL
Biosolids
Attainable
Biosolids
Zn 101 49,000 725 563 353 255 400 2800 <1500
Cd <1 3,410 7 3.5 1.9 0.5 2.0 21 <10
Cd/Zn, % 0.01 110 0.8 0.61 0.47 — — 1.5 <1.0
Cu 84 17,000 463 194 72 40 100 1500 <500
Ni 2 8,330 29 29 24 17 50 290 <100
Pb 13 26,000 106 261 152 86 150 300 <100
As — — 3.7 — — — 54 <25
Hg 0.6 110 2 1.5 1.3 0.17 1.5 17
z
<5
Cr 10 99,000 40 43 34 — 100 — <500
PCBs
y
<0.1 >1,000 0.02 — — 0.14 — 2.2 <0.5
Note: 1990 median concentrations from National Sewage Sludge Survey (U.S. EPA, 1990), typical
“mixed” or “separated” MSW-composts (MSWC) (Epstein et al., 1992), “Green” MSW-
composts (Fricke et al., 1989), and the German MSW-Compost Richtwert (Guide Value),
compared to the “No Observed Adverse Effect Level” (NOAEL) biosolids and “Attainable
Quality” biosolids products with effective pretreatment and control of water corrosivity. All
values are mg per kg dry weight.
z
Appropriate limits for all biosolids/compost uses except mushroom production.
y
PCBs = polychlorinated biphenyls.
© 2001 by CRC Press LLC
by responsible citizens who believe that such separation is part of better environ-
mental protection (see Cook and Beyea, 1998).
High-quality composts should contain low levels of glass, plastics, and pieces
of metals from the noncompostable materials in the initial MSW. Glass is silica
similar to sand; but some glass had Pb, Cd, and other metals added for color or for
function (x-ray shielding in TV tubes). Cans are commonly welded steel today rather
than soldered with Pb, but most are galvanized with Zn. The higher value for these
metals is recycling rather than shredding until they are inseparable from compost
organic particles. Other materials commonly placed in MSW at homes include
pesticide wastes, batteries, and such household hazardous wastes as “pressure-treated
lumber” containing high levels of chromium (Cr), Cu, and arsenic (As) or pentachlo-
rophenol (PCP) with contaminant dioxins. Although very effective demonstration
programs for home separation have been tested in several cities by the Audubon
Society and their cooperators (Cook and Beyea, 1998), few cities have provided the
educational resources needed to achieve such effective home separation of recyclable
and hazardous constituents from compostable materials in household solid wastes.
Inclusion of treated lumber wastes with yard debris causes even the normally uncon-
taminated yard debris to be enriched in metals and xenobiotics. Shredding companies
need to aggressively exclude chromated copper arsenate (CCA)- and PCP-treated
wood wastes from mulch or composting feedstocks.
B. Nutrient Supply from Biosolids and Composts
Organic soil amendments such as biosolids and composts are used as fertilizers
and soil conditioners (see guidance for beneficial use in Hornick et al., 1983; Wright,
1999; and other chapters in this book). Different products have different rates of
nitrogen (N) mineralization, different phosphate availability, etc., related to their
composition and method of manufacture. Most users want to apply the amendments
at N or phosphorus (P) fertilizer rates, but it has been difficult to measure the N-
mineralization rate of different products in different soils. Composting of biosolids
and manures with cellulosic materials lowers the mineralization rate due to a change
in carbon to nitrogen (C:N) ratio and changes in chemical forms of N present.
Improved methods of estimating N-mineralization rate from a wide range of organic
amendments have been reported by Gilmour (1998) and Gilmour and Skinner (1999).
Although N and P supply are always a consideration during utilization of organic
amendments such as biosolids, composts, and manures, biosolids-containing prod-
ucts can also serve as potassium (K), sulfur (S), calcium (Ca), magnesium (Mg),
and microelement fertilizers except for B (Chaney et al., 1980). The use of biosolids-
compost potting media for horticultural crops was evaluated by Sterrett et al. (1982,
1983). They observed effective transplant production with such media, and found
no change in Cd or Pb in edible crop tissues at maturity. Such media can provide
savings for producers without threatening food safety because composts of high-
quality were used to prepare the media. In later tests, they showed that adding
composted biosolids to metal-rich urban garden soils could reduce concentrations
of Pb and Cd in lettuce (Lactuca sativa L.) (Sterrett et al., 1996), illustrating soil
metal remediation principles later characterized by Brown et al. (1998b).
© 2001 by CRC Press LLC
C. Defining High-Quality Biosolids and Composts for Sustainable Use
Because biosolids and composts cannot be as low in metals as background soils,
some method is needed to evaluate whether high-quality organic resources are low
enough in metals and xenobiotics that they may be safely used in agriculture.
“Quantitative risk assessment” is the method developed to make these determina-
tions, a method using scientific data from field research studies with amendments,
soils, crops, and animals to determine whether harm is possible or likely when
different quality organic resources are used on cropland. Actually, many of the most
limiting pathways for risk assessment are in horticultural use. For example, home
gardens allow individuals to be exposed to elements absorbed by garden crops from
the amended soils, or allow children to ingest amended soils or even commercial
products purchased for use as a mulch or soil conditioner for edible and ornamental
plants.
This chapter cannot be comprehensive, but it does provide a summary and
references to the research and risk assessment conducted on land application of
biosolids and composts. Although MSW and yard debris composts are generally
less contaminated with metals and xenobiotics than biosolids, they also contain lower
levels of adsorbent iron (Fe) and manganese (Mn) oxides. Less research has been
conducted with these composts than with biosolids. Further, because composts have
lower concentrations of metals than biosolids, the data from study of biosolids have
been more important in developing the limits for regulations for several organic
amendments. Because contaminant applications in compost remain low, adverse
effects of compost use are seldom, if ever, observed. Application of the 503 limits
developed for biosolids are often used for other organic amendments; but if the
adsorbents in the compost are lower than in biosolids, protection against metal uptake
may also be lower. Further research is needed to determine whether the limits
developed for biosolids-applied metals should be applied to other organic amend-
ments.
II. RISK ASSESSMENT METHODOLOGY FOR CONTAMINANTS IN
BENEFICIALLY USED BIOSOLIDS AND COMPOSTS
A. Pathway Risk Assessment Used for the U.S. EPA Section 503 Rule
This section summarizes risk assessment for trace elements and current regula-
tions needed to keep composts and biosolids utilization in agriculture an environ-
mentally acceptable practice, and future directions in markets and research for these
products. In the U.S., work has gone on since about 1978 to develop regulations for
biosolids utilization. During 1989, a proposed rule was published for public com-
ments (U.S. EPA, 1989b). Unfortunately, the U.S. EPA did not seek peer review of
the science in the proposed rule before publication for public comment. But the
proposed rule did not properly use the available science and data sets, and conse-
quently, it was discarded after public review comments showed these flaws (U.S.
EPA, 1989b). U.S. EPA staff and contractors had decided to use only data that
© 2001 by CRC Press LLC
showed adverse effects to establish limits. For example, if they could find no
phytotoxicity in the field from high-quality composts and biosolids, then they looked
at greenhouse data. If metals in biosolids did not injure plants, they looked at data
for added metal salts. They made numerous errors in simply collecting data from
published research results (see Page et al., 1989). Because inappropriate data were
used to estimate limits needed to protect the environment from contaminants in
biosolids, EPA calculated such low allowed cumulative application rates that pub-
lically owned treatment works (POTWs) would have been forced to use landfills or
incinerators rather than using biosolids beneficially on farmland or for remediation
of disturbed land.
These errors were fundamental scientific mistakes that could be corrected. EPA
subsequently selected an expert workgroup to identify and correct the mistakes in
the 1989 proposed rule. This team worked part time for 2 years to carefully check
the algorithms used to calculate limits, and to review the data collected by EPA and
add other relevant data in the literature, and correct these algorithms and data. The
expert workgroup examined data from experiments from around the world, and a
number of very important principles were identified (discussed later).
The Clean Water Act Part 503 Rule evaluates 14 Pathways (Table 16.2) by which
an applied contaminant in biosolids/compost could cause risk to highly exposed
individuals (HEIs). The different pathways protect the HEIs from adverse effects of
contaminants that might be transferred to humans via the general agricultural food
chain, or by growing a substantial fraction of their annual food supply on home
gardens that had received a huge maximum cumulative biosolids application, 1000
Mg·ha
–1
on a dry weight basis. The rule protects livestock, and humans who con-
sumed meats and organ meats from livestock that were maximally exposed to
biosolids. Pathway 8 protects plants by calculating limits to prevent phytotoxicity.
Pathway 9 protects soil organisms (e.g., earthworms, bacteria, fungi), and Pathway
10 protects predators of soil organisms. The remaining pathways involved surface
and groundwater (important for nitrate), volatilization to air, and inhaled suspended
dust, which are generally not limiting for trace elements.
Each pathway was constructed to protect organisms identified as the HEIs —
humans, plants, or animals — at the 95th to 98th percentile of exposure. These are
much more protective than it seems at first glance. Rather than the 95th to 98th
percentile of the whole U.S. population, it is this level of exposure among the subset
of the population which were actually significantly exposed to contaminants from
biosolids. Only a small part of the U.S. population lives on a farm or eats (for their
lifetime) crops grown on a garden that has high regular compost or biosolids appli-
cation. Even in these cases, transfers were linearly extrapolated from applications
in experiments to the assumed 1000 Mg·ha
–1
cumulative loading rate, considerably
over-estimating transfers.
Although potentially toxic organic compounds were deleted from the 503 Rule
during the correction of the calculations, a thorough risk assessment for polychlo-
rinated biphenyls (PCBs) applied via biosolids or compost was prepared by Chaney
et al. (1996). For organics, the most limiting pathway is the ingestion of soil or
biosolids by grazing livestock, because the livestock bioconcentrate PCBs from their
diets, and there is very little transfer of PCBs from soil to plants (no uptake, only
© 2001 by CRC Press LLC
volatile transport). Production and use of PCBs has been prohibited for several
decades, and PCB concentrations in biosolids/composts are now very low (Table
16.1). Even the highly exposed farm family consuming meat and dairy products
produced on fields with biosolids or compost amendments are highly protected from
the traces present today.
B. U.S. Limits on Contaminants in Biosolids and Composts
Table 16.3 shows the limits established for regulated potentially toxic elements
by the final EPA 503 Rule, and the pathway that was most limiting (Column 2) for
each metal using the final EPA calculations (U.S. EPA, 1993). The Ceiling Limit
(Column 3) is a maximum concentration of metals in biosolids which was established
because (1) if only cumulative loading limits were imposed, pretreatment effective-
ness might be threatened; and (2) if more highly contaminated biosolids were land
applied, because biosolids metals are more phytoavailable the higher the total metal
concentration, phytotoxicity might occur at lower cumulative metals applications
than estimated using data obtained from studies with better quality biosolids. If no
ceiling limit were required, highly contaminated biosolids in which the metals have
higher phytoavailability could be used, which could cause the cumulative loading
Table 16.2 Pathways for Risk Assessment for Potential Transfer of Biosolids-Applied
Trace Contaminants to Humans, Livestock, or the Environment, and the
Highly Exposed Individuals to be Protected by a Regulation Board on the
Pathway Analysis
Pathway Highly Exposed Individuals
1 Biosolids→Soil→Plant→Human Individuals with 2.5% of all food produced on
amended soils with 1000 Mg·ha
–1
.
2 Biosolids→Soil→Plant→Human Home gardeners with 1000 Mg·ha
–1
; 60%
garden foods for lifetime.
3 Biosolids→Human Ingested biosolids product; 200 mg per day.
4 Biosolids→Soil→Plant→Animal→
Human
Farms; 45% of “homegrown” meat; 1000
Mg·ha
–1
; lifetime.
5 Biosolids→Soil→Animal→Human Farms; 45% of “homegrown” meat; lifetime.
6 Biosolids→Soil→Plant→Animal Livestock feeds; 100% grown on amended land
with 1000 Mg·ha
–1
.
7 Biosolids→Soil→Animal Grazing livestock; 1.5% biosolids in diet.
8 Biosolids→Soil→Plant “Crops”; strongly acidic soil with 1000 Mg·ha
–1
.
9 Biosolids→Soil→Soil Biota Earthworms, microbes, in soil with 1000
Mg·ha
–1
.
10 Biosolids→Soil→Soil
Biota→Predator
Shrews; 33% earthworms diet, living on site
with 1000 Mg·ha
–1
.
11 Biosolids→Soil→Airborne
Dust→Human
Tractor operator; dusty tillage; 1000 Mg·ha
–1
.
12 Biosolids→Soil→Surface
Water→Human
Subsistence fishers where erosion moved
products from fields to lakes.
13 Biosolids→Soil→Air→Human Farm households.
14 Biosolids→Soil→Groundwater→
Human
Well water on farms; 100% of lifetime supply.
Note: Each Pathway presumes 1000 Mg dry biosolids per ha and/or annual application of
biosolids as N fertilizer.
From Chaney and Ryan, 1994; U.S. EPA, 1989a, 1992, 1993. With permission.
© 2001 by CRC Press LLC
limit to be unprotective. Column 4 shows the Cumulative Application Limit for the
metals (in kg·ha
–1
), the most limiting pathway for each element of all the risk
assessment pathway calculations for the element.
In order to develop a new method of biosolids regulation (the alternative pollutant
limit [APL]), the Cumulative Application Limit was assumed to be applied by 1000
Mg·ha
–1
of biosolids, and expressed on a mg·kg
–1
basis. Because limiting the con-
centration of metals in biosolids or compost can provide lower percent bioavailability
and hence greater protection than simply limiting the cumulative application of
metals, the expert workgroup recommended that EPA provide a regulatory mecha-
nism which reduced the regulatory burden for higher quality biosolids (which met
Table 16.3 Comparison of the Ceiling and Cumulative Limits for Biosolids Contaminents
Under the Final CWA-503 Limits vs. No Observed Adverse Effect Level Limits
Limits Under the EPA 503 Rule Limits Under the NOAEL Approach
Element
1
Limiting
Pathway
2
Ceiling 99th
(mg·kg
–1
)
3
Cumulative
(kg·ha
–1
) =
APL
(mg·kg
–1
)
4
Limiting
Pathway
5
Limit
(mg·kg
–1
)
6
Percentile
of NOAEL
7
Attainable
Quality
8
As 3 75 41 3 54 98 <25
Cd 3 85 39 2 21 91 <5–10
Cd/Zn —— — 2 1.5% 87 1.0%
Pb 3 840 300 3 300 90 <100
Hg
z
35717121793<5
Mo
y
6 75 35 6 54 98 <50
Se 6 100 36 6 28 98 <15
Cr 8 3000 1300 —
x
———
Cu 8 4300 1500 8 1500 89 <500–750
Ni 8 420 420 8 290 98 <100
Zn 8 7500 2800 8 2800 91 <1500–2000
Note: Ceiling (Column 3, based on the lower of the risk-based Pathway Limit or the 99th percentile
of biosolids contaminant concentrations from the 1990 National Sewage Sludge Survey
[U.S. EPA, 1990]). Cumulative (Column 4, Pathway Risk Assessment based) limits for
biosolids contaminants under the Final CWA-503 Limits (Feb. 19, 1993). No Observed
Adverse Effect Level (NOAEL) limits (column 6) estimated by Chaney (1993a) and Chaney
and Ryan (1994). Columns 2 and 5 refer to Pathways listed in Table 2. Biosolids which
meet the Alternative Pollutant Limit (APL) (Column 4) or NOAEL (Column 6) quality limits
may be applied at up to 1000 Mg·ha
–1
before reaching the Cumulative Limit, and still protect
Highly Exposed Individuals according to the Technical Support Document for the 503 Rule.
For the APL and NOAEL biosolids, adsorption of contaminants by biosolids constituents
lowers the potential for risk sufficiently to allow general marketing and continuing use in
sustainable agriculture. The percentile of the NOAEL (Chaney,1993a) concentration in the
National Sewage Sludge Survey (US-EPA, 1990) is shown for comparison (Column 7).
Column 8 shows the metal limits that we believe are “attainable” by publically owned
treatment works (POTWs) that enforce industrial pretreatment standards; the corrosivity
of drinking water may need to be controlled in some cities to achieve NOAEL levels of Pb,
Cu, Zn, and Cd.
z
Valid for all biosolids uses except mushroom production.
y
Mo limit corrected by adding appropriate data, and omitting data from a biosolids containing Mo
at 1500 mg·kg
–1
.
x
Cr limits for biosolids were deleted from the 503 Rule after Court-required review; no adverse
effects of Cr(III) present in biosolids or composts have been identified despite intense investiga-
tions (see Chaney et al., 1997).
© 2001 by CRC Press LLC
the limits in Column 4). These APL biosolids may be marketed for general use
without cumulative site loadings for the regulated metals, if treated to kill pathogens
(e.g., composted, heat dried, or equivalent pathogen reduction). EPA has further
described APL-quality biosolids that have been aerobically stabilized and received
an effective pathogen reduction treatment as “exceptional quality” biosolids. These
products may be marketed as commercial products for lawns, and for use in home
gardens.
Column 6 is the so-called No Observed Adverse Effect Level quality of biosolids
as recommended by Chaney (1993a). For a number of the elements, U.S. Department
of Agriculture (USDA) review of the final EPA 503 Rule indicated that policy
decisions had led to limits which USDA concluded were less appropriate than needed
for such a rule. For several elements (As, Cd, mercury [Hg]), EPA presumed 100%
bioavailability of metals in soil or biosolids ingested by children; this caused limits
to be lower than needed to protect HEI individual children (e.g., As); further, EPA
used the 99th percentile as the ceiling limit instead of the 98th percentile used in
the 1989 proposed rule. Raising this ceiling seemed unwarranted (Chaney, 1993a).
C. Hidden Safety Factors in Pathway Calculations
Ryan and Chaney (1993, 1997) provide a detailed discussion of the impact of
protecting HEIs on the level of protection actually achieved by the complex algo-
rithms of the 503 Rule methodology (U.S. EPA, 1989b). In the garden pathway,
many factors are multiplied together to make the final calculation. The whole pop-
ulation for this pathway is those individuals who consume a high fraction (approx-
imately 60%) of their lifetime garden foods from crops grown on soil in home
gardens amended with very high levels of biosolids, on the order of 1000 Mg·ha
–1
.
These individuals are assumed to be exposed for 70 years for cancer endpoints, and
50 years for Cd injury to the kidney. The soil is presumed to be acidic (geometric
mean soil pH by EPA, and pH ≤6.0 by Chaney) for the whole lifetime. Transfer of
Cd from the soil is estimated by the linear regression uptake slope for the crop and
soil times the amount of a food ingested per day (lifetime average), times the fraction
of diet presumed to be produced on the biosolids-amended home garden (37% of
potatoes [Solanum tuberosum L.] and 60% of other garden foods).
Further, the uptake slope used in the 503 Rule calculation of food-chain transfer
is not the increment reached at the plateau in the usually observed long-term rela-
tionship between soil Cd and crop Cd (Chaney and Ryan, 1994; Corey et al., 1987),
but the linear regression for the data. This linear regression approach gives a much
higher predicted plant Cd concentration at 1000 Mg·ha
–1
biosolids than observed in
long-term field studies (see later). The smaller the cumulative application rate for
the actual data used in the regression, the larger the error of over-prediction. Also,
the risk reference dose (RfD) which may not be exceeded (e.g., for Cd, 1 µg Cd per
kg body weight per day) is a conservative estimate of the intake of Cd that over a
lifetime causes the first sign of mild kidney disease (Chaney et al., 1999).
So the final 503 algorithms were revised to include some calculation factors that
are central-tendency rather than all being worst case. The EPA calculation of the
© 2001 by CRC Press LLC
mean uptake slope for valid field data used the geometric mean of all Cd uptake
slope data, not just the soil with pH ≤6.0. Because this geometric mean increased
the allowed soil Cd for garden soils to 120 kg·ha
–1
, the USDA (1993) advised U.S.
EPA that they should use the data from acidic soils, and consider using arithmetic
means of the valid field data for plant uptake slope. If the arithmetic mean of the
whole field data set was used, the maximum soil Cd allowed would have been 12
kg·ha
–1
. However, this data set included three field studies using highly contaminated
biosolids. In general, the higher the biosolids Cd concentration, the higher the uptake
slope regardless of the cumulative applied Cd (Jing and Logan, 1992). Since the
rule would be limiting maximum biosolids Cd to relatively lower levels than those
found in the three studies with highly contaminated biosolids, USDA reasoned that
the results from these three studies should not be included in the EPA calculations
(Chaney and Ryan, 1994). When the data from the three highly contaminated
biosolids field studies were omitted from the dataset used to make the calculation,
the estimated allowed cumulative application of biosolids Cd was 21 kg·ha
–1
(Table
16.4). Stern (1993) was also concerned about the garden food pathway and conducted
a Monte Carlo calculation of risks from biosolids-applied Cd, as noted by Chaney
and Ryan (1994) for the complete dataset. Stern’s calculation estimated the same
12 kg·ha
–1
of Cd when all data were used. But he also did not evaluate the effect of
deleting the uptake slopes from studies that used very high Cd biosolids. In the end,
USDA recommended that biosolids to be used on farmland should contain no higher
than 21 mg·kg
–1
of Cd (USDA,1993), and noted that median quality biosolids
contained only 7 mg·kg
–1
of Cd and domestic source biosolids commonly contain
<2 mg·kg
–1
of Cd. When these lower levels are so attainable today, there is no need
to allow biosolids containing Cd at 120 mg·kg
–1
to be used on cropland.
As noted above, the 503 limit for an element was the lowest risk based limit for
all pathways. For Cd, it had been evident for 30 years that the garden foods pathway
comprised higher potential risk than the soil ingestion pathway. In the U.S. EPA
Rule (U.S. EPA, 1993), soil ingestion was the limiting pathway, 39 kg·ha
–1
of Cd.
This would not have been the outcome if the algorithm noted above with acidic soils
had been used, or if soil ingestion had been corrected for the low bioavailability of
Cd in ingested soil. Table 16.5 shows the calculated limit for each pathway for Cd.
Even with the revised algorithms of the final 503 Rule, it is more likely that
regulators erred on the conservative side (making low estimates of allowed cumu-
lative applications) than on the high side. Some of the hidden safety factors that
remain in the risk assessment include
1. Individuals cannot harvest a mixture of high-uptake slope leafy vegetables grown
in a single garden for the whole year due to climate limitations on crop growth;
thus they cannot practically ingest 60% of their annual intake of leafy vegetables
grown on the model home garden. This is the food group which transfers most
soil Cd into garden foods — therefore, the estimated risk is higher than the
maximum potential risk.
2. Individuals are very unlikely to consume garden foods from a garden with 1000
Mg·ha
–1
biosolids for 50 years.
© 2001 by CRC Press LLC
3. Use of linear regression slopes for the uptake of metals to edible portions of crops
is a high estimate of the increase when the plateau is reached (about three- to ten-
fold error; see below).
4. Cd in crops grown on recommended quality biosolids/compost (APL) has low
bioavailability (Chaney et al., 1978b) because of Zn also accumulated by the crop.
Multiplying the combination of central tendency and worst case variables
together, one may still be estimating exposures greater than the most highly exposed
individual for their lifetime, and thus calculating excessively low allowed cumulative
loadings. Many of the most limiting pathways for a contaminant were those that
calculated a lower estimate than needed to provide full lifetime protection to the
HEIs. One cannot estimate the actual percentile of the HEI in the final rule due to
the lack of data on measured intake of vegetables grown on biosolids or compost
amended soils, and the cumulative application on these soils. It may be several
hundred years before an appreciable number of individuals could build garden
biosolids and composts applications to high enough levels to meet the limits of the
503 Rule for cumulative application rate (see Ryan and Chaney [1993] for discussion
of time to reach 1000 Mg·ha
–1
while following the 503 Rule).
An important source of significant conservatism in the final 503 Rule is the
failure to adjust ingested metals for fractional bioavailability. The Pathway 3 limit
(soil ingestion) shown in Table 16.4 is 39 kg·ha
–1
for the U.S. EPA calculation. Table
16.5 lists the Pathway 3 corrected limit, 183 kg·ha
–1
of Cd, when bioavailability is
Table 16.4 Calculated Increased Cd in Garden Food Groups Due to Biosolids Use
According to the USDA (1993) Recommendation
Food Group UC
i
DC
i
FC
i
UC
i
·DC
i
·FC
i
%
Potatoes 0.008 15.60 0.37 0.0462 1.8
Leafy vegetables 1.719 1.97 0.59 1.995 79.9
Non-dry legumes 0.004 3.22 0.59 0.0076 0.3
Root vegetables 0.094 1.60 0.59 0.0885 3.5
Garden fruits 0.113 4.15 0.59 0.277 11.1
Sweet corn 0.097 1.60 0.59 0.0814
3.3
All Garden Foods 2.496 100
Calculation algorithm:
WHO limit Background Allowed Pathway 2
intake increase limit
RP
C
= 70 µµ
µµ
g/da
y – 16.1
µµ
µµ
g/da
y = 53.9
µµ
µµ
g/da
y
= 21.5 kg·ha
–1
2.496 2.496
Σ(UC
i
·DC
i
·FC
i
)
Note: Arithmetic means of Cd uptake slopes by leafy vegetables were used rather than
geometric means; mean for leafy vegetables calculated only for acid soils (pH <6) and
biosolids with Cd <150 mg·kg
–1
. The lower panel shows the full detail of the calculation
algorithm. UC
i
= Cd uptake slope for the i th food group (mg Cd per kg dry food group
per cumulative kg biosolids-Cd applied per ha); DC
i
= lifetime (chronic) average i th food
group ingestion rate (dry grams per day); and FC
i
= fraction of the i th food group supplied
by the home garden where biosolids were applied at 1000 Mg·ha
–1
. RP
C
= “Reference
Pollutant Application Rate” in kg·ha
–1
.
© 2001 by CRC Press LLC
included in the calculation (see Chaney and Ryan, 1994). Feeding studies have
indicated that when Cd is incorporated into foods, and especially when Zn is present
at the usual ratio of 100 µg Zn per 1 µg Cd in biosolids, soils, and foods, the food
Cd has very low bioavailability. This was illustrated in studies of Swiss chard (Beta
vulgaris L., Cicla group) grown on biosolids-amended soils fed to Guinea pigs
(Chaney et al., 1978b) and Romaine lettuce fed to mice (Chaney et al., 1978a).
When Cd to Zn in biosolids and crops were normal (1:100), no increase in kidney
or liver Cd was observed. But when the biosolids had high Cd:Zn (pre-1980 Milor-
ganite™), chard and lettuce accumulated much higher concentrations of Cd (without
Zn phytotoxicity), and kidney and liver tissues were significantly increased in Cd.
Soil Zn can inhibit crop uptake of Cd, leaf Zn can inhibit translocation of Cd to
storage tissues, and food Zn can inhibit absorption of Cd in the intestine of con-
sumers. Further, when crop Zn reaches phytotoxic levels, crop Cd remains at low
concentrations when Cd to Zn is low. Crop Cd cannot exceed about 5 mg·kg
–1
in
crops which appear healthy, but leaf Cd can be substantially increased before Zn
phytotoxicity reduces yield when Cd to Zn is high. Similar low bioavailability of
biosolids-applied Cd to livestock has been repeatedly observed when high-quality
biosolids were used to produce feeds, or directly fed to livestock to test the element
transfer (Decker et al., 1980; Smith et al., 1985).
Table 16.5 Pathway Limits for Biosolids Cd Calculated Using Final 503 Rule
Methodology
Pathway
EPA
Calculation
(mg Cd per kg)
Corrected
Limit
(mg Cd per kg)
Further
Information
1 Food crops >300 Default to Pathway 2
2 Garden crops 120 21 Most limiting Pathway
3 Soil Ingestion 39 182 Corrected for bioavailability
4 Soil→Crop→Livestock→
Human
1,600 >1,000 Zn phytotoxicity prevents
Cd transfer and risk to
livestock or humans
5 Soil→Livestock→Human 68,000 >1,000 Pathway 7 is more limiting
6 Soil→Crop→Livestock 140 >1,000 Zn phytotoxicity prevents
Cd risk
7 Soil→Livestock 650 >>300 Low bioavailability of soil Cd
8 Phytotoxicity — >>21 Food chain much more
sensitive; Zn phytotoxicity
limits at 1:100
9 Soil organisms/
earthworms
— >>300 Pathway 10 more limiting
10 Earthworms→Shrews 53 296 Earthworms bioconcentrate
Cd
11 Dust to farm worker 8,000 — Higher still if bioavailability
included
12 Surface water 63,000 —
13 Air volatiles ——Not applicable
14 Groundwater Unlimited >1000
Note: Corrected limits reflect corrections for calculations for Pathways 2 and 3 reported in
Chaney and Ryan (1994) and discussed in this chapter.
© 2001 by CRC Press LLC
D. Phytotoxicity of Trace Elements
The most limiting pathway for Zn, Cu, and nickel (Ni) applied in biosolids/com-
posts is phytotoxicity. Reactions of these elements in soils, and phytotoxicity of
these elements to plants in relation to the concentration of the element in plant
shoots, make it highly unlikely that any animal will suffer toxicity if the forage crops
they chronically ingest are already experiencing Zn, Cu, or Ni phytotoxicity. This
protection has been called the “soil-plant barrier” (Chaney, 1983). That plants are
harmed by excessive soil Zn, Cu, or Ni before other HEIs in other pathways are
harmed is a valuable protection of humans, livestock, and wildlife. But farmers do
not want yield reduction when they expect beneficial response of crops to applied
biosolids and composts. We believe that the 503 Rule provides adequate protection
against future yield reduction under recommended farming pH management based
on long-term studies. Shifting to the APL approach to regulate biosolids quality
makes phytotoxicity even less likely to occur.
There have been many misunderstandings about the protection against phyto-
toxicity afforded by the 503 Rule. The Technical Support Document (U.S. EPA,
1992) presents the evidence. An article by Chang et al. (1992) summarizes the logic
and data used as part of the development of the Pathway 8 (phytotoxicity) limits.
The authors searched the literature to find the concentration of Zn, Cu, or Ni in
seedlings that caused reduction in shoot weight in pot or nutrient solution tests with
one added metal in the tests. This resulted in a tabulation of plant tissue concentration
vs. growth retardation in immature plants (2 to 6 week growth period) without an
understanding of the cause of the inhibition of growth or its impact on the growth
of the mature plant. Utilizing this information to develop a phytotoxicity value
requires an assumption that short-term reduction in shoot growth translates to yield
reduction at maturity. As the scientific literature does not adequately address the
validity of this assumption, a 50% growth retardation (phytotoxicity threshold; PT
50
)
was used as the threshold. Then, the field data from many studies were examined
to search for the probability that the plant tissue metal concentration associated with
the PT
50
was exceeded in the field, with a 1% probability used to set soil metal limits
(approach 1). A 1% chance of exceeding the plant tissue concentration associated
with the PT
50
concentration is quite protective, especially considering the observed
probability for all recorded studies, far less than 1%. In none of the field studies
identified by EPA have soils reached sufficiently high rates of biosolids metals (Zn,
Cu, or Ni) to produce a yield reduction except for highly contaminated biosolids
prohibited under the 503 Rule or strongly acidic soils that promote metal uptake
and phytotoxicity. Therefore the biosolids cumulative application limits were set at
a probability of 0.001% for Zn and Cu, and for Ni at 0.005%, or set at the 99th
percentile of biosolids composition (the ceiling limit).
A second approach (approach 2) to calculate allowable loading rates to estimate
Zn, Cu, and Ni limits used plant tissue concentration associated with potential
phytotoxicity in sensitive crops in the field (obtained from the literature) and the
plant response curve to biosolids-applied metals in acidic fields, subtracting the
background concentration of the element in leafy vegetables, to calculate an allow-
able loading rate. The lower value from these two approaches was used as the final
© 2001 by CRC Press LLC
503 Rule cumulative limit. Approach 2 using lettuce with tissue concentration from
Logan and Chaney (1983) produced a soil loading with Zn of 2800 kg·ha
–1
, whereas
approach 1 yielded a probability of 0.001% at a loading with Zn of 2500 to 3000
kg·ha
–1
. In the case of the other two metals (Cu and Ni), approach 2 yielded
substantially higher loading rates than approach 1 (2500 vs. 1500 kg·ha
–1
for Cu,
and 2400 vs. 425 kg·ha
–1
for Ni). As an additional observation that these values are
nonphytotoxic, Mahler et al. (1987) have reported that the yield of Swiss chard and
corn were not different between biosolids-amended and control soils in growth
chamber pot experiments using soil samples from high metal loadings experiments.
Also, Hinesly et al. (1984) reported only yield increases in corn grain at these high
levels of biosolids metals applications. Further discussion of the limited potential
for metal phytotoxicity when high-quality biosolids are used on cropland is reported
by Smith (1996).
Some readers of the Chang et al. (1992) article and the Technical Support
Document for the 503 Rule (EPA, 1992) have expressed great concern about use of
the PT
50
. A careful examination of the article shows the use of alternative phytotox-
icity threshold Zn levels for 8, 10, and 25%, as well as for 50%. The cumulative Zn
limit is not practically altered by using the PT
25
Zn concentration.
Scientists experienced with the study of metals in soils and plants are also
familiar with many possible errors in the kinds of studies that made up the PT
50
databases. In nutrient solution and sand culture tests, researchers commonly used
Fe-chelates to supply plant available Fe. When nonselective chelators such as eth-
ylenediamine-tetraacetate (EDTA) are used to supply Fe, added Zn, Cu, or Ni
displaces Fe from Fe-EDTA, causing the Fe to be precipitated and much less
phytoavailable. Metal-induced Fe-deficiency has often been an artifact of Fe-EDTA
chemistry in nutrient solutions and sand culture. Using Fe-EDTA strongly con-
founded a study of corn (Zea mays L.) and other Poaceae that used phytosiderophores
to dissolve and absorb soil Fe, but also confounded studies with other plant families
(Parker et al., 1995). Part of the added Zn, Cu, or Ni is chelated with the EDTA.
Although EDTA is not usually important in uptake of these elements, when high
levels of Fe-EDTA were supplied, and thus high levels of Zn-, Cu-, or Ni-EDTA
chelates were formed in the test solutions, some direct leakage of metal chelate into
the roots occurred. When Fe is supplied at 100 µmol·L
–1
, uptake of chelated metal
can be appreciable, thereby confounding the goal of the tolerance vs. residue test.
In a highly regarded set of studies by Beckett, Davis, and colleagues (e.g., Davis
and Beckett, 1978), barley (Hordeum vulgare L.) was studied with Fe-EDTA as the
Fe source in nutrient solutions applied to sand cultures. For at least Ni and Cu, the
phytotoxicity diagnostic concentrations found in these sand culture studies are appre-
ciably lower than found in many soil studies. If one finds such disagreement between
basic research sand culture or nutrient solution studies compared to soil studies while
conducting risk assessment research, one should give much greater weight to results
of soil studies.
If the Pathway 8 limits had relied on common phytotoxicity diagnostic concen-
trations of these elements based on soil studies in pots and fields, the outcome of
the 503 Rule risk assessment for metal phytotoxicity would not have been practically
changed. Chaney and Oliver (1996) made such a list of diagnostic concentrations,
© 2001 by CRC Press LLC
taking into account errors in research methods such as those discussed previously.
The phytotoxicity diagnostic concentrations in diagnostic foliar plant tissues they
listed were Zn, 500 mg·kg
–1
dry leaves; and Cu, 30 mg·kg
–1
dry leaves (Chaney and
Oliver, 1996). More recent evaluation of Ni phytotoxicity strongly supports diagnosis
of possible Ni phytotoxicity-induced yield reduction at 25 to 50 mg·kg
–1
dry shoots
for most species, while some species have little or no yield reduction from Ni at
100 mg·kg
–1
shoots (Chambers et al., 1998). Chang et al. (1992) discussed other
plant species having PT
50
of 50 to 100 mg·kg
–1
leaves, but identified a PT
50
for corn
at 3 mg·kg
–1
from the reports they relied on. This PT
50
was in substantial error as
subsequently shown by the study of L’Huillier et al. (1996).
Although some have questioned using PT
50
, it is evident that appropriate pro-
tection of the environment and of crop yields is obtained by the 503 Rule cumulative
Zn, Cu, and Ni limits and APLs based on an “holistic” evaluation of metal phyto-
toxicity from land-applied biosolids. There are reports in the literature of metal
phytotoxicity that resulted from biosolids-applied metals; but if one examines the
factors which contributed to the metal phytotoxicity, it is evident that these reports
are not a valid criticism of the 503 limits. Sensitive crops (such as lettuce) have
suffered yield reduction at pH ≥6.0 with foliar metal concentrations above phyto-
toxicity diagnostic levels in studies with extremely contaminated biosolids (Marks
et al., 1980). Adding such high metal amendments allows one to apply a lot of metals
at one time to examine potential phytotoxicity, but because the biosolids matrix
alters metal phytoavailability, results from such studies are relevant only to highly
contaminated biosolids. Indeed, such tests are strong evidence that highly contam-
inated biosolids or composts are not acceptable for use in horticulture and strongly
support the requirement for industrial pretreatment. A second category involves tests
with biosolids containing more typical concentrations of Zn, Cu, and Ni in which
soil pH was allowed to drift to very low levels where sensitive crops suffered
phytotoxicity (Brallier et al., 1996; King and Morris, 1972; Lutrick et al., 1982).
Allowing pH of test plots to drop over time while one observes potential development
of phytotoxicity is a time-honored method to conduct basic research studies, but
such data are not an appropriate basis for development of regulations. When soil
pH has dropped to 4.6, soil aluminum (Al) and Mn contribute to any observed
phytotoxicity, and such pH levels are not considered reasonable for farm manage-
ment because of the predictable yield loss. In studies with very strongly acidic soils
in which crop yield reductions were evident on soils amended with APL quality
biosolids, full yield was regained by simply applying the limestone needed for
normal production of the sensitive crops. For these reasons, EPA decided to set the
Zn, Cu, and Ni cumulative metal application limits for Pathway 8 based on field
research with soils at about pH 5.2 to 5.5, where natural soil Al and Mn can cause
natural phytotoxicity to the same sensitive crops, and at higher pH.
Another category of field-observed metal phytotoxicity is sites where pesticide
metal accumulation or industrial contamination occurred, and crops have suffered
yield reduction. Although data from such studies were considered, again the role of
the biosolids matrix reducing metal phytoavailability indicated that such data are
not relevant to regulations for metals applied in modern high-quality biosolids or
composts.
© 2001 by CRC Press LLC
Another aspect of metal phytotoxicity in the field should be considered. In the
field, roots quickly grow through the tilled soil depth where the applied metals
accumulate, and then are much less likely to be harmed by the metals. We have seen
high metal biosolids field plots which caused visible metal-induced Fe-deficiency-
chlorosis during early seedling growth of sensitive species, viz., soybean (Glycine
max [L.] Merrill) or lettuce, but where the plants fully recovered and had no
significant reduction in yield. In pot studies, roots are constrained to the treated soil,
and once toxicity begins, it usually worsens. Metal concentrations are higher in
plants grown in pots than in the same plants grown in the field where the same soil
and biosolids mixtures were used for the pot test or large lysimeters in which the
biosolids were incorporated in the surface 10 cm depth (deVries and Tiller, 1978).
In practice, when high-quality biosolids or compost were land applied, phytotoxicity
(usually from Zn) was observed only (1) when the soil pH was well below 5.0,
typically near 4.5; and (2) the crop was one known to be highly sensitive to excessive
soil metals such as peanut (Arachis hypogaea L.), lettuce, snap bean (Phaseolus
vulgaris L.), spinach (Spinacia oleracea L.), etc., as discussed previously.
The role of Fe, Mn, and Al and adsorbed phosphate in reducing uptake and
phytotoxicity of applied metals has also become more appreciated. With high-quality
compost products, there is no reason to suspect that Zn, Cu, or Ni phytotoxicity will
occur in the field unless extreme soil acidity is reached. Effective farmers do not
tolerate such poor management of pH. Thus great concern about potential phyto-
toxicity of biosolids/compost-applied metals (Zn, Cu, Ni) is not supported by
research tests or practical farm use of these products with modern regulations. Only
older highly contaminated biosolids, or extremely acidic pH, have allowed phyto-
toxicity.
Another perspective on metal phytotoxicity may be helpful. Farmers with
medium textured soils downwind of Zn smelters may have soils with 2000 to 3000
ppm Zn, but if they keep soil pH in the 6.5 range or higher, they profitably produce
even sensitive legumes and vegetable crops. Also, when soils are made calcareous
with biosolids or compost treatments to aid in revegetation, mine wastes and smelter
contaminated soils with over 10,000 mg·kg
–1
Zn have no adverse effect on grasses
and legumes (Brown et al., 1998b; Li et al., 2000).
E. Phytoavailability of Applied Trace Elements over Time
Although concern about long-term phytoavailability of metals in soils amended
with biosolids and compost has been part of the focus of research in this area of
science for over 30 years (Beckett et al., 1979; Chaney, 1973; Page, 1974), some
continue to express concern about the long-term risk from metals in biosolids and
composts. Although we believe it is scientifically valid to criticize the final Pathway
Analysis as being very conservative (see previous discussion), some scientists have
suggested that the pathway calculations are not protective enough. For example,
McBride (1995) challenged some of the conclusions of the expert workgroup,
concluding that metals in land-applied biosolids/compost may threaten soil fertility
and food chain safety and comprise a “time bomb” because applied organic matter
is biodegradable.
© 2001 by CRC Press LLC
The “time-bomb model” for the worst case risk from biosolids metals was
published by Beckett et al. (1979); similar considerations were reported by Chaney
(1973), Page (1974), and most other researchers who began research on biosolids
utilization in the 1970s. Beckett et al. (1979) considered that organic matter must
comprise the most important metal-adsorbing constituents in biosolids-amended
soils, and because the added organic matter will eventually be oxidized to the level
appropriate for the climate, texture, and cropping pattern of the soil in question, the
added metals would become more plant available over time and eventually poison
plants and animals. Many researchers had this concern in the 1970s, before extensive
research conducted in several nations failed to support this model (Chaney and Ryan,
1994; Corey et al., 1987; Johnson et al., 1983). Interestingly, Beckett’s team also
reported that Zn in biosolids is bound with organic-iron oxide assemblages rather
than simply bound to organic matter (Baldwin et al., 1983), and it is generally agreed
that only Cu is predominantly bound to organic matter as the starting form in
stabilized biosolids or composts.
McBride (1995) also challenged the concept of the plateau response (as illustrated
by Chaney et al., 1982) that results from the biosolids-applied adsorbent materials
(hydrous oxides of Fe, Mn, Al, etc.) that persist in biosolids-amended soils (see review
in Corey et al., 1987). This argument was based on the presumed loss of organic-
matter-specific metal binding sites in amended soils as organic matter was biodegraded.
Chaney, Ryan, and other scientists have examined this question by measuring
Cd phytoavailability of soils from long-term biosolids field plots. An important set
of studies by Mahler et al. (1987) and Mahler and Ryan (1988a, 1988b) involved
additions of Cd salts to soils collected from farmer’s fields that received high
cumulative applications of biosolids and adjacent untreated fields of the same soil
series. They grew Swiss chard, a spinach-like vegetable with high Cd uptake ability.
This plant is tolerant of high foliar Cd, so it has a very wide range of linear response
to phytoavailable Cd in soils. A careful examination of the full data from Mahler et
al. (1987) and Mahler and Ryan (1988a, 1988b) shows that the uptake slopes for
the unamended soils are in general higher than the slopes for the biosolids-amended
soils. When the untreated and biosolids-amended soils were at the same pH, or taken
to the same pH by addition of limestone, the slope was lower (= lower phytoavail-
ability) for the amended soil. The reduction in Cd uptake slope was especially evident
for those soils which had received high cumulative biosolids applications or biosol-
ids-metals applications. High applications of biosolids would add higher amounts
of specific metal binding strength to the amended soil, which would cause lower Cd
uptake slopes compared to lower cumulative biosolids/compost application rates.
Because soil pH strongly affects uptake of Cd, valid comparisons of soil differences
should be made at equivalent soil pH levels.
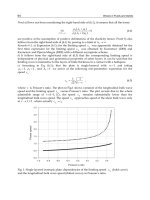
Figure 16.1 shows models of the patterns of plant uptake of metals in relation
to soil metal concentrations observed in studies of long-term biosolids-treated or
metal-salt-treated soils. This figure is our summary of the response patterns found
in long-term field studies; all lines start at the linear slope usually found for low
levels of added Cd salts, and model equal Cd additions to one soil but in different
forms. Curve A represents the linear response to small additions of salt Cd in nearly
all studies in the literature which we reviewed; in curve B, the pattern has increasing
© 2001 by CRC Press LLC
slope with higher Cd applications because Zn is also added, at 100 times the Cd
additions; the added Zn competes for the stronger Cd adsorption sites in the soil,
increasing Cd phytoavailability. These first two patterns have been repeatedly
observed in many studies around the world, and are illustrated well by the data in
White and Chaney (1980).
In contrast with the response pattern of Cd salt additions, the model slope C in
Figure 16.1 is for biosolids-applied Cd, in which the slope decreases at higher biosolids
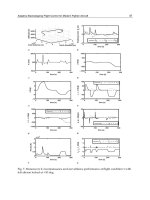
application rate toward a plateau with the x axis. Figure 16.2 shows the results for
lettuce uptake of Cd on long-term biosolids field plots at Beltsville, MD, and shows
the plateau regression response compared with linear regression to estimate the uptake
slope for the plateau data (Brown et al., 1998a; Chaney et al., 1982). Using orthogonal
contrast from an analysis of variance (ANOVA), they found that the (Rate)
2
term was
significant and negative. Using plateau regression, they found that the plateau con-
verged, supporting that model over a simple Rate, Rate
2
, and pH model. Clearly, the
simple linear regression fails to model the plant accumulation of Cd and Zn appropri-
ately. The slope is clearly controlled more by the adsorption chemistry of the biosolids-
applied constituents than of the unamended soil. The Corey et al. (1987) workgroup
reviewed the available field response data and concluded that this plateau response is
commonly observed and is the theoretically expected pattern of response. Strong
adsorption sites on hydrous Fe and Mn oxides and organic matter control adsorption
of Cd in soils rather than precipitation as inorganic solids. For biosolids with basal
low concentrations of adsorbent metal oxides, the pattern is more between linear and
plateau responses (e.g., Chang et al., 1997).
Some field experiments have appeared to support the time bomb hypothesis, in
that plant uptake of Cd from Cd-enriched, nonbiosolids-amended soils increased
Figure 16.1 Corrected hypothetical models of plant Cd response to soil total Cd concentra-
tions. (A) from addition of a soluble Cd salt; (B) from addition of a Cd soluble
salt with 100 times more Zn as a soluble salt; and (C) from addition of NOAEL
quality biosolids, after organic matter stabilization to background levels. (From
Chaney, R.L. et al., 1998. Soil-root interface: ecosystem health and human food-
chain protection, p. 279–311. In: P.M. Huang et al. (eds.). Soil Chemistry and
Ecosystem Health. Soil Science Society of America, Madison, Wisconsin. With
permission.)
© 2001 by CRC Press LLC
over time as soil organic matter was biodegraded. Much of the organic carbon (OC)
in biosolids also is lost due to biodegradation over time. If the OC disappeared and
other biosolids components did not provide increased metal adsorption capacity to
the soil, the response pattern for biosolids-amended soil should be increased phy-
toavailability of biosolids-applied Cd over time. On the other hand, having no change
in plant Cd accumulation over time supports a negative conclusion about the time
bomb hypothesis (Brown et al., 1998a; Chang et al., 1997; McGrath et al., 2000;
Sloan et al., 1997). As is clear from Figures 16.1, 16.3, and 16.4 that show crop Cd
vs. soil Cd, a plateau toward the x axis is the plateau of Chaney et al. (1982), Corey
et al. (1987), and Mahler et al. (1987). For example, under highly controlled con-
ditions, and equal pH between unamended and amended soils, Mahler et al. (1987)
reported that for each test soil, the Cd response to added salt-Cd was highly linear
with regression R
2
greater than 0.9 (two examples shown in Figure 16.3). But where
the soil had a substantial application of biosolids such that possible changes in soil
metal phytoavailability might be expected, the biosolids-amended soil had lower
slopes than the unamended comparison/control soil. Clearly, the added biosolids
caused a change in the Cd binding by the soils such that slopes were linear but
reduced on the biosolids-amended soil compared to the nonamended soil.
Figure 16.2 Linear vs. plateau regression analysis of lettuce uptake of Cd from acidic Chris-
tiana fine sandy loam amended with 0, 56, 112, or 224 Mg dry heat-treated
sludge per ha, and pH uncontrolled (≤ 5.5 in 1983) (Low pH). Predicted response
extrapolated to 1000 Mg·ha
–1
to show implications of the model used. Results
are average for 1976 to 1983 lettuce crops. Data points shown are arithmetic
means ± one standard error; plateau regression shows predicted (dashed lines)
with ± 95% confidence interval (dotted lines). Equation for linear regression (solid
line) is: Lettuce Cd = 1.22 + 0.00390·Rate (low pH). Predicted increment in lettuce
Cd at 1000 Mg·ha
–1
for the low pH treatment is 0.89 mg·kg
–1
for plateau regression
vs. 4.28 mg·kg
–1
for linear regression. Biosolids applied in 1976 contained 13.4
µg Cd, 1330 µg Zn, and 83 mg Fe per g dry weight. (Data originally reported in
Chaney et al., 1982.)
© 2001 by CRC Press LLC
Brown et al. (1998a) recently examined the relationship of Cd to OC in soil and
uptake of Cd by lettuce and other crops on field plots of different biosolids products
that were established in 1976–1978 at Beltsville, MD. The plots were cropped again
with Romaine lettuce and other garden crops in 1991–92 to examine the relative
uptake of Cd by different garden foods to allow use of Cd uptake by lettuce to model
Cd increase in all garden foods (Brown et al., 1996). Although McBride’s model
would require that plant uptake of biosolids-applied-Cd should be increased toward
the salt Cd response line over time as the biosolids-added OC was lost, plant Cd
was about the same or lower in 1992 than in 1978, even though soil pH had declined
over time on the acidic biosolids-amended plots. In this field experiment, a Cd salt
treatment at acidic and limed pH, at the same Cd rate (21 kg·ha
–1
of Cd) as the Cd
rich biosolids from Chicago (210 mg·kg
–1
of Cd in 1978) was established. Figure
16.4 shows the Cd to OC for these treatments at the beginning of the study
(1979–1981) and the 1991–1992 crops (Brown et al., 1998a). It is clear that loss of
OC from the biosolids-amended soils did not increase Cd uptake by lettuce on these
treatments. Thus the presence of metal adsorbent materials (hydrous oxides of Fe
and Mn) in composts and biosolids can add to the safety of these products as well
as to the plant nutrient value of the products.
We believe these results illustrate ways that manufacturers of biosolids and
composts could increase the inherent safety of these products, and that such manu-
facturers should seek Fe and Mn rich wastes or purchase Fe and Mn ores to be
included in the products to increase metal adsorption and fertility where these
products are used in agriculture.
Figure 16.3 Relationship of total soil Cd and Cd accumulation in leaves of Swiss chard grown
on control and long-term biosolids-amended soils with addition of 0–10 mg Cd
per kg dry soil; soil series from two cities; all soils made calcareous to avoid
unequal pH comparisons. (Based on data in Mahler et al., 1987.)
© 2001 by CRC Press LLC
F. Labels May Confuse Risk Communication
Perhaps some of the unscientific fear of biosolids is related to the labels used to
describe metals and xenobiotics in biosolids. U.S. EPA designated the chemicals in
biosolids as “pollutants” rather than constituents or contaminants. We believe these
labels should be used as described by Davies (1992) who argued that until an element
or xenobiotic is present at levels that could cause adverse effects to highly exposed
and sensitive individuals, it should not be called a pollutant. Rather, it is only a
contaminant until it can cause some adverse effect under reasonable worst case
conditions of soil management. Many contaminants have been emitted by industrial
society, and PCBs have been dispersed around the world due to their volatility, as
were Hg, Cd, Zn, and Pb, due to the transport of aerosols for long distances. Because
of the extreme unlikelihood that individuals will meet all the criteria of the HEI
simultaneously, the population is still highly protected at the point where the 503
Rule process has concluded the first adverse effect may occur; thus the soil would
not be “polluted” on a practical basis. If such highly conservative protection factors
are used in risk analysis, the most highly exposed and most sensitive individuals are
Figure 16.4 Effect of time after application of biosolids or salt-Cd to a low pH Christiana fine
sandy loam at Beltsville, MD, on phytoavailability of soil Cd to Romaine lettuce.
Cadmium at 21 kg·ha
–1
was applied in 100 dry Mg·ha
–1
of Nu-Earth biosolids
(210 mg Cd per kg dry weight) or Cd-salt, while Cd at 3.0 kg·ha
–1
was applied
in 224 Mg·ha
–1
heat-treated biosolids with 13 mg Cd and 83 g Fe per kg dry
weight. Soil pH was allowed to drift downward over time. Biosolids-applied Cd
did not become more phytoavailable despite loss of most of the organic carbon
applied in the biosolids. (Based on Chaney et al., 1982 and Brown et al., 1998a.)
Results are an average of 1976–1981 and 1991–1992 Romaine lettuce crops.
© 2001 by CRC Press LLC
still well protected. Thus, contaminated soils should still not be a source of special
concern until the HEIs would achieve the lifetime dose mean of the 503 Rule pathway
analysis. Failure to describe the magnitude of the over-protections provided against
human Cd disease by the 503 Rule and misunderstandings of the risk assessment
process are very likely the reasons why some individuals remain concerned about
risk of Cd disease, or of metal phytotoxicity, in soils where high-quality composts
or biosolids are applied to reach very high cumulative loadings. Certainly there are
no field observations to support this concern.
G. Soil Cadmium Risk to Humans
The understanding of Cd risk to humans has improved since the 1980s. Chaney
and Ryan (1994) presented a comprehensive review of Cd in soils, plants, foods,
and humans, and concluded that Cd in rice (Oryza sativa L.) consumed by subsis-
tence farm families is not a valid model for Cd risk in Western nations. Rice grown
on flooded soil allows much higher maximum grain and diet Cd than possible with
lettuce and other garden crops. Indeed, rice now appears to be in a Cd-risk class all
by itself (Chaney et al., 1999).
An epidemiological study in Shipham, England showed that soils with average
Cd concentrations of over 100 mg·kg
–1
(50 times higher than required to cause health
effects in subsistence rice consumers in Japan and China) caused no human disease
to long-term gardening residents (Strehlow and Barltrop, 1988); here Zn accompa-
nied the Cd in the gardens (from mine wastes that were dispersed several centuries
before housing was constructed), and moved to the edible tissues of the garden crops.
Two similar situations of persons growing gardens on contaminated soils without
adverse effects other than Zn phytotoxicity to sensitive crops have been reported:
one in a village at Stolberg, Germany developed on mine or smelter wastes after
World War II (Ewers et al., 1993), and another in Palmerton, PA (Sarasua et al.,
1995) where smelter emissions contaminated home gardens to 100 mg Cd and 10,000
mg Zn per kg of soil. Epidemiological studies on long-term populations in these
communities found no evidence of Cd-induced renal tubular dysfunction in any of
the older persons, even those who might have had high enough Cd ingestion to raise
concern. On the other hand, in China numerous cases similar to the rice Cd poisoning
of subsistence rice farm families in Japan were observed (Cai et al., 1990).
Thus, a combination of many sources of data now indicate that both the sociology
and agronomy of soil Cd exposure to humans were more important to whether
disease resulted than was the simple toxicology of Cd salts added to diets. Individuals
in Japan and China, who consumed high amounts of rice locally grown on highly
contaminated soils, suffered Cd disease because of a combination of soil chemistry
of flooded soils, the microelement physiology of rice, the interactions between Zn
and Cd at the plant membranes and in the intestine, and the Zn- and Fe-deficiency
suffered by people who subsist on rice-based diets. Agronomy of Cd risk predom-
inated over the toxicology of Cd risk in these cases. Epidemiologists who worked
diligently to characterize the medical bases of Cd risk to individuals in Japan (e.g.,
Nogawa et al., 1987) or in Europe (e.g., Friberg et al, 1985) had little appreciation
for the plant nutrition aspects of Cd disease, or for the human nutrition aspects of
© 2001 by CRC Press LLC
the disease. It now seems clear how they were led to the conclusion that soil Cd
was dangerous to humans, because that is the pattern observed in Japan and China,
where rice provides the bulk of the Cd exposure. But lettuce, wheat (Triticum
aestivum L.), and potatoes are much more important sources of exposure to Cd from
contaminated soils in the West, and soil Cd comprises far lower risk through these
foods than through rice. As summarized in Chaney and Ryan (1994), Zn phytotox-
icity is indeed a very strict limit on Cd in edible plant tissues, and the home garden
cannot provide excessive bioavailable dietary Cd when Cd to Zn is 0.015 or lower.
Cd and Zn in mine wastes and smelter emissions usually occur at the geological
ratio, about 0.005 to 0.01 Cd to Zn ratio, while Cd in plating wastes, wastes from
Cd-Ni batteries, and wastes from Cd pigments or plastic stabilizers containing Cd,
have little accompanying Zn. These latter sources allow greater potential for flow
of Cd in the food chain, and potential higher Cd bioavailability to humans who
consume crops grown on soils strongly contaminated by these sources, especially
so if the soils are acidic. Nearly all industrial injury to humans from Cd results from
Cd unaccompanied by the 100:1 Zn in geological sources.
As agronomists who have worked for several decades to better understand the
nature of soil Cd risk to humans, in order to set limits for Cd in biosolids, composts,
soils, and crops, we find it especially ironic that agronomy has proved important in
Cd risk. Toxicologists usually study the contaminant they are examining in a pure
form, such as soluble Cd salts without accompanying Zn or other materials in Zn
ores. They provide the Cd salts to animals that are often minimally adequate or
deficient in Fe or Zn to observe maximal Cd retention. Moreover, Cd often is supplied
to fasting individuals or by injection rather than by ingestion routes. Some of the
potential adverse toxicological effects of Cd result from Cd-induced Zn deficiency,
but the environmental relevance of these findings is restricted to sites where Cd
contamination is not accompanied by Zn — the rare and very minor case for soil
Cd enrichment.
A National Research Council Committee has reported on their review of the
information used by U.S. EPA to develop the 503 Rule (National Research Council,
1996). They examined the risk assessment pathways, the data used to provide transfer
coefficients, the data on pathogen reduction, etc., in the context of the safety of
foods grown on soils amended with biosolids or composts, or where treated waste-
water effluent was used for irrigation. The National Research Council committee
concluded that there was no evidence that either growers or consumers were at any
risk when the EPA regulations are followed, even at the extreme cumulative appli-
cations modeled by U.S. EPA.
H. Food Consumption Rates vs. Cadmium Risk Potential
Harrison et al. (1999) raised another concern about the 503 Rule Risk Assessment,
noting that the USDA’s Food and Nutrition Service presently recommends diets with
higher daily intakes of vegetables, fruits and grains compared to the lifetime diets used
in the 503 Rule Risk Assessment. This new approach to dietary recommendations, the
Food Pyramid, may cause the recommended shift in diet patterns of U.S. citizens. A
higher intake of leafy vegetables from acidic biosolids-amended gardens should
© 2001 by CRC Press LLC