Hazardous and Radioactive Waste Treatment Technologies Handbook - Chapter 3 pps
Bạn đang xem bản rút gọn của tài liệu. Xem và tải ngay bản đầy đủ của tài liệu tại đây (1.04 MB, 60 trang )
© 2001 by CRC Press LLC
Chapter Three
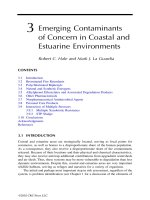
Separation Techniques
© 2001 by CRC Press LLC
3.1
In Situ Remediation
of Contaminated Soils by
Electrokinetic Processes
Sibel Pamukcu
Department of Civil and Environmental Engineering
Lehigh University
Bethlehem, Pennsylvania
C.P. Huang
Department of Civil and Environmental Engineering
University of Delaware
Newark, Delaware
Introduction
Soil systems are subject to contamination by a variety of hazardous chemicals, such as heavy metals
and toxic organic compounds. The major sources of pollutants are attributed to landfills and
industrial operations. For example, any hazardous substance present in a soil matrix represents a
threat to public health and groundwater. The latter is one of the most valuable natural resources
and a major source of drinking water in the United States. Many domestic, industrial, and agricul-
tural activities depend on groundwater resources. Therefore, strategies for soil clean-up are increas-
ing in demand.
Most of the host of soil remediation techniques available commercially are subject to a variety of
restrictions during application. Ex situ treatments such as pump and treat and containment can be costly
and therefore not totally attractive. Techniques including bioremediation, vitrification, freezing, and soil
washing are some of the options available, but they are usually very site specific and do not offer a good
prospect of in situ treatment. Vitrification and freezing do not extract contaminants from soils and
therefore cannot be considered ultimate clean-up options. Bioremediation is limited by a number of
technical difficulties such as nutrient transport and acclimation of microorganisms, among others. Few
contaminants can be effectively removed by soil washing. Accounting for all of these obstacles, there is
a necessity to develop new alternatives for in situ soil clean-up.
Electrokinetic processes treatment has emerged as a potential technique for in situ decontamination
of contaminated soils. This is the same process used previously by geological engineers to consolidate
foundations for construction.
Electrokinetic treatment is an in situ treatment process that is capable of
simultaneously transporting inorganic and organic compounds in porous media, including radionuclides.
The electrokinetically aided transport is based on well-known electrokinetic processes primarily com-
posed of electroosmosis, electrophoresis, and ion migration in wet soil. The two primary mechanisms
© 2001 by CRC Press LLC
that mobilize contaminants are (1) the movement of the charged species by electromigration or electro-
pheresis; and (2) the transport of contaminants by the advection of electroosmotic flow. The rate and
efficacy of these processes are dependent on the type of soil and contamination.
The treatment involves applying a low direct current (on the order of milliamps per square
centimeter of the cross-sectional area of the electrodes), or a low potential gradient (on the order of
a few volts per centimeter) between electrodes inserted in the soil. As a result, the contaminants are
transported toward the anode or cathode electrode sites by ionic or electrophoretic migration, and
electroosmotic advection. The contaminants are then removed at the electrode sites by one of several
different methods. These methods include electroplating, adsorption onto the electrode, precipitation
or co-precipitation at the electrode, pumping near the electrode, complexing with ion exchange resins,
or capturing in reactive permeable barriers.
While electroosmosis is analogous to soil washing, electromigration is the primary mechanism of
electrokinetic transport when the contaminants are ionic or surface charged (Acar et al., 1989; 1990;
Pamukcu and Wittle, 1992a; b; Probstein and Hicks, 1993; Reddy and Parupudi, 1997). Past experience
with electrokinetic process in contaminated porous media has shown that the process is most effective
when the transported substances are dissolved in the pore fluid, surfaces charged, or in the form of small
micelles with little drag resistance (Electorowicz and Boeva, 1996; Hamed et al., 1991; Pamukcu and
Wittle, 1992a; 1993a; b; Pamukcu et al., 1995b; 1997; Pamukcu, 1994; Pamukcu and Pervizpour, 1998).
Background
Overview
Research in electrochemical treatment for the purpose of restoring contaminated subsurfaces has accel-
erated in the past two decades. Some of the currently researched methods of electrochemical treatment
are referred to as electrokinetic extraction, electrokinetic barriers, electrobioremediation, electrostabili-
zation (injection), and electrocontainment. Earlier work in the mid-1970s and early 1980s focused on
utilizing the technique for soil densification to improve performance of containment facilities. Later,
studies focused on the effects of electrolysis soil chemistry and the use of electrokinetics for contaminant
removal from soils. Most of this work was conducted on the laboratory scale and some on the pilot scale.
The first field study was published in 1988 (Banerjee et al., 1988) as a feasibility study of potential
application of electrokinetics for chromium removal from subsurfaces.
Research in 1989 first showed the importance of the process-generated pH gradients between anode and
cathode. In the same year, field applications attempted to alleviate the effects of the pH gradients by
controlling the chemical environment around the electrodes. In 1991, the effects of speciation and precip-
itation on the efficiency of electrokinetic transport of metal ions through soil were presented. Since the
early 1990s, numerous laboratory studies have substantiated the applicability of the technique to a wide
range of contaminants in soils. Among the contaminants shown to react to electrochemical treatment in
the laboratory and some in the field are non-aqueous phase liquids such as chlorinated hydrocarbons,
mononuclear aromatic hydrocarbons (MAHs), polynuclear aromatic hydrocarbons (PAHs), phenols, sul-
furous, and nitrogenous compounds, and heavy metals. More recently, integrated methods of soil restoration
that rely on electrochemical technology as well as other technologies (e.g., bioremediation, funnel-and-gate,
and reactive membranes) have been introduced; and some have been demonstrated in the field, such as the
Lasagna Soil Remediation project (Ho et al., 1995). Furthermore, powerful analytical models and their
numerical solutions have been developed; this has helped to better understand the underlying mechanisms
of transport of single and multiple ionic species under constant or transient electric fields.
These laboratory studies have clearly shown that electrochemical treatment is a powerful in-situ process
that can be used to simultaneously treat inorganic and organic compounds in porous media. However, the
technology must be used judiciously in the field because each contaminated site is unique. The application
must be engineered to site specifics and the treatment steps must be sequenced properly for an optimum
solution. Soils are heterogeneous, silty, and contain fine metallic oxide and colloidal organic and inorganic
© 2001 by CRC Press LLC
substances. In field situations, the contaminants are often found adsorbed onto soil surfaces, iron oxide
coatings, soil colloids, and natural organic matter, or retained in clay interstices as hydroxycarbonate
complexes, or in the form of immobile precipitates in soil pore throats and pore pockets. It is now well
recognized that the contaminated soil becomes dynamically complex under an applied electrical potential.
The solid and liquid components of the soil are reactive, which allows complex electrochemical reactions
to take place. Given such conditions, it may be preferable to base the treatment on a phenomenological
approach using site-specific information rather than on analytical models of well-controlled systems.
Historical Development
In 1808, Reuss observed electrokinetic phenomena when a dc current was applied to a clay-water mixture.
Water moved through the capillary toward the cathode under the electric field. When the electric potential
was removed, the flow of water immediately stopped. Napier (1846) distinguished electroosmosis from
electrolysis; and in 1861, Quincke found that the electric potential difference through a membrane
resulted from streaming potential. Helmholtz was the first to treat electroosmotic phenomena analytically
in 1879. A mathematical basis was provided by his work. Pellat (1904) and Smoluchowski (1921) later
modified it to apply to electroosmotic velocity. Out of this treatment of the subject, the well-known
Helmholtz-Smoluchowski (H-S) theory was developed. The H-S theory deals with the electroosmotic
velocity of a fluid of certain viscosity and dielectric constant through a surface-charged porous medium
of electrokinetic potential (zeta,
ζ
), under an electric gradient. The H-S equation is:
(3.1.1)
where,
u
eo
= Electroosmotic velocity
ε
= Dielectric constant of pore fluid
ζ
= Zeta potential of soil particles
µ
= Viscosity of fluid
∂φ
/
∂
x = Electric gradient (field strength)
It must be noted that Eq. (3.1.1) is valid only for large pores in which the electrical double layer is small
compared with the pore radius, and all the mobile charge is assumed to be concentrated near the pore wall.
In 1939, Casagrande demonstrated that applying electro-osmosis to soils with high water content caused
such an increase in the effective stress that the gain in shear strength kept steep slope cuts remain stable.
Casagrande indicated that small reductions in water content by electroosmosis could produce significant
increases in soil strength. Since then, electrochemical treatment of soils has been investigated and used in
many field projects, including improvement of excavation stability, electrochemical hardening, stabilization
of fine-grained soils, consolidation, and densification. In the late 1960s and early 1970s, direct current was
successfully applied to recover residual oil from deep-seated geological formations (Enhanced Oil Recovery)
(Waxman and Smits, 1967; Amba et al., 1964). Utilization of direct current to drive contaminants out of
the soil pores started in the late 1970s and early 1980s. Segall and co-workers reported detection of high
concentrations of metals and organic compounds in electroosmotically drained water of a dredged sludge
in the field in 1980. Since then, successful applications of the electrochemical decontamination technique
have been demonstrated on pure soil-contaminant mixtures in the laboratory by numerous researchers
(Pamukcu et al., 1990; 1995; 1997; Hamed et al., 1991; Bruell et al., 1992; Acar et al., 1992; 1994; 1995;
Probstein and Hicks, 1993; Runnels and Wahli, 1993; Ugaz et al., 1994; Hicks and Tondorf, 1994; Eykholt
and Daniel, 1994; Pamukcu, 1994; Yeung et al., 1996; Alshawabkeh and Acar, 1996a; b; Dzenitis, 1997).
Theoretical Aspects
Electrokinetic phenomena in a porous medium are based on the relative motion between a charged
surface and the bulk solution at its interface (Adamson, 1986; Hunter, 1981). The formation of an electric
u
eo
ες
µ
φ∂
x∂
=
© 2001 by CRC Press LLC
double layer at the charged surface of clay particles explains these electrokinetic phenomena of interest:
electroosmosis, electrophoresis, and electromigration.
The Electric Double Layer
Consider a negatively charged clay particle surface in contact with a water solution of ions. The attraction
of counter ions and repulsion of co-ions, when combined with the diffusion along concentration gradients
and the mixing by random thermal motion of the ions, leads to the formation of an electric double layer
(Gouy, 1910; Chapman, 1913).
According to Stern (1924), the electric double layer is composed of a fixed layer (Stern layer) and a
diffuse layer (Gouy layer). In the Stern layer, the ions are assumed to oscillate about fixed adsorption
sites, whereas in the diffuse layer, ions are assumed to undergo Brownian motion. In a porous plug of
clay, the surface becomes negatively charged when wetted with water. This charge is balanced by the
adjoining Stern and Gouy layers, which carry the positively charged ions. The thickness of the Stern layer
is approximately the radius of a hydrated cation adsorbed on the clay particle surface. The Stern and
Gouy layers are divided by three planes: one is the plane of the claywater interface; the second is the
outer Helmholtz plane (OHP); and the third is the plane of shear. The OHP is the plane that defines the
outer limit of the Stern layer, the layer of positively charged ions condensed onto the clay particle surface.
The drop in potential in the Stern layer is linear from the surface potential of
ψ
o
to
ψ
d
at the OHP. The
plane of shear is the plane at which the mobile portion of the diffuse layer can slip or flow past the
charged surface. The potential at this shear plane is referred to as the electrokinetic potential, or zeta (
ζ
)
potential. The potential distribution in the diffuse layer is given by the Poisson-Boltzmann equation,
which describes an exponential fall of the potential.
ψ
x
= ψ
o
e
κ
x
(3.1.2)
where
κ
= Reciprocal thickness of the diffuse double layer
Ψ
x
= Potential at distance x from the OHP or surface
Ψ
o
= Potential at the OHP or surface
Integrating the Poisson-Boltzmann equation with appropriate boundary conditions will provide the
thickness of the diffuse layer, which is indirectly related to the ionic concentration in the bulk solution
and the valence of the counter-ions.
(3.1.3)
where:
e =Electron charge
k = Boltzmann constant
z
i
=Ionic charge or valence
n
i×
= Ionic concentration in the bulk solution
Electrophoresis
Electrophoresis is defined as the migration of charged colloids in a solid-liquid mixture under an electric
potential gradient. This migration is the movement of colloidal particles, not small ions. For clay-water
systems, if we place a direct current (dc) field across its suspension, negatively charged clay particles migrate
toward the anode. The unrestrained particle transport through water in a poorly consolidated system will
likely compact the soil to the anode and disintegrate it on the cathode side. In a compact system of a porous
plug, electrophoresis is of less importance due to the restrained solid phase. But in the process of soil
decontamination under direct current, electrophoresis of clay colloids could still play an important role if
the migrating colloids have the toxic chemicals adsorbed onto them. This was demonstrated by Grolimund
et al. (1996), who showed strongly sorbing lead was transported by mobile colloids.
κ
Qe
2
εkT
z
2
i
n
i ∞
i
∑
12/
=
© 2001 by CRC Press LLC
An important contribution of electrophoretic movement to contaminant transport may be when the
contaminants are in the form of colloidal electrolytes or ionic micelles. Micelle formation is promoted
as the concentration of the aggregating groups increases. Ionic micelles often carry a high charge and
exhibit high conductance in dilution. The conductance increases with increasing concentration owing
to buildup of charge with further aggregation. However, at a critical concentration, a sudden and sharp
decrease in conductance occurs that is attributed to (1) increasing association of the ionic colloids, which
results in increased fraction of neutral colloids; and (2) retarding inter-ionic forces. Evidence of micellar
transport was observed in a study by Pamukcu (1994), in which highly mobile anionic-surfactant micelles
facilitated the transport of nonpolar organic compounds toward the anode in the opposing direction of
electroosmotic flow.
Electroosmosis
Electroosmosis is the complement of electrophoresis. The latter involves discrete particle transport
through water, while electroosmosis is the transport of water through a continuous soil particle
network. The diffuse layer of water close to the solid surface contains an abundance of counter charges
(cations) to balance the surface charge deficiency. These counter charges are strongly held on the
surface and diffuse away toward the free water in the middle of the pore. The section referred to as
free constitutes the pore water that is free to flow under a hydraulic gradient. When an electric field
is applied, the surface or particle stays fixed, while the mobile diffuse layer moves, carrying the adjacent
water with it. The fluid on the surface is set into motion due to the electromigration of the cations
contained in it. As the cations start shearing toward the negative electrode, the thick fluid of the surface
layer is dragged along. The velocity of this motion is zero at the solid surface and maximum at the
plane of shear, which can slip or flow past the charged surface. This interface velocity sets the central
or free pore fluid in motion. It is not clear how the central portion moves, but it is usually assumed
to be viscous drag. The water molecules, being slightly positive because of dipolar fluctuations, may
also contribute to the movement of the central layer. The liquid transport in porous media by a
combination of these processes is known as electroosmosis.
In negatively charged clay particles, an abundance of cations in the diffuse layer generate a net water
flow toward the negative electrode (cathode). The ability of electroosmosis to produce a rapid flow of
water in a compact, low-permeability soil makes it a significant contributor to soil decontamination
processes by advection. Inside the soup of dissolved, suspended, and particulate matter residing in the
pore space, the charged species are expected to move independently through the fluid as long as there is
connectivity of the fluid phase. The others are carried or advanced to the next locale by the electroosmotic
flow of the fluid. During electroosmosis, diffuse layer charges are displaced and polarized in the direction
of flow, thus producing a potential difference between the electrode locations. This effect is called the
streaming potential, which may decrease the effect of electroosmosis by reversing the polarity in the soil.
Electroosmotic flow was shown to be independent of pore size distribution or the presence of macropores
(Acar and Alshawabkeh, 1993). Therefore, electroosmosis may be an efficient method to generate a
uniform fluid and mass transport in clayey soils. The relative contributions of electroosmosis and ion
migration to the total mass transport vary according to soil type, water content, types of ion species,
pore fluid concentration of ions, and processing conditions. Electroosmotic advection is most useful for
transporting contaminants in clays and low permeability soils because the electroosmotic conductivities
of clays are often several orders of magnitude higher than their hydraulic conductivities. Electroosmotic
advection is able to transport nonionic and nonpolar as well as ionic species through soil pores toward
the cathode. This is best achieved when the state of the material (dissolved, suspended, emulsified, etc.)
is suitable for the flowing water to carry it through the tight pores of soil without causing an immovable
plug of concentrated material to accumulate at some distance from the electrode.
In 1952, Schmid presented the following equation to explain the electrokinetic phenomenon in special
cases of very small pores, where it is postulated that the cations are uniformly distributed across the pore
cross-sectional area (Mitchell, 1970):
© 2001 by CRC Press LLC
(3.1.4)
In this equation, r is the pore radius, q is the volume charge density, and F the Faraday constant. It is
noticed that the flow is independent of the system pore size in the Helmholtz-Smoluchowski equation,
while, according to Schmid, the flow depends on the square of the mean pore radius. Meanwhile, neither
theory allows for an excess of electrolyte in the pores beyond the number of cations needed to balance
the negative surface charge of clay particles. In other words, the influence of the bulk electrolyte concen-
tration is neglected.
Esrig and Majtenyi, based on the attempt made by Oel in 1955 to unify the two previous theories,
have presented a simple equation that appears to include both the Helmholtz-Smoluchowski and Schmid
theories (Esrig and Majtenyi, 1966):
(3.1.5)
where
ρ
is the average mobile excess electric charge density and d is a parameter characterizing the double
layer. According to the authors, this equation can be used with any of the existing double layer theories;
it also permits the estimation of fluid velocities for a wide range of capillary sizes. A simplification of
Eq. (3.1.5) results in (Casagrande, 1949):
(3.1.6a)
(3.1.6b)
Q
eo
= k
e
i
e
A (3.1.6c)
in which Q
eo
represents the electroosmotic flow rate, k
e
the coefficient of electroosmotic permeability, i
e
= V/L the electrical potential gradient, and A the cross-sectional area of flow. The above equation is very
similar to Darcys equation for hydraulic flow through a soil column:
Q
h
= k i
h
A (3.1.7)
where i
h
is the hydraulic gradient, A the cross-sectional area, and k the permeability of the soil. However,
the hydraulic and electroosmotic permeability (k and k
e
, respectively) have different properties. The
electroosmotic permeability k
e
depends primarily on the pore area and is independent of the size of the
individual pores; k is very strongly influenced by the actual pore size (Casagrande, 1949). Casagrande
(1952) established that k
e
for almost all soils in which electroosmotic treatment is feasible varies within
only about one order of magnitude, with an average value of about 5
×
10
5
cm
2
V
1
s
1
. Thus, estimates
of flow rates can be made directly without using any of the kinetic models leading to Eqs. (3.1.6a),
(3.1.6b), or (3.1.6c), provided the value of k
e
, the electroosmotic water flow rate, can be predicted by
knowing A and i
e
.
Although Eq. (3.1.6c) describes the theoretical rate of fluid flow in a soil core under potential gradient,
there is some uncertainty associated with the effect of interfering factors such as the possible compression
of the double layer because of high salinity, loss of electrical energy through the electrolysis of water,
changing soil structure, and the reactions of electrode material with the chemicals in water (Ray and
u
eo
r
2
qF
8
µ
V
L
=
u
eo
1
2
1
d
r
+
r
2
µ
ρ
V
L
ln=
u
eo
Q
e
A
1
2
1
d
r
+
r
2
µ
ρ
ln
V
L
==
Q
eo
1
2
1
d
r
+
r
2
µ
ρ
ln
V
L
A=
© 2001 by CRC Press LLC
Ramsey, 1987). Significant implications of the electrochemistry associated with the electroosmosis process
may influence the efficiency of the remediation technique.
Spieglers friction model (1958) showed that electroosmotic water transport per unit electrical charge
increases with increasing cation: water ratio in the system. Experimental evidence of this theory has been
given by a number of researchers (Gray and Mitchell, 1967). An extension of the H-S theory considers
a portion of the electric current transported near the surface of or through the solid phase (Wiedemann,
1856). The resulting equation is often referred to as the current efficiency, (time rate of volume of water
flow per quantity of electricity), of the system:
(3.1.8)
where
Q
eo
= Electroosmotic flow rate
I =Current
r = Radius of the capillary
λ
0
= Specific conductance of the bulk liquid
λ
s
= Surface conductance of the capillary wall
Surface current is due to the ionic motion in the diffuse layer. In narrow capillaries with low ionic
concentrations, thus thick diffuse layers, a disproportionate fraction of the current flows in this layer due
to the low conductivity of the bulk fluid. Experimental evidence shows that the current efficiency, Q/I,
decreases with increasing ionic concentration in the bulk fluid (Wittle and Pamukcu, 1993). This can be
readily explained from Eq. (3.1.2) because
ζ
and
ε
/
µ
are expected to decrease, and
λ
0
to increase with
increasing ionic concentration of the bulk fluid. The surface conductance also changes with ionic con-
centration. As the ionic concentration in the bulk liquid increases, the diffuse double layer shrinks toward
the particle surface and the shear plane shifts away from the particle surface so that the majority of the
charge is now compensated by the immobile Helmholtz layer. Therefore, the charge density in the diffuse
layer decreases, giving rise to a lower surface conductivity,
λ
s
. As a result of this lowered conductivity, a
smaller portion of the current flows on the capillary surface. In contrast, in the presence of low ionic
concentrations, the diffuse double layer is swollen and much of the charge is compensated by the ions
in the diffuse layer. Therefore, the capillary surface conductivity is high and so is the fraction of the
current that is transported on the surface.
The significance of surface conductance on the prediction of electroosmotic flow as it relates to
contaminant migration was investigated by Khan (1991). He proposed a modified theory of electroos-
motic velocity of water through soil. In this theory, the true electroosmotic flow is directly proportional
to the current carried by the charged solid surfaces in soil. The soil is modeled as parallel resistances of
the soil surface and pore fluid, and the zeta potential used in H-S theory is replaced by the surface
potential,
ψ
d
, at the Outer Helmholtz Plane (OHP):
(3.1.9)
where
R
s
= Surface resistance of soil
I
s
= Surface current of soil
L =Length
With u
eo
/I
s
shown to remain fairly constant for clays of different surface conductivity and also pore fluid
electrolyte concentrations below 10
2
M, experimentally, Eq. (3.1.3) was further reduced to:
Q
eo
εςI
u λ
o
2
λ
s
r
+
–=
u
eo
εψ
d
µ
I
s
R
s
L
=
© 2001 by CRC Press LLC
u
eo
= K I
s
(3.1.10)
where
K ={
ε
ψ
d
/
µ
} R
s
/L = Constant
The modified theory basically emphasized that the surface conductivity of the porous compact medium
is the most essential precondition for electroosmotic water flow, thus uncoupling it from the water drag
component of the migrating ions in pore fluid of high ionic concentration. This theory is in agreement
with Spieglers theory of water: cation ratio, as well as Gray and Mitchells (1967) approach of a co-ion
exclusion principle based on Donnan theory of membrane equilibrium (1924). Additional evidence to
support this finding was presented by Pamukcu and Wittle (1992) for a variety of ion species, where the
ionic concentration effect on the measured current efficiency appeared to be most pronounced in clays
with high anion retention capacity. At the same concentrations of dilute solutions of electrolytes, kaolinite
clay with higher anion retention capacity (poor co-ion exclusion) showed consistently higher electroosmotic
flow than montmorillonite clay with lower anion retention capacity (good co-ion exclusion). This obser-
vation suggested that the anionic dragging of water toward the anode diminished the net flow toward
the cathode compartment in the montmorillonite clay.
The zeta potential in Khans (1991) model is defined at the outer limit of the Stern layer and to be a
constant surface potential that is invariant with respect to electrolyte concentration. Therefore, the true
electroosmotic flow becomes independent of electrolyte concentration in the pore fluid. Results reported
by Yin and co-workers (1995) support Khans theory. They found that there is no apparent relationship
between electroosmotic mobility and the applied electric field. The term electroosmotic mobility refers
to the average velocity achieved by the pore water relative to the solid skeleton, due to an externally
applied electrical field of unit strength. The mobility appeared to be proportional to the specific con-
ductance of the soil specimen. The mobile ions in the pore solution primarily come from the surface of
the clay particles; thus, a higher ionic concentration and hence a higher conductance for clay with a lower
initial water content are expected. For kaolinite, Yin et al. (1995) concluded that a mobility value of 0.6
×
10
4
cm
2
/s. volt and a specific conductance of 0.4 m.mho/cm are representative values, and they showed
these values do not vary appreciably under low electric field and constant water content. Based on the
above discussion, the electroosmotic flow velocity can be expressed as:
u
eo
= K′E (3.1.11)
where
K
′
= Constant (electroosmotic mobility)
E = Electric gradient (
∂φ
/
∂
x)
It should be noted that the electroosmotic mobility should not be treated as a phenomenological
constant. Electroosmosis velocity can be approximated by the Helmholtz-Smoluchowski equation (Eq.
3.1.1). According to Shapiro and Probstein (1993), for a typical water-saturated clay, with
ζ
potential of
10 mV, and an electric field strength of 100 V/m, the electroosmotic velocity has a value of 10
6
m/s or
~10 cm/day. Notably, this is at least 10 times lower than the electromigration velocity (Acar and Alsh-
wabkeh, 1993). Therefore, in ion-rich pore fluids, the electroosmotic transport of ions becomes negligible
compared with electromigration (Baraud et al., 1997).
It must be noted that the above derivations are mostly applicable for saturated porous media. Water
flow behavior of an unsaturated soil is totally different from that of a saturated system. In the presence
of an electrical field, a friction force is created when water molecules begin to move in the soil pores.
The frictional stress decreases as the thickness of the water layer increases. For an unsaturated soil-
water system, the water layer is extremely thin, usually ranging from 10
10
cm to 10
8
cm. Under such
circumstances, all water molecules exhibit strong frictional interaction with the soil surface. In the case
of a saturated water-capillary system, the radii of capillaries are relatively large, ranging from 10
1
cm to
10
3
cm. As a result, most capillary water molecules do not interact physically or chemically with the
© 2001 by CRC Press LLC
capillary wall (Yukawa et al., 1991). Recently, Chang et al. (2000) have proposed a semi-empirical equation
for the prediction of electroosmosis flow under unsaturated soil-water system based on the finite plate
model. They reported the following expression:
(3.1.12)
where K is a characterized coefficient (i.e., K = kfw/
µρ
2
Σ
2
). This characterized coefficient, K, collects
several physical properties of the soil-water system such as the fluid density (
ρ
), the specific surface area
(
Σ
), the width of the water layer (w), and the fluid viscosity (
µ
).
Electromigration
Electromigration, or ionmigration, is the primary mechanism of electroremediation when the contam-
inants are ionic or surface charged. Speciation and precipitation are major factors in mobilization and
transport of heavy metal constituents by the ionmigration component of electrokinetics. The speciation
is dependent on a number of fairly well-understood parameters, including pH, redox potential, and ion
concentration. These same factors influence the equilibrium conditions relating to both the soil and the
contaminants.
Charged ions moving toward the oppositely charged electrode relative to solution is called electro-
migration. In a dilute system or a porous medium with moderately concentrated aqueous solution of
electrolytes, electromigration of ions is the major cause of current conduction. Electromigration velocity
measures ion movement in the pore water caused by the electric field at infinitely dilute solutions:
(3.1.13)
where
u
m
= Electromigration velocity
z = Valence or charge of ion
F = Faraday constant
R = Universal gas constant
T = Absolute temperature (K)
D
*
= Effective diffusion coefficient of ion
The convective-diffusion equation used to describe the transport of a contaminant through porous
media is given by (Shapiro et al., 1989):
(3.1.14)
where for each species i, c
i
is the concentration in moles per unit of volume, D
i
the diffusion coefficient,
τ
the experimental tortuosity factor, u
e,i
the electromigration velocity in the x direction, U
c
, the convection
velocity in the x direction, and R
i
the molar rate of production due to chemical reactions.
The electromigration velocity u
e,i
is represented by:
U
e,i
= U
m
/τ
2
(3.1.15)
where R, T, z
i
, F, and
φ
are the gas constant, temperature in units of Kelvin, charge number, Faraday
constant and electrical potential, respectively.
The convection velocity, or electroosmotic velocity, can be written as:
Q
eo
k'
σ
e
V
L
ϖm
ρ
2
Kσ
e
V
L
ϖ
2
==
u
m
zF
RT
D
∗
φ∂
x∂
–=
C
i
∂
t∂
D
i
τ
2
∂
2
C
i
∂x
2
∂
∂x
C
i
u
ei,
u
c
+
()[]
– R
i
+=
© 2001 by CRC Press LLC
(3.1.16)
where
ε
,
ζ
, and µ are the dielectric constant of the liquid, zeta potential of the solid surface, and viscosity
of the liquid, respectively. The applied electrical field ¹
φ
/¹x necessary for the calculation of the electromi-
gration and convection velocities is assumed constant in this model development. The zeta potential is
strongly influenced by the chemical conditions of the system, such as pH and ionic concentration;
therefore it cannot be taken as a single average value.
To incorporate the retardation factor (adsorption) to the governing equation, the linear isotherm is
used in this model. Among the various equilibrium adsorption isotherms, the linear isotherm is the
simplest and can be applied to systems in which the adsorbate concentration is much below the saturation
limit of the surface sites available. The governing equation then becomes:
(3.1.17)
where K
d,i
is the distribution coefficient and C
i
t
is the sum of the amount of species i adsorbed and in
solution. It is observed from the above equation that the rate of transport of species i is decreased by a
factor of by adsorption.
In the case of weak acids, it is also necessary to consider the chemical equilibrium reaction:
HA ⇔ H
+
+ A
(3.1.18)
where HA and A are the protonated and deprotonated acids, with equilibrium constant, K
a
, respectively.
The governing equation for the transport of a weak acid is then written as:
(3.1.19)
where [HA]
t
is the sum of [HA], [A
], and [HA]
ads
; and u
e, HA
is defined as:
(3.1.20)
Moreover, it is assumed that the diffusion coefficient for the undissociated acid molecule, D
HA
, is approx-
imately equal to that for the dissociated ion, D
A
:
D
HA
ÝD
A
(3.1.21)
Laboratory Studies
Electrokinetic Extraction
Electrokinetic extraction is analogous to soil washing, whereby the contaminant is extracted from the
soil and subsequently collected in aqueous phase in a collection well or deposited at the electrode site.
The alkali metals (e.g., Na(I), K(I), and Cs(I)), and alkali earth metals (e.g., Sr(II) and Ca(II)) tend to
remain ionic under a wide range of pH and redox potential values; therefore, they are expected to
electromigrate and be extracted from soils readily unless they become preferentially sorbed onto solid
surfaces and clay interstices. Under ideal conditions, the predominant cation and its accompanying anion
u
c
εζ
τ
2
µ
∂φ
∂x
=
∂C
i
t
∂t
1
1 K
di
,
+
D
i
τ
2
∂
2
C
i
t
∂x
2
∂
∂x
C
i
t
u
ei,
u
c
+
()[]
–
=
1
1
K
di,
+
∂ HA[]
t
∂t
1
1 K
a
+
D
HA
τ
2
∂
2
HA[]
t
∂x
∂
∂x
HA[]
t
u
eHA,
u
c
+
()[]
–
=
u
eHA,
1 K
a
+
()
A
–
[]u
eA
–
,
HA[]
t
=
© 2001 by CRC Press LLC
may be caused to separate efficiently by electromigration only, for which little or no electrosmotic water
advection may be necessary. Small anions such as chloride and thiosulfate are so mobile that they can
migrate toward the anode despite a strong electroosmotic flow toward the cathode.
Most of the work reported in the literature to date has concentrated on the mobilization and extraction
of the heavy metal contaminants by applying an electric field to a contaminated soil. As discussed above,
extraction of contaminants by electrokinetic methods is based on the underlying assumption that the
contaminant is in the liquid phase of the soil pores. A majority of the past research on electroremediation
of contaminated soils has focused on the feasibility of transport and removal of mixed contaminants
from pure clay, or synthetic reference soil matrices.
As an example, results of electrokinetic treatment of 11 selected metals in five different combinations
of synthetic soil and pore fluids were reported by Wittle and Pamukcu (1993). These tests were performed
using the Lehigh Electrokinetic (EK) test cells described below. The classes of metals included cations
(Cd(II), Hg(II), Pb(II), Ni(II), Zn(II)), surrogate radionuclides (Co(II), Ce(III, IV), Sr(II), U(V)), and
anions (HAsO4
, Cr
2
O
7
2
). Five soil types were studied: kaolinite clay (KS), Na-montmorillonite clay
(MS), sand with 10% Na-montmorillonite (SS), k
aolinite clay with simulated groundwater (KG), and
k
aolinite clay with humic solution (KH). Table 3.1.1 summarizes results of all heavy metals removal from
soil samples (3 in. long) tested (from the anodic chamber for the cationic species, and from the cathodic
chamber for the anionic species) under a constant voltage of 30 V in 24 hr. As observed, the removal
(percentages) of a number of metals tested in these synthetic soil samples were fair to good. This was
mostly due to the low soil pH attained (on the order of 2 to 3) during the electrokinetic processing of
these synthetic matrices, which helped to keep the metals away from the soil surface, in solution, and
thus migratory or readily transportable (Acar, et al., 1989; 1991; Shapiro et al., 1989).
In natural soils
with high buffering capacity and carbonate content, or those that are under the ground-
water table, pH often remains neutral or basic, which inhibits the solubilization and thus transport of most
metals to a collection well. Complete removal of those metals that possess complex aqueous and electro-
chemistry, and the tendency for speciation and forming hydroxide complexes, is particularly difficult under
variable pH and redox conditions. In field applications, the electrokinetic treatment may need to be
augmented by washing the soil with an appropriate conditioning fluid to ensure a high degree of solubility.
The organic compounds are transported by electroosmotic advection if the compound remains
poorly sorbed and non-ionized during the process. If the concentration of such an organic compound
TABLE 3.1.1 Percent Removal of Heavy
Metals from Clays and Clay Mixtures by
Electrokinetic Treatment
Soil Type
a
Metal KS KG KH MS SS
As(V) 54.7 56.8 27.2 64.3 54.7
Cd(II) 94.6 98.2 92.7 86.6 98.0
Co(II) 92.2 93.9 95.9 89.4 97.5
Cr(VI) 93.1 94.8 97.6 93.5 96.8
Cs(I) 71.9 80.1 74.7 54.7 90.5
Hg(II) 26.5 13.1 42.5 78.3
Ni(II) 88.4 95.4 93.9 93.6 95.9
Pb(II) 69.0 75.2 66.9 83.0
Sr(II) 97.8 99.5 96.0 92.3 99.0
U(V) 79.3 84.3 67.4 39.8 33.0
Zn(II) 54.6 43.3 36.3 64.4 54.5
a
KS: kaolinite; KG: kaolinite and simulated
groundwater; KH: kaolinite and humic sub-
stances; MS: montmorillonite; SS: clayey sand.
From Wittle and Pamukcu, 1993.
© 2001 by CRC Press LLC
(i.e., o-nitrophenol) in pore space is known, then the rate of electroosmotic flow can be used to predict
the rate of transport of the compound (Khan, 1991). Ionizable organic compounds, or those treated
with ionic surfactants, may form micelles that would tend to electromigrate. The size of the micelles
may limit their advective transport due to large viscous drag; however, the large electric charge they
often carry promotes their electromigration despite the opposing direction of electroosmotic flow
(Pamukcu, 1994).
EK Test Cells
Several laboratory EK test cells have been reported in the literature. The Lehigh EK test cell consists of
a soil container and two water reservoirs that house the electrodes on each side of the container. The
reservoirs are connected to the measuring burettes to monitor the inflow and the outflow at the reservoirs.
Figure 3.1.1 presents a schematic of the Lehigh EK test cell. The soil container, or sample tube, has an
ID of 2.7 cm and a length of 10.2 cm and is made of clear glass tube with threaded ends. The tube
accommodates three auxiliary graphite electrodes (1 mm in diameter), separated at equal distance along
one side, through which voltage can be measured during experiments. The tube is attached to the
electrode chambers with O-rings placed inside the housings cut on the inner walls (facing the sample
tube) of the chambers. Porous dividers made of glass frit are placed at each end of the sample tube to
hold the soil sample in place during the experiments. The electrode chambers are approximately 175 cm
3
in volume. They house the electrodes at each end of the soil sample tube. These chambers are removable
for filling and emptying of fluid and also to facilitate cleaning after each test run. Teflon couplers are
used to attach the soil sample tube to the electrode chambers at each end. Electrode assemblies with a
surface area of 22.6 cm
2
facing the soil specimen are constructed of graphite rods with a 0.635-cm diameter
held together with conductive adhesive. Dedicated electrical units for each electrokinetic cell consist of
a variable dc power supply capable of applying either constant voltage (0 to 120 V) or constant current
(0 to 1500 mA). These units also contain analog meters for measuring voltage and current. Teflon or
stainless steel quick-connections are provided on the back wall of the electrode chambers. These outlets
or inlets are then connected to volume measuring tubes via Teflon tubing. Gas expulsion or liquid
extraction/injection ports are provided on the top of each electrode chamber. These valves have metal
surfaces that are coated to control any deterioration by electrochemical reactions or metal ion deposition
on them. Sample extractions or fluid injections are accomplished using a volumetric syringe that allows
for accurate control of quantities of fluids. Glass burettes with a capacity of 25 cm
3
are used to measure
inflow, normally at the anode (positive electrode) chamber, and outflow, normally at the cathode (negative
electrode) chamber to an accuracy of 0.1 cm
3
. The specific techniques used to operate this equipment
have been adequately discussed elsewhere (Wittle and Pamukcu, 1993; Pamukcu, 1994).
Electrokinetic Extraction
Sodium chloride (NaCl)
Figures 3.1.2 and 3.1.3 show extraction of sodium (Na) and chloride (Cl) from drilling mud soil samples
of different water saturations. The final pH profiles attained at the end of the tests are superimposed. As
observed in Figure 3.1.2, close to 100% recovery of the Na is accomplished in the 81% saturated specimen
(S1) at the termination of the test, while about 70% of Na is recovered for the 53% saturated specimen
(S2). The specimen designated S1 shows a substantial recovery of Cl in the anode chamber (Figure 3.1.3),
although not as high a recovery as Na. The analysis showed little or no presence of Cl in the soil, which
suggested the inability to account for all the Cl transported to the anode chamber. This result was attributed
to formation of gaseous chlorine, which would have been ventilated from the anode chamber periodically.
In sufficiently acidic solutions having high Cl
concentrations (pH below approximately 4), oxidation of
chloride ion will lead to the formation of gaseous chlorine (Pourbaix, 1974). This oxidation can be brought
about chemically or electrolytically, as would be the case in the anode chamber of the EK cell where oxygen
is generated.
© 2001 by CRC Press LLC
Perchlorate
The soil and local water samples received from an industrial facility site in California were tested in
Lehigh EK cells to evaluate the feasibility of removing perchlorate from the soil by electrokinetic treat-
ment. The laboratory test specimens were prepared by mixing the samples of soil and water to a 25.7%
water content by dry weight, which was then packed into the soil chambers of the EK cells at a bulk
density of 2.8 g/cm
3
, and void ratio of 0.6.
Two tests were conducted in parallel, one of which served as a control test (i.e., with no electrical
current). In the treatment cell, the soil was subjected to a constant 30 V across the electrodes. The current
FIGURE 3.1.1 Schematic of the Lehigh electrokinetic (EK) test cell. (Reprinted from J. Haz. Mat., 55, Pamukcu,
S., Weeks, A., and Wittle, J.K., Electrochemical separation and stabilization of selected inorganic species porous media,
305318, copyright 1997, with permission from Elsevier Science.)
FIGURE 3.1.2 Post electrokinetic treatment distribution of Na in drilling mud soil of various initial water saturation
degrees (S1, S2, S3). (Reprinted from J. Haz. Mat, 55, Pamukcu, S., Weeks, A., and Wittle, J.K., Electrochemical
separation and stabilization of selected inorganic species porous media, 305318, copyright 1997, with permission
from Elsevier Science.)
gas expulsion port
teflon
adaptors
soil
porous stone
water
connection
power
connection
electrode
anode
auxiliary
electrode
cathode
0
0.2
0.4
0.6
0.8
1
0
2
4
6
8
10
12
14
ANODE
0
0.25
0.5
0.75
1
CATHODE
Normalized Distance From Anode End
S1 = 81% ; PVF = 2.3
S2 = 53% ; PVF = 0.4
S3 = 65% ; PVF = 0.1
pH
Fraction of Na
pH
Sodium Migration to Cathode Chamber
(3 samples of different saturation)
© 2001 by CRC Press LLC
density varied from a maximum of 1 mA/cm
2
to a minimum of 0.006 mA/cm
2
. Current peaked to 1
mA/cm
2
at 24 hr of treatment, and dropped down to less than 0.01 mA/cm
2
by the end of the fourth
day of treatment. This signaled depletion of most current carriers (i.e., ions in solution) in the soil. The
electrolytic gases generated in the electrode chambers were minimal due to the low current density
achieved. The soil electrical potential gradient also showed a systematic decrease, from about 8 V across
the two ends of the soil sample to 1 V by the end of the treatment.
Close to 100% of the initial mass of the perchlorate (the initial perchlorate concentration of the wet soil
was 840 mg/kg) was removed from the soil by the end of 7 days of electrokinetic treatment. The control
specimen showed less than 30% removal by diffusion for the same duration. The rate of electrokinetic
removal was significantly faster for the first 3 days of treatment, by the end of which 80% of the initial mass
of perchlorate was removed. The soil remained conductive, even after the current carriers in the pore fluid
were depleted. The ratio of moles of perchlorate removed to moles of electrons transferred reached a
maximum of 11% and ceased to increase once the current carriers were depleted. The lower ratio was
attributed to the presence of co-ions in the pore solution with higher transference numbers.
Electroosmotic flow of water continued in the positive direction (from anode to cathode) for the first
8 days of treatment, but reversed direction afterward. The quantity of flow in the reverse direction was
only a fraction of the initially observed flow. The average electroosmotic equivalent hydraulic conduc-
tivity, k
eh
, was computed as 1
×
10
5
cm/s, and the electroosmotic permeability k
eoh
as 1.7
×
10
5
cm
2
/s/V.
Electroosmotic flow had no significant effect on the perchlorate removal rate, because most of the flow
occurred in the opposite direction of perchlorate migration (i.e., toward the anode).
The perchlorate mass accumulations in the anode and cathode chambers of the test and control samples
are shown in Figure 3.1.4. Figure 3.1.5 shows the mass fraction distribution of perchlorate in the test
and control soils and their adjacent liquid chambers at the end of the treatment. In the test sample,
approximately 92% of the perchlorate was removed to the anode chamber, while the remaining 8% was
diffused into the cathode chamber. The residual amount of perchlorate measured in the post-treatment
soil was less than 0.2%, and therefore not evident on the graph. In the control sample, less than 30% of
the perchlorate diffused into the adjacent liquid chambers for the same duration of time. It is noted that
FIGURE 3.1.3 Post electrokinetic treatment distribution of Na in drilling mud soil of various initial water saturation
degrees (S1, S2, S3). (Reprinted from J. Haz. Mat., 55, Pamukcu, S., Weeks, A., and Wittle, J.K., Electrochemical
separation and stabilization of selected inorganic species porous media, 305318, copyright 1997, with permission
from Elsevier Science.)
0
0.2
0.4
0.6
0.8
1
Fraction of Cl
0
2
4
6
8
10
12
14
pH
ANODE 0 0.25 0.5 0.75 1 CATHODE
Normalized Distance From Anode End
S1 = 81%; PVF = 2.3 S2 = 53%; PVF = 0.4
S3 = 65%; PVF = 0.1 pH
Chloride Migration to Anode Chamber
(3 samples of different saturation)
© 2001 by CRC Press LLC
perchlorate accumulation in the test cathode is lower than in the control cathode. This result confirmed
that electromigration of the anion inhibited its accumulation in the chamber containing the negative
electrode (cathode).
Ammonia
The processed municipal sludge by N-Viro Soil technique produces a Ca-rich material, a potentially
inexpensive source of calcium for cement production. The fresh N-Viro soil gives out ammonia (NH
3
(g))
as a by-product of the process, which is to be mitigated prior to possible handling by the cement industry.
Electrokinetic extraction was proposed to reduce the excess ammonia in N-Viro soil.
The N-Viro soil and leachate liquid samples were retrieved from a utilities authority plant in New
Jersey. The visual and textural observation of the N-Viro soil indicated a material of fine sand to silt size
with little plasticity. The leachate was a brown-colored liquid. Upon arrival, the leachate was acidified to
arrest NH
4
+
in the liquid, and thereby preserve the original concentration of the substance. The soil
material, however, was not treated. The test soils were prepared by mixing the N-Viro soil with the
leachate at the reported water content of approximately 40% by total weight, or 65% by dry weight.
FIGURE 3.1.4 Cumulative perchlorate mass removed.
FIGURE 3.1.5 Post-treatment distribution of mass fraction of perchlorate.
Perchlorate Removal by EK
Mass vs. Time
0
50
100
150
0 100 200 300 400 500
EK Treatment Duration, hrs
Cumulative Perchlorate
Mass, mg
Test anode Control anode Test cathode Control cathode
0
0.2
0.4
0.6
0.8
1
EK Test Control
EK Test
0.91985 0.00014 0.00042 0.00059 0.0003 0.07873
Control
0.11779 0.17626 0.17626 0.17626 0.17626 0.1772
Anode
1/4
Anode
2/4
Anode
3/4
Anode
4/4
Anode
Cathode
Mass Fraction of Perchlorate
Soil
Original distribution in soil
© 2001 by CRC Press LLC
The laboratory experiments consisted of packing the N-Viro soil in the Lehigh EK cells and applying
a constant 30 Vdc across the electrodes for the duration of treatment. The voltage gradient measured in
the soil was approximately 0.3 V/cm. This voltage gradient was consistent with measurements in previous
tests of similar materials (i.e., saturated loose clayey sand soils).
The inflow and outflow reservoirs were filled with tap water. The rate of effluent discharge was
monitored (at cathode and anode) and the tests continued until a substantial decrease in either the
current or rate of discharge was observed. At the termination of each test, the soil was sampled at four
points along its length and analyzed for moisture content, pH, and NH
4
+
concentration distribution.
Figure 3.1.6 shows the post-EK distribution of mass fraction and the measured concentration of NH
4
+
along the soil sample and the anode and cathode liquid chambers. The mass fraction determination
showed that more than 50% of the substance was unaccounted for and therefore a mass balance could
not be completed properly.
In the two tests conducted, a larger fraction of ammonia was found in the anode chamber. Judging
from the distribution of pH in the soil and in the electrode chamber liquids, at the low pH of about 4,
the ammonia in the anode chamber should be in the form of ammonium ion. In the cathode chamber,
where the pH is well above 9.3, the ammonium is converted to uncharged ammonia (NH
3
). The solubility
of ammonia is fairly low in water (Henrys constant, K
H
= 57.6 mol/L.atm). Therefore, the ammonia
removed to the cathode would have converted to gaseous ammonia and readily escaped into the head
space of the chamber. A strong ammonia smell was detected when the trapped gases were released
periodically at the cathode reservoir. The inability of the equipment set-up to collect and provide mass
measurement of the released gases was the main reason for the unaccounted ammonia in the form of
gas. The portion of ammonia that was collected in the anode chamber is probably due to colloidally
enhanced transport, whereby the positive NH
4
+
ion is transported toward the positive electrode by
electromigrating colloids. Charged colloids are known to strongly adsorb ions of opposite charge and
enhance transport of these substances in porous media (Grolimund et al., 1996).
Overall, the concentration of ammonia in the soil samples was reduced from about 150160 mg/kg
to less than 6 mg/kg in all samples tested. The tests were conducted for approximately 200 hr. (8 days).
The results of the experiments presented above indicate that the transport occured primarily by electro-
migration of the ammonium ion and partly by colloidal transport, and it was relatively independent of
the quantity or rate of liquid flow through the sample.
The rate of migration of charged particles or ions is dependent on the applied electrical field strength,
localized concentration of the substance, the size of the particle, and the tortuosity of the porous
medium. The rate of transport by electromigration is significantly higher than that of water advection
FIGURE 3.1.6 Post electrokinetic distribution of NH
4
in processed municipal sludge soil.
© 2001 by CRC Press LLC
by electroosmosis. Prior experience with electromigration of soluble metal ions in tight porous clay
media showed close to 100% extraction of the metal in a few hours of treatment under 30 Vdc field
strength (Pamukcu and Wittle, 1992; 1993; Pamukcu et al., 1997). These observations warrant the
conclusion that NH
4
+
migration would have occurred at those similar rates per volt of field strength.
Electrokinetic Stabilization
When extraction becomes ineffective or infeasible, electrochemistry can still be useful to stabilize and/or
contain certain groups of metals and some organic compounds in the ground. In terms of environmental
restoration, stabilization is defined as fixing the toxic substance in place, thereby rendering it less likely
to move elsewhere under ambient hydrogeological conditions. Electrochemical stabilization can be
accomplished by delivering an appropriate oxidizing or reducing agent to the contaminant in the soil
that subsequently will (1) degrade the contaminant, (2) change it to a nontoxic or immobile species, or
(3) enhance stable sorption and incorporation of the contaminant into the clay minerals. Zero-valent
iron enhanced degradation of TCE (Ho et al., 1995), and Fe(II) degradation of toxic Cr(VI) to less toxic
and less mobile Cr(III) are examples of such processes (Haran et al., 1995; Pamukcu et al., 1997).
The category of metals that could be altered in such a manner are those that are least likely to be
extracted by electrochemical treatment. Metals such as Cr, As, and Hg, owing to their complex electro-
chemistry or perhaps strong interaction with the soil constituents, are possible candidates for electro-
chemical containment. Depending on their initial state of speciation and age of interaction with the host
soil, Pb, Cu, Mn, and Zn may also be contained in the soil to a certain degree of permanence and/or
reduced toxicity. A good example of electrochemical stabilization may be the relatively well-studied
reduction of Cr(VI) to Cr(III), by delivering iron (Fe(0), Fe(II), or Fe(III) with co-reagents) in aqueous
environments (Powell et al., 1995; Eary and Rai, 1991). In soils, chromium exists in two possible oxidation
states: trivalent Cr(III) and the hexavalent Cr(VI). At low pH conditions (2 to 6.5) the predominant
form of the hexavalent chromium is chromate or dichromate ion. Due to their negative charge, these
anions remain in soil pore water and are readily transported. This was observed in an earlier study by
successful removal of the chromate ion with electrokinetic migration in the opposite direction of water
flow (Pamukcu and Wittle, 1992). However, at sufficiently low pH, the soil surface sites may become
positively charged and tend to retain and accumulate anions such as chromate. Therefore, complete
removal may not be achieved unless precise control of pH is maintained during an electrokinetic process.
Figure 3.1.7 shows a good example of such an experiment where only a small mass of Cr is removed
with increasing duration of treatment and applied current.
Cr(VI) can be reduced to Cr(III) under normal soil and pH conditions, for which soil organic matter
acts as the electron donor (Rai et al., 1987; Bartlett, 1991) reported that in natural soils, this reduction
may be extremely slow, requiring years. In subsurface soils where there is less organic matter, the Fe(II)
FIGURE 3.1.7 Accumulation of Cr in anode and cathode chamber of the EK cell with time and increased current.
Total Chromium (Cr) in Liquid Samples
0.0
1.0
2.0
3.0
0.0 200.0 400.0 600.0 800.0
Elapsed Time (hour)
Cr Concentration
(ppm)
Anode (actual)
Anode (control)
Cathode (actual)
Cathode (control)
i=0.24 mA
i=0.41 mA
i=0.55 mA
© 2001 by CRC Press LLC
containing minerals reduce Cr(VI) at pH less than 5 (Eary and Rai, 1991). Electrochemically injected
Fe(II) into a matrix of soil containing Cr(VI) should facilitate the reduction of Cr(VI) because the
electrochemical process produces low pH conditions. The delivery of Fe(II) has also been shown to
enhance formation of a chromium-iron hydroxide solid solution [(Cr
x
Fe
1-x
)(OH)
3
(ss)], which has a lower
equilibrium solution activity than pure solid phases (Powell et al., 1995).
Electrokinetic Containment
Containment can be defined as causing controlled accumulation of the toxic substance by sorption in a
small volume of substrate. Electrochemical containment can be accomplished by causing the electromi-
gration or electroosmotic transport of the contaminants to reactive permeable barriers strategically
situated between the electrodes, where they are attenuated and the filtered water is allowed to pass through
(Hansen, 1995; Weeks and Pamukcu, 1999). In actual field applications, such permeable structures could
be installed at various positions throughout a contaminated site, serving as primary and secondary
treatment locations. Such structures are referred to as reactive permeable barriers (Rael et al., 1995;
Blowes et al., 1995). The basic idea behind these reactive barriers is to allow the flow to advance the
contaminant plume through an in situ structure containing a substance that will react with the contam-
inant. When a directed flow of contaminants by electroosmosis or electromigration enters a permeable
bed of sorbent material situated in the path of the flow, the water may be filtered sufficiently, depending
on the rate of flow through the bed as well as the attenuation characteristics of the bed.
It should be noted that these two processes stabilization and containment should be regarded
as interim or pretreatment processes to permanent treatment technologies, since these too would require
ex situ treatment of the contaminant at a later time. For example, Cr may still be required to be taken
out of the ground if it is transported from the stabilized site due to changing hydrogeological conditions.
Likewise, a saturated bed of sorbent material would either be regenerated or taken out of the ground for
disposal.
Kaolinite samples precontaminated with Pb(II) were tested to determine the effectiveness of using
permeable reactive caps to contain heavy metals. The reactive permeable caps were composed of approx-
imately 50% glauconite (green sand), 30% zeolite, and 20% bentonite clay. The average particle size of
green sand and zeolite was on the order of medium to fine sand. Bentonite was added to enhance the
bonding or cohesive potential of the green sand caps. The caps were prepared by first hydrating overnight
the predetermined mass of bentonite, and then mixing in the other two ingredients dry. The final water
content of the mixture was 37.5%. These caps are referred to as GS caps throughout this chapter section.
The metal salt used to prepare the mixing solutions was a readily soluble salt of Pb(NO
3
)
2
. Initially,
kaolinite clay was mixed with the metal solution (5000 ppm) to form a slurry. These slurry mixtures
were allowed to sit in an airtight container overnight, re-mixed, and then poured into one-dimensional
consolidometers to be normally consolidated. At the completion of consolidation, the soil cylinder was
extruded and placed into the sample holder of the EK test set-up. Pre-electrokinetic soil samples were
taken for chemical and water content analyses. The Pb(II)-contaminated samples were run with parallel
sets of control samples, that is, those without GS caps.
Each test sample was prepared by mixing approximately 300 g kaolinite clay with approximately 220
mL of distilled water and normally consolidated at 290 kPa. The average water content of the Pb(II)-
containing samples was 60%. The caps were constructed by packing the green sand, zeolite, and hydrated
bentonite mixture in lifts at either end of the soil sample holder once the soil was in place. Distilled water
was added to the anode and cathode chambers of the EK cell prior to testing. The Pb(II) samples were
tested for approximately 300 hr.
At a constant voltage of 15 Vdc. Voltage, flow (inflow and outflow), current, and pH readings were
taken at regular time intervals during each test. The EK tests were terminated when the current readings
appeared to be constant or dropped significantly below the initial value observed at the start of each test.
Upon completion of all experiments, post-EK soil and liquid samples were obtained for analysis. The
soil samples without GS caps were divided into four equal sections of approximately 1 in. length. The
average weight of each section was approximately 27.5 g. The post-EK soil specimens with GS caps
© 2001 by CRC Press LLC
were also divided into four equal portions, each weighing approximately 20 g. The average length of
these samples was 0.88 in. The designations of A-Cap and C-Cap were used to describe the caps located
near the anode and cathode chambers in the EK cell, respectively. The caps had approximate lengths and
weights of 0.25 in. and 13 g, respectively. Anode and cathode liquid samples were collected for all tests
and analyzed along with the appropriate soil samples.
The current distributions for both Pb(II) samples tested with and without the GS caps were comparable
during testing. The current distributions were reasonably uniform throughout the test samples, with an
average peak current of nearly 2.0 mA. The maximum anodic and cathodic pH were 2.50 and 11.51, and
2.45 and 11.34, respectively, for samples tested with and without the GS caps.
Typically during an EK test, three electrodes designated P1, P2, and P3 are installed in the soil sample
starting at the positive electrode toward the negative electrode, located in the anode and cathode cham-
bers, respectively. Figure 3.1.8 shows the resistance variations between P3 and the negative electrode in
tests conducted with and without GS caps. The resistance variations across electrodes P1 and P2 appeared
to be very low throughout the Pb(II) experiments. In general, these resistances tended to peak initially
and then drop off to very low values during testing. The relative increase in soil electrical resistance across
P3 (nearest electrode in the soil to the cathodic electrode) and the cathodic electrode were attributed to
the accumulation or precipitation of the migrating ions in soil at that location. The caps sorbed the lead
without causing an increase in resistivity.
Figures 3.1.9 and 3.1.10 show the average pre- and post-EK mass fraction distributions (with respect
to the original total mass) of Pb(II) in each section of soil and electrode chambers tested with and without
the GS caps, respectively. The sample containing the GS caps showed larger concentrations of Pb(II)
accumulated in the caps. Table 3.1.2 shows a comparison of the average post-EK concentrations of Pb(II)
remaining in each section of soil tested with and without the GS caps after the EK experiment. Overall,
the results showed that, in samples tested without the GS caps, more of the Pb(II) remained in the soil;
while the samples containing the caps showed lesser concentrations of Pb(II) in the soil with larger
concentrations in the areas of the GS caps.
Removal of Chlorophenols
Four electroosmosis experiments were conducted using various phenolic compounds (Huang et al.,
1991). Soils contaminated with phenol, 2-chlorophenol, 3-chlorophenol, and 4-chlorophenol were
FIGURE 3.1.8 Resistance variation across electrodes for Pb in samples tested with and without GS caps.
Resistance (ohms)
0
1
2
3
4
5
6
7
Current (mA)
Variation of Soil Electric Resistance
(measured across cathode side cap)
Resistance (w/o caps)
Resistance (w/ caps)
Current (w/o caps)
Current (w/ caps)
40000
30000
20000
10000
0
0 50 100 150 200 250 300 350
Time (hours)
© 2001 by CRC Press LLC
utilized and the same experimental procedures were applied in all of the tests. Table 3.1.3 below shows
some of the experimental conditions of the electroosmosis tests performed with phenolic compounds.
Figure 3.1.11 shows the electroosmosis apparatus employed to perform the experiments. The elec-
troosmosis cell consists of an acrylic unit with a central cylinder 11.5 cm in length and 8.9 cm in internal
diameter into the soil samples are placed. The volume of both cathode and anode compartments is 700
mL. To separate the soil from the water solution, a set of two nylon meshes (Spectrum; Model PP, mesh
opening 149 µm) with a filter paper (Whatman; qualitative) in between were used as a membrane in
each of the electrode reservoirs. Graphite rods (Ultra Carbon Co.; type ultra F grade 014144-08 U7/SPK;
0.615 cm in diameter) are utilized as electrodes and a series of eight rods are held at each compartment
near the central cylinder, right behind the membranes.
FIGURE 3.1.9 Mass fraction (%) of Pb remaining in soil and liquid samples tested with the GS caps; pH
superimposed.
FIGURE 3.1.10 Mass fraction (%) of Pb remaining in soil and liquid samples tested without the GS caps; pH
superimposed.
© 2001 by CRC Press LLC
The soil was a combination of Ottawa sand (U.S. Silica Company) and Georgia kaolinite (Georgia Kaolin
Company) at ratio 1:1 (w:w). A solution of the phenolic compound (in NaCl 10
3
M) was mixed well with
the dry soil and allowed to stand for about 24 hr to reach an equilibrium and consequently provide uniform
distribution of the contaminant in the soil system. The mixture was then carefully packed in the acrylic
cylinder to avoid formation of large air spaces.
To begin the tests, the electrodes were connected to a 12-Vdc power supply (Power/Mate Corporation;
Model E-12/158). The anode container was kept filled with 10
3
M NaCl electrolyte solution and the cathode
compartment was initially empty. Daily water samples were taken at the cathode side and, during the
experiments, parameters such as amount of water flow, current, effluent contaminant concentration, pH of
catholyte and anolyte were monitored as a function of time.
After the conclusion of the test, the soil samples were removed from the cell and sliced into ten sections.
Each one was then analyzed for water content, pH, and contaminant concentration.
Electroosmotic Flow Rate
Figure 3.1.12 shows the amount of electroosmotic flow produced as a function of time. In general, the flow
reached a maximum value and then decreased gradually, possibly due to changes in the electrical properties
of the packed soil cores originating from the electrochemistry associated with the electroosmosis process.
By applying a potential to the system, water decomposed to H
+
and O
2
at the anode and these hydrogen
TABLE 3 .1. 2 Average Post EK Concentrations for Lead (Pb) Removal in Soil Samples Tested
With and Without Green Sand (GS) Caps
Sample ID
Normalized Distance
from anode (%)
Pb Conc.
(mg/L)
Pb Mass per Section
(mg)
Mass Fraction
(%)
Pre-EK (soil) 1606.67 1992.27 1.00
Anode 1 576.67 96.82 0.05
20 516.67 211.83 0.11
Control Sample 40 953.33 358.45 0.18
60 1233.33 503.20 0.25
80 2376.67 955.42 0.48
Cathode 1 2190.00 389.82 0.20
Error (%) 27
Pre-EK
(soil) 1606.67 1670.93 1.00
Anode 1 83.33 13.70 0.01
A-Cap 0 393.33 163.65 0.10
20 180.00 78.12 0.05
GS-cap Sample 40 203.33 86.21 0.05
60 266.67 132.80 0.08
80 396.67 179.20 0.11
C-Cap 100 2183.33 912.57 0.55
Cathode 233.33 40.09 0.02
Error (%) 3
TABLE 3.13 Some Experimental Conditions of the Electroosmosis Tests
with Phenolic Compounds
Test No. Contaminant
Concentration
(ppm)
Potential Gradient Applied
(V/cm)
Blank None 0 1.2
PhI Phenol 166 1.2
PhII 2-Chlorophenol 143 1.2
PhIII 3-Chlorophenol 143 1.2
PhIV 4-Chlorophenol 143 1.2
© 2001 by CRC Press LLC
ions flushed across the cell, modifying the original conditions of the pore fluid. Simultaneously, vigorous
production of OH
took place at the cathode because of the reduction of water. Accounting for these
occurrences, the hydraulic properties of the soil could be altered by dissolution of salts and clay minerals,
adsorption/desorption interactions, precipitation of metal hydroxides, and cation exchange (Hamed et
al., 1991). Owing to the complexity of the soil system, it became very difficult to interpret the specific
causes of the changes of the electrical properties soil core. Khan and Pamukcu (1989) suggested that
reversing the current of the electrical system and replacing the electrolyte solutions with fresh solutions
would indicate any structural changes in the packed soil. If there are any variations in water flow after
these changes, the hydraulic properties of the soil system could be altered with respect to those of the
initial condition. Based on this, the authors demonstrated that no changes in the soil structure were
observed during the electroosmosis process at least for kaolinite and that the changes in electrical
properties of the pore fluid significantly affected the electroosmotic water flow. To better illustrate these
changes, a plot of current density (current per cross-sectional area of flow) vs. time is presented in Figure
3.1.13. It was observed that the current also reached a maximum value during the first days of experiments
and then gradually decreased.
FIGURE 3.1.11 Schematic presentation of the electrokinetic cell used in the study. (From Huang et al., 1991.)
FIGURE 3.1.12 Daily electroosmotic flow in the presence of phenol and chlorophenols. (From Huang et al., 1991.)
electrolyte
solution
anode
reservoir
cathode
reservoir
effluent
power supply
V
A
soil sample
graphite electrodes filter paper nylon mesh
0
20
40
60
80
100
0 5 10 15 20
ph
2Clph
3Clph
4Clph
blank
average daily flow (mL)
time (days)
© 2001 by CRC Press LLC
A linear correlation was found between the average water flow and the average current density (Figure
3.1.14): the higher the current density, the greater the water flow. The current passing through the soil
core was mainly credited to the ions in the liquid phase. Some of these ions (cations) were responsible
for the water flow and a high current should evidently yield high electroosmotic water flow. Therefore,
the monitoring of current density could be used as a good assessment of the efficiency during the
application of the electroosmotic process.
Noticeable differences among the experiments were related to the water flow. Figure 3.1.15 presents
the diagram of cumulative flow vs. time. The test with 2-chlorophenol produced the highest flow, while
the blank test showed the lowest water flow. It was noticed that the water flow was also related to the
pore volume of the soil core: the larger the pore volume, the larger the electroosmotic water flow (because
more water was available to be transported). Obviously, there is a limitation to this occurrence; if the
pore volume is too large (see blank test), the system behaves as a free electrolyte solution and less
electroosmotic flow is recorded. Figure 3.1.16 exhibits the total average flow of each experiment vs. pore
volume; with increasing pore volume, there was an increase in the average flow until a point at which
an abrupt decrease was observed.
Changes in pH
The influent and effluent pH variation during the electroosmosis experiments are presented in Figures
3.1.17 and 3.1.18, respectively. As mentioned previously, hydrogen ions (H
+
) were produced from the
FIGURE 3.1.13 Current density as a function of time in the presence of phenol and chlorophenols. (From Huang
et al., 1991.)
FIGURE 3.1.14 Correlation between electroosmotic flow rate and current density. (From Huang et al, 1991.)
0
0.5
1
1.5
2
0 5 10 15 20
ph
2Clph
3Clph
4Clph
blank
current density (mA/cm
2
)
time (days)
0
0.2
0.4
0.6
0.8
1
0 10203040506070
average current density
average water flow (mL)
y = -0.1225 + 0.014173x R= 0.95027
(
Am/cm
2
)
ph
2Clph
3Clph
4Clph
blank
© 2001 by CRC Press LLC
oxidation of water, causing the drop in pH at the anode, and hydroxyl ions (OH
) from the reduction
of H
2
O were responsible for the pH increase at the effluent. For all experiments, the pH at the anode
(influent) decreased from values around 5 to approximately 2.5 to 3.0, while the effluent pH (cathode)
rose to values between 12 to 13 and then decreased gradually due to the acid front generated at the anode.
It is well known that hydrogen ions have higher mobility than hydroxyl ions (Acar et al., 1990). Thus,
hydrogen ions move toward the cathode faster (due to their higher electrochemical mobility and con-
vection) than the hydroxyl ions to the anode, and a decrease in pH would be expected at the cathode
solution.
Removal Efficiency
Figures 3.1.19 and 3.1.20 present the percent removal as a function of time and the removal related to
the total water volume flushed through the soil cores (in units of pore volumes of flow), respectively.
The results demonstrated that good contaminant removal was achieved from the cathode side. For these
experiments, no samples of the anode were analyzed for contaminant concentration. The 2-chlorophenol
was almost completely removed from the soil (94%) while only 58% of the phenol was carried out by
the electroosmosis process. The removal efficiencies of 3-chlorophenol and 4-chlorophenol were 85%
and 79%, respectively. In Figure 3.1.20, one can observe that the removal efficiency was proportional to
the amount of water passed through the soil samples: the greater the amount of liquid flushed through
the soil, the greater the contaminant removal. Acar et al. (1992) demonstrated that a high removal
FIGURE 3.1.15 Cumulative electroosmotic flow as a function of time in the presence of phenol and chlorophenols.
(From Huang et al., 1991.)
FIGURE 3.1.16 Average electroosmotic flow as a function of pore volume in the presence of phenol and chlorophe-
nols. (From Huang et al., 1991.)
0
200
400
600
800
1000
0 5 10 15 20
ph
2Clph
3Clph
4Clph
blank
accumulative flow (mL)
time (days)
10
20
30
40
50
60
70
140 160 180 200 220 240 260
average flow (mL/day)
pore volume (mL)
ph
2Clph
3Clph
4Clph
blank