Báo cáo khoa hoc:" Validity of self-reported leisure-time sedentary behavior in adolescents" pot
Bạn đang xem bản rút gọn của tài liệu. Xem và tải ngay bản đầy đủ của tài liệu tại đây (274.48 KB, 9 trang )
RESEARCH Open Access
Validity of self-reported leisure-time sedentary
behavior in adolescents
Olivia Affuso
1*
, June Stevens
2
, Diane Catellier
3
, Robert G McMurray
4
, Dianne S Ward
5
, Leslie Lytle
6
,
Melinda S Sothern
7
, Deborah R Young
8
Abstract
Background: To evaluate the concordance between leisure-time sedentary behavior in adolescents assessed by an
activity-based questionnaire and accelerometry.
A convenience sample of 128 girls and 73 boys, 11-15 years of age (12.6 ± 1.1 years) from six states across the
United States examined as part of the feasibility studies for the Trial of Activity in Adolescent Girls (TAAG). Three
days of self-reported time spent watching TV/videos, using computers, playing video/computer games, and talking
on the phone was assessed using a modified version of the Self-Administered Physical Activity Checklist (SAPAC).
Criterion measure of sedentary behavior was via accelerometry over three days using a cut point of < 50 counts ·
30 sec
-1
epoch. Comparisons between sedentary behavior by the two instruments were made.
Results: Adolescents generally underestimated minutes of sedentary behavior compared to accelerometry-
measured minutes. The overall correlation between minutes of sedentary behavior by self-report and accelerometry
was weak (Spearman r = 0.14; 95% CI 0.05, 0.23). Adjustment of sedentary minutes of behavi or for total minutes
assessed using either percentages or the residuals method tended to increase correlations slightly. However,
regression analyses showed no significant association between self-reported sedentary behavior and minutes of
sedentary behavior captured via accelerometry.
Discussion: These findings suggest that the modified 3-day Self-Administered Physical Activity Checklist is not a
reliable method for assessing sedentary behavior. It is recommended that until validation studies for self-report
instruments of sedentary behavior demonstrate validity, objective measures should be used.
Background
Although a sedentary lifestyle has been identified as a
risk factor for adolescent obesity, validated methods to
assess sedentary behavior (physical inactivity) are limited
due in part to po rtable criterion methods being devel-
oped only recently to measur e this construct [1]. Recent
studies have examined the use of accelerometry to
assess sedentary behavior in c ontrolled conditions and
provided population specific accelerometry cut points to
indicate a valid measure of sedentary behavior in chil-
dren [2,3]. Nevertheless, self-report tools remain the
most widely used method for assessing behavior in ado-
lescents [4]. In contrast to accelerometry, self-report
questionnaires provide a low cost and easy to use
method for measuring sedentary behaviors. Question-
naires also have the advantage of capturing the type (e.g.
TV viewing) and context (e.g. at home) of sedentary
behaviors which may identify key targets for designing
efficacious interventions aimed at reducing inactivity.
One of the limitations of self-report behavioral ques-
tionnaires is response bias where respondents may
intentionally provide incorrect answers to a survey due
to pressures to respond in a socially acceptable manner
[5-7]. Social desirability, a type of response bias, has
been associated misreporting of activity behaviors in
both boys and girls [7,8]. Klesges et al. (2004) found
tha t the overestimation o f self-reported physical activity
was positively associated with social desirability among
8 to 10 year old African American girls. Among 10 to
14 year old boys, social desirability was negatively asso -
ciated with self-reported sedentary behavior (r = -0.158;
p < 0.001). There is some evidence from studies of
* Correspondence:
1
Department of Epidemiology, University of Alabama at Birmingham, 1530
Third Ave, South, RPHB 220E, Birmingham, AL 35294-0022, USA
Full list of author information is available at the end of the article
Affuso et al. Journal of Negative Results in BioMedicine 2011, 10:2
/>© 2011 Affuso et al; licensee BioMed Central Ltd. This is an Open Access article distributed under the terms of the Creative Commons
Attribution License ( which permits unrestricted use, distribution, and reproduction in
any medium, pro vided the original work is properly cited.
adults that weight status may also affect reporting of
sedentary behaviors, with overweight adults underre-
porting minutes of sedentary activities compared to nor-
mal weight adults [9]. How ever, the association between
weight status and self-reported sedentary behavior has
notbeenexaminedinyouth.Inaddition,reportingof
activity behaviors has been shown to differ by sex in
adu lts [10]. We hypothesized that weight status and sex
would influence reporting of sedentary behaviors among
adolescents trying to avoid social criticism in a similar
manner to that of adults, and therefore affect the valid-
ity of self-reported sedentary measures.
Investigators have used questionnaires, such as the
Self-administered Physical Activity Checklist (SAPAC)
[11], to assess sedentary behaviors [12-14], however,
only recently have ef forts been made to determine the
validity of the self-repo rt measures in free-living partici-
pants [15]. The purpose of this research was to evaluate
thevalidityofathree-dayself-report physical activity
checklist (a modified version of the SAPAC) to assess
leisure-time sedentary behaviors in a sample of free-
living adolescents using accelerometry as the criterion
measure. Overall validity and differences by weight
status and sex were examined. We a lso compared self-
reported minutes of sedentary behavior to accelerome-
try-measured sedentary behavior using three different
expressions: 1) unadjusted sedentary minutes , 2) percen-
tage of sedentary minutes, and 3) residuals of predicted
sedentary minutes. The inclusion of compar isons of the
three methods for estimating concordance was used to
explore the effects of adjusting the minutes of sedentary
behavior as a function of total time assessed and the
within-person variation in sedentary behavior. The
aforementioned analytic strategies are common practice
in validation studies of self- reported dietary intake [16].
To our knowledge, this study is the first to examine
validity of reported leisure-time sedentary behaviors
from the SAPAC among adolescent girls and boys.
Results
Sample Characteristics
Characteristics for the study sample and the 3-day
sedentary behavior assessments are presented in Table 1.
The sample (N = 201) included a wide range of body
sizes, with 36% of the sample overweight (BMI ≥ 85th
percentile on the CDC growth charts). The sample was
ethnically diverse: 40% of the sample was minority stu-
dents and included 15% African American, 12% Multira-
cial, 9% Hispanic, 3% Asian, and 2% American Indian.
Girls spent twice as much time talking on the phone as
boys, while boys spent approximately three times the
number of minutes playing computer/video games as
girls. There were no significant differences by sex for
time spent watching TV/videos or using computers/
internet. There was also no significant difference in the
3-day average accelerometer-measured minutes of seden-
tary behavior when stratified by sex.
Overweight girls tended to report fewer minutes of
sedentary behavior than normal weight girls, but this
observation was not supported by accelerometry data.
The accelerometry me asures indicated tha t overweight
girls significantly under-reported minutes of sedentary
behavior (260 mins. vs. 365 mins.; p = 0.0009). In boys,
reported and accelerometry-measured sedentary beha-
vior was similar across weight status groups. However,
normal weight boys reported significantly fewer minutes
of sedentary behavior compared to accelerome try (264
mins. vs. 334 mins.; p = 0.0161).
Comparisons within groups by sex showed that for
individual sedentary behaviors from the modified
SAPAC, overweight girls reported fewer mean minutes
of TV/video watching (143.8 mins. vs. 191.6 mins.),
computer/internet use (50.0 mins. vs. 66.4 mins.), video/
computer game playing (14.2 mins vs. 16.7 mins.), and
talking on the phone (67.6 mins. vs. 69.9 mins.) com-
pared to normal weight girls. Overweight boys reported
more minutes of computer/internet use (40.9 mins vs
39.2 mins.), video/computer game playing (63.1 mins vs.
34.8 mins.), and talking on phone (40.7 mins vs. 34.2
mins.), but not TV/video watching (129.0 mins vs. 155.2
mins.) compared to normal weight boys.
Minutes of TV/video watching as assessed by self-
report were significantly correlated with objectively
measured sedentary minutes in normal weight and over-
weight girls (r = 0.21, 95% CI 0.07, 0.35, r = 0.28; 95%
CI 0.11, 0.43, respectively). No significant correlations
between objectively measured sedentary minutes and
self-reported TV/video watching were found in boys.
Neither self-reported video/co mputer games nor talking
on the phone were correlated with accelerometry in
girls or boys. In contrast, self-reported minutes of com-
puter/internet use were modestly correlated with objec-
tively measured sedentary minutes in normal weight
boys (r = 0.26, 95% CI 0.07, 0.43), but not in girls or
overweight boys.
Both Spearman and Pearson correlations between self-
report and accelerometry by method of analysis are
presented in Table 2. The overall 3-day Spearman corre-
lation between self-reported and accelerometry-mea-
sured minutes of sedentary behavior f or all subjects
combined was weak (r = 0.14; 95% CI, 0.05, 0.23).
When stratified by sex, Spearman correlations tended to
be slightly higher in girls (r = 0.16; 0.05, 0.27) than in
boys (r = 0.11; -0.05, 0.26). There were no significant
differences in these correlations by sex or weight status.
When the minutes of sedentary behavior were adjusted
for total minutes of activity assessed by either the per-
centage or residuals method, the adjusted correlation
Affuso et al. Journal of Negative Results in BioMedicine 2011, 10:2
/>Page 2 of 9
coefficients tended to increase agreement from the
unadjusted estimates. However, the residuals method
tended to produce the most precise estimates as evident by
smaller confidence intervals. Although in some instances
the Pearson correlati on coefficients were higher than the
Spearman coefficients, none were significantly different as
evidenced by t he overlapping confidence intervals.
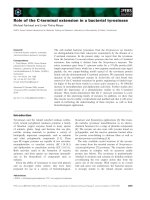
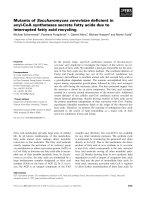
Bland-Altman plots were used to examine differences
between self-report and accelerometry across mean min-
utes of sedentary behavior by each of the analysis meth-
ods (Figures 1a-c.). The scale of the Bland-Altman plots
was standardized to allow comparisons between these
methods. For unadjusted estimates (Figure 1a.), adoles-
cents under-reported sedentary behaviors at low levels
of mean sedentary behavior with under-reporting
decreasing as sedentary minutes increased. When
adjusted for total daily activity (Figure 1b.), there w as
less absolute agreement between the self-report and
accelerometry sedentary behavior with less under-
reporting at low levels of sedentary and i ncreasing over-
reporting a higher measures of sedentary behavior.
Finally, the correction for within-person variation using
the residuals (Figure 1c.) from a regression of sedentary
behavior given total activity seemed to produce the
smallest absolute difference between self-report and
accelerometry across the average minutes of sedentary
behavior. Under-reporting decreased as minutes of
sedentary behavior increased. This method also pro-
duced the most precise measures of comparability
between the instruments. For all adolescents combined,
overall sedentary behavior below an average of 400 min-
utes was underestimated by sel f-report compared to the
accelerometer. When stratified by sex and weight status,
this pattern remains consistent across plots (data not
shown).
In the full regression model in which self-reported
sedentary behavior was the dependent variable, acceler-
ometer-measured sedentary behavior was the indepen-
dent variable, and day, age, grade, sex, ethnicity, and
weight status were included as covariates, only day of
assessment was significant, F(3,271) = 6.68, p = 0.0002.
However, in the reduced model, neither day nor the
interaction of day and accelerometer-measured seden-
tary behavior were significantly r elated to self-reported
sedentary behavior (day, F(3, 272) = 1.15, P = 0.3309;
accelerometer *day, F(3,272) = 0.49, p = 0.6891).
Discussion
The overall Spearman rank-order correlation between
self-reported minutes of sedentary behaviors from the
modified 3-day SAPAC and accelerometer-measured
minutes of sedentary behavior was weak indicating that
the questionnaire had i nadequate ability to rank stu-
dents according to their minutes of sedentary behavior.
The Spearman correlation tended to increase slightly
after adjusting the minutes of sedentary behavior by
total minutes assessed using either percentages or the
residuals method. In some cases, the Pearson correlation
Table 1 Mean (95% CI) characteristics of the sample of 201 adolescents
Girls Boys Combined
N mean (95% CI), % N mean (95% CI), % N mean (95% CI), %
Age (years) 128 12.6 (12.4, 12.8) 73 12.6 (12.4, 12.9) 201 12.6 (12.4, 12.7)
Height (cm) 128 157.5 (156.0, 158.9) 73 158.2 (155.6, 160.8) 201 157.7 (156.4, 159.1)
Weight (kg) 128 55.9 (53.5, 58.5) 73 53.7 (49.4, 58.2) 201 55.2 (52.9, 57.4)
BMI category (%)
< 85th percentile 59 73 64
≥ 85th percentile 41 27 36
Ethnicity (%)
African American 14 15 15
American Indian 1 4 2
Asian 2 3 3
Multiracial 14 9 12
Hispanic 8 12 9
White 61 57 60
Accelerometer Sedentary Behaviors (mins) 122 354.6 (342.1, 365.8) 68 338.5 (318.8, 358.2) 190 349.3 (339.1, 359.4)
Self-reported Sedentary Behaviors† (mins)
TV/Video watching 122 174.3 (148.5, 200.1) 68 152.4 (119.9, 184.9) 190 166.1(146.2, 186.4)
Computer/Internet 122 62.2 (43.1, 81.3) 68 39.7 (20.7, 58.7) 190 54.0 (40.1, 67.9)
Talking on phone 122 71.3 (51.2, 92.1)* 68 36.5 (10.5, 62.6)* 190 58.9 (42.7, 74.9)
Video/Computer games 122 15.8 (8.2, 23.4)* 68 43.6 (24.5, 62.6)* 190 25.9 (17.3, 34.4)
* Difference in mean minutes by sex;†Sedentary behavior from modified SAPAC.
Affuso et al. Journal of Negative Results in BioMedicine 2011, 10:2
/>Page 3 of 9
coefficients were greater than the Spearman correlation.
However, there were not significant differences between
the two methods. Fina lly, the repeated measures regres-
sion analyses showed no association between the
self-reported and accelerometer-measured sedentary
behaviors after controlling for age, ethnicity, day of
assessment, sex, and weight status.
To our knowledge, this study is the first attempt to
validate reporting of leisure-time sedentary behaviors
from the modified 3-day SAPAC among adolescent girls
and boys. Other studies have b een published on African
American, preadolescent girls [17,18] examining correla-
tions between minutes of sedentary behaviors from a
modified SAPAC (renamed the GEMS Act ivity Ques-
tionnaire) and mean total minutes of activity from
accelerometry. The first study (N = 68 ; age 8-9 years)
found no significant correlations between self-reported
TV watching and accelerometry, or between other
sedentary behaviors minus TV watching and accelero-
metry [17]. In contrast, the second study of a larger
sample of slightly older preadolescent African American
girls (N = 172; age 8-10 years) found a significant nega-
tive correlat ion between TV watc hing and the three-day
mean accelerometry minutes of activity (r = -0.19; p =
0.02) [18]. Neither of these studies validated the
reported sedentary behaviors against sedentary minutes
measured by accelerometry, but rather did comparisons
with active minutes.
Cradock et al. (2004) did compare minutes of seden-
tary behavior by self-report to that of accelerometry
[15]. In a study of 54 middle school students (age 13.8 ±
0.7 years) t hey found a signifi cant correlation between
the proportions of time spent in sedentary behaviors
(< 1.5 METs) from an interviewer-administered 24-hr
recall and TriTrac accelerome try (r = 0.48; p < 0.05).
There were many differences between that study and
the one reported here; however, likely explanations of
the higher correlation found by Cradock et al. (2004)
are the use of a different self-report instrument and the
fact that the recall was interviewer-assisted rather than
self-administered.
In a more recent study of 447 Boy Scouts (age 10 to
14 years), there was no statistically significant correla-
tion between the 3-day average minutes of sedentary
behavior from accelerometry and the self-reported
sedentary behavior during the previous day and usual
sedentary behavior (r = 0.063 and r = 0.094, respec-
tively) from a modified version of the SAPAC [7]. How-
ever, further regression analyses found an inverse
association between social desirability and self-reported
sedentary behavior from the previous day (b =-0.15,
P = 0.008).
Findings in the present study suggest the three-day
SAPAC did not sufficiently capture sedentary behaviors
in adolescent girls and boys, with mean levels generally
underestimated compared to accelerometry. The use of
only four sedentary behaviors from the modified SAPAC
may have contributed to the underestimation of seden-
tary pursuits measured by accelerometry. However, stu-
dies in adolescents and adults [7-9,19] have also shown
an underestimation of the self-reported minutes of
sedentary behaviors. Sedentary behaviors may be more
difficult to remember than activities of higher intensity
[9]. Compared to adults, adolescents may have more dif-
ficulty recalling and processing intermittent complex
Table 2 Spearman and Pearson correlation coefficients
for comparison of self-report* and accelerometer minutes
of sedentary behavior, both unadjusted and adjusted for
total minutes of activity
Unadjusted Percentages** Residuals***
Spearman
correlations
95% CI 95% CI 95% CI
All Participants 0.14 0.05, 0.23 0.21 0.12, 0.30 0.19 0.10,
0.28
Girls 0.16 0.05, 0.27 0.21 0.10, 0.31 0.21 0.10,
0.31
Boys 0.11 -0.05,
0.26
0.25 0.10, 0.40 0.27 0.11,
0.40
Normal weight 0.20 0.09, 0.30 0.27 0.16, 0.37 0.27 0.16,
0.37
Girls 0.22 0.07, 0.35 0.25 0.11, 0.38 0.23 0.13,
0.33
Boys 0.24 0.04, 0.41 0.32 0.13, 0.48 0.34 0.16,
0.50
Overweight 0.08 -0.07,
0.24
0.16 0.00, 0.31 0.07 -0.08,
0.21
Girls 0.20 0.03, 0.36 0.23 0.06, 0.40 0.20 0.07,
0.31
Boys -0.29 -0.56,
0.03
0.16 -0.16,
0.45
0.24 -0.08,
0.51
Pearson correlations
All Participants 0.18 0.07,0.28 0.23 0.12, 0.33 0.16 0.05,
0.27
Girls 0.07 -0.09,0.22 0.30 0.15, 0.43 0.24 0.08,
0.38
Boys 0.13 0.05, 0.22 0.21 0.12, 0.29 0.14 0.05,
0.22
Normal weight 0.03 -0.08,
0.14
0.25 0.11, 0.38 0.17 0.06,
0.28
Girls 0.17 0.03, 0.31 0.33 0.14, 0.48 0.19 0.09,
0.29
Boys -0.21 -0.37,
-0.04
0.24 0.13, 0.34 0.26 0.07,
0.43
Overweight -0.06 -0.21,
0.05
0.27 0.11, 0.43 0.12 -0.02,
0.26
Girls 0.03 -0.16,
0.22
0.23 -0.08,
0.50
0.24 0.13,
0.36
Boys -0.37 -0.61,
-0.08
0.21 0.07, 0.34 0.30 -0.01,
0.55
* Self-reported sedentary behavior from the modified SAPAC; ** Sedentary
minutes divided by total minutes; ***Residuals from regression of total
minutes assessed on sedentary minutes.
Affuso et al. Journal of Negative Results in BioMedicine 2011, 10:2
/>Page 4 of 9
Figure 1 Bland-Altman plots of sedentary behavior from self-report versus accelerometry standardized to 1 SD. The results represent the
3 different methods used: 1a) unadjusted minutes, 1b) percent of minutes, and 1c) residual minutes. Mean error scores are shown in each plot.
Affuso et al. Journal of Negative Results in BioMedicine 2011, 10:2
/>Page 5 of 9
information about past sedentary behavior [5,20]. In
addition recall bias, social desirability has been asso-
ciated with underreporting of sedentary behaviors in
adolescents boys [7].
Bias was observed in the hypothesized direction in
self-reported sedentary behavio r associated with body
weight status, although the bias was statistically signifi-
cant only in overweight girls and normal weight boys.
Previous reports have shown that it is important to con-
sid er recall and report ing bias when assessing behaviors
in children and adolescents [1]. Social pressure may
influence overweight adolescent girls to underreport
sedentary behavior to a greater extent than other groups
[21]. However, the effect s of social desir ability on
reports o f sedentary behavior by weight status have not
been evaluated.
The current study benefited from multiple days of
sedentary b ehavior recall and objective measurements,
which allowed for a more accurate assessment of usual
sedentary behavior. The diversity of the sample studied
is also a strength of the study. One weakness of this
study is that sedentary behavior was not assessed during
school. Had sedentary minutes during school also been
reported it is possible that correlations would have been
higher. However, this does not alter the poor perfor-
mance of the questionnaire fo r measuring minutes of
sedentary behavior outside of school.
Moreover, to our knowledge this is the first study to
use Bland-Altman plots with three different analytical
strategies to evaluate the comparability between the two
measures of sedentary behavior. The agreement betwe en
the self-report and accelerometer appeared to be more
precise using the residuals method (Figure 1c.). This
plot showed less dispersion (within ± 1 SD of the mean
difference) in the estimates of sedentary behavior
between self-report and accelerometry.
Several investigators have used SAPAC to assess
sedentary pursuits in adolescents [12-14]. Our results
indicate that such studies should be interpreted with
caution since the validity of the SAPAC to assess
sedentary behavior appears to be invalid. The findings
of the current study points to the likelihood of mis-
classification of sedentary behavior by self-report
among adolescents. The implications of misclassifica-
tion of sedentary behaviors are t wofold. First, using a
modified version of the SAPAC to capture sedentary
behaviors would likely lead to an underestimation of
the prevalence of inactivity among adolescents. Sec-
ondly, the association between self-reported sedentary
behaviors and outcomes of interests such as excess
body weight would be attenuated. Both of the implica-
tions have the potential to delay action of intervention-
ists and policy makers. For example, interventionists
and policy makers may not recognize the magnitude of
the problem of sedentary behavior in youth and fail to
develop programs or institute policies designed to
reduce this behavior. These findings highlight the need
for further development of methods for assessing
sedentary behaviors which might include question-
naires that query more sedentary pursuits and a format
that combines a checklist with time-cues for better
recall such as start and stop times for common TV
shows. The current availability of accelerometry as a
criterion measure with which to compare self-report
instruments to assess sedentary behavior should lead
to the development of better tools.
In conclusion, large epidemiological studies require
physical activity assessment tools that have both low-
cost and low subject burden. Therefore, self-report
instruments remain the most often used technique to
assess physical activity in large samples. However,
results from self-report instruments are so poor that
conclusions reached in these studies come into ques-
tion. It is recommended that accelerometers be used
whenever possible, or, at a minimum, in a subset of the
target population of the study to create prediction
equations for self-reported sedentary behavior assess-
ments. The contributions of this research may lead to
better methods for measuring self-reported sedentary
behavior to support this important area of public
health research.
Research Methods and Procedures
Participants
This study was conducted as part of the feasibility phase
of the Trial of Activity for Adolescent Girls (TAAG), a
randomized controlled trial designed to “determine if an
intervention that provides opportunities for physical
activity linking schools to community organizations can
reduce the age-related decline in moderate to vigorous
physical activity (MVPA) in middle school girls” [22]. In
Spring 2002, a convenience sample of 224 boys and girls
enrolled in 6th through 8th grades were recruited from
six field centers in diverse locations across the United
States: Arizona, California, Louisiana, Maryland, Minne-
sota, and South Carolina. Each center recruited a conve-
nience sample of 30 girls and 14 boys from diverse
ethnic groups and activity levels. Care was taken to
recruit at least 10 girls involved in organized sports and
physical activities from each field center to insure a
broad range of activity levels which was important for
the primary outcome variable (MVPA) of the substudy.
Of the 224 students recruited, five were excluded due
to missing questionnaire data, 11 were excluded due to
missing accelerometer data, and 16 were excluded
because they did not meet the study adher ence criteria
for t he number of hours per day the accelerometer was
worn (minimum of 11.2 hours on weekdays and
Affuso et al. Journal of Negative Results in BioMedicine 2011, 10:2
/>Page 6 of 9
7.2 hours on weekend days). Two additional students
were excluded for missing demographic data. The final
analysi s sample included 190 participants (122 girls and
68 boys; 84.8% of students recruited).
This study was approved by the Institutional Review
Boards at each field center. In addition, approval was
obtained from the school or school district. Inform ed
consent was obtained from a parent or guardian and
informed assent was obtained from each participant.
The University of North Caroli na at Chapel Hill was the
study coordinating center.
Data collection schedule
All participants were fitted with accelerometers to collect
3 days of objective data for comparison with the self-
report data. Each participant used a modified SAPAC to
recall sedentary behaviors for each of the previous 3 days.
One hundred and forty students (97 girls and 43 boys)
were randomly assigned to complete the modified
SAPAC on Tuesday to recall their behaviors on Saturday,
Sund ay and Monday, while 84 students (48 girls and 36
boys) completed the questionnaire on Wednesday for
Sunday, Monday, and Tuesday. This uneven distribution
across days was due to collection of data on an a lterna-
tive questionna ire, whi ch was not part of this investiga-
tion. Height, weight and demographi c information were
collected on study day 1.
Demographic and anthropometric variables
A questionnaire was used to assess age and ethnicity. The
students had t he option of selecting one or more ethnic
categories or selecting ‘ other’ and specifying ethnicity.
Height was measured to the nearest 0.1 cm using a por-
table stadiometer (Shorr Height Measuring Board, Olney,
MD). Weigh t was measured to the nearest 0.1 kg on an
electronic scale (Seca, Model 770, Hamburg, Germany).
Weight status groups were determined using the 2000
Centers for Disease Control and Prevention growth
charts for children and adolescents [23]. Normal weight
was defined as BMI percentile for age and sex < 85
th
per-
centile while at risk for overweight plus overweight (here-
after referred to as “overweight” )wasdefinedasBMI
percentile for age and sex ≥85
th
percentile [24].
Self-reported sedentary behavior
A modified 3-day SAPAC was administered to groups of
students in a classroom setting, and detailed instructions
were given to provide contextual cues to enhance recall.
Specifically, the students were asked to think about their
activities for each day prior to recording their responses.
The original SAPAC [11], for whi ch validity was estab-
lished for the physical activity portion of the instrume nt
compared to accelerometry (r = 0.33, p < 0.001),
assessed two categories of sedentary activities: 1) TV/
video and 2) v ideo games and computer games and was
designed for one day of activity recall. Based on infor-
mation obtained during the TAAG feasibility period
about common sedentary behaviors among adolescents,
two additional questions were added to the activity-
based questionnaire for this study: 1) computer/inter net
use and 2) talking on the phone. Students recorded the
number of hours and minutes spent in the four types of
sedentary behaviors.
Sedentary behavior was assessed only during hours in
which the students were not in school. On weekends,
time spent in the four sedentary behaviors was reported
for morning, between lunch and dinner, an d after din-
ner. The maximum number of sedentary minutes that
could be accrued on wee kend days was set at 300 min-
utes for the morning interval, 30 0 minutes for the inter-
val between lunch and dinner, and 420 minutes for the
aft er-dinner interval. These intervals were arbitrarily set
defining 7 am to 12 noon as morning, 12 noon to 6 pm
as the interval b etween lunch and dinner, and 6 pm to
midnight as the after dinner interval. On weekdays, time
spent in sedentary beha viors was ascertained befo re
school and after school. On weekdays, the maximum
number of sedentary minutes that could be accrued was
set at 120 minutes before school (range: 0-120 minutes)
and 540 minutes after school (range: 0-540 minutes).
These maxima were set using the approximate start and
end time for school days as indicated by the average
school bell schedule. Thus, the maximum amount of
sedentary time that could be accrued was 660 minutes
for weekdays and 1020 minutes for weekend days.
Criterion measure of sedentary behavior
The criterion measure of time spent at the sedentary
level was assessed using the Actigraph
®
accelerometer,
formerly the CSA accelerometer (Model 7164, Manufac-
turing Technology Inc. [MTI], Ft. Walton Beach, FL).
The Actigraph accelerometer has been calibrated for use
as an objec tive measure of sedentary behavior in chil-
dren and adolescents [2,3]. Data were collected as the
average number of counts in 30-second epochs, and
bounds for sedentary behavior were set using results
from Treuth et al (2004) [25]. In that study seventy-four
8
th
grade girls performed activities of various intensity
levels while wearing an Actigraph and a portable indir-
ect calorimeter. The upper bound for low intensity
(sedentary) activity was found to be 50 counts · 30 sec
-1
epoch based upon sensitivit y and specificity analyses.
We considered sustained (20-minute) periods of zero
counts to represent times when the monitor was not
being worn and these counts did not contribute to min-
utes of sedentary behavior, which is standard in the lit-
erature [25]. Furthermore, criteria for daily adherence to
monitor wear time protocols were established. More
Affuso et al. Journal of Negative Results in BioMedicine 2011, 10:2
/>Page 7 of 9
specifically, data from monitors with < 7.2 hours on
weekend days and < 11.2 hours on weekdays were
deleted from the accelerometer data files [25].
Statistical Analyses
Time-matched intervals from the self-report and the
accelerometer for sedentary behaviors were used to
compare the two instruments. For example, on weekend
days the morning interval of 7 am to 12 noon was time-
matched with the minute-by-minute accelerometer data
that corresponded with the same time period. The
sedentary behavior values (minutes) were summed for
each day and averaged across all 3 days. Analyses were
stratified by sex and weight status. T-tests were used to
evaluate differences in means. Spearman rank-order cor-
relations and Pearson product-moment correlations
were used to compare minutes of sedentary behaviors
from the modified SAPAC to those measur ed using
accelerometry. Correlations were examined with minutes
of sedentary behavior expressed as: 1) crude minutes,
2) percentage of minutes measured spent at the seden-
tary level, and 3) sedentary minutes adjusted for total
minu tes measured using the r esiduals method [16]. The
latter method uses the residuals from models regressing
total minutes measured on sedentary minutes. A resi-
dual value is calculated for each participant and the
sample mean number of sedentary minutes is added to
that value. Overall correlations were calculated using the
three-day weighted average of the Fisher’s Z transforma-
tion of each day’ s correlation [26]. This procedure
allows for the deattenuation of the correlation due to
correlated error b etween the estimates. Bland-Altman
plotswereusedtoexaminethedifferenceorbias
between self-reported and accelerometry-measured
sedentary behavior [27]. For c omparison of the three
analytical strategies, the Bland-Altman plots w ere stan-
dardized to one standard deviation from the mean dif-
ference between self-report and accelerometer. Although
Bland-Altman plots are a commonly used statistical
method used in the field of physical activity research,
there is controversy around its ability to accurately
assess bias between two instruments [28]. Therefore,
regression analyses were also performed to a ssess bias.
Repeated measure ANOVAs that accoun ted for site and
school clusters of students were performed using SAS
PROC MIXED [29]. To examine the relationship
between self-reported sedentary behavior and a cceler-
ometer-measured sedentary behavior, self-reported
sedentary behavior as the dependent variable and accel-
erometer-measured sedentary behavior ad the indepen-
dent variable were used in the model. Covariates used
the in the model included day, age, grade, sex, ethnicity,
and weight status. Al l analyses were performed using
SAS Version 8.2 [30].
Acknowledgements
This research was funded by grants from the National Heart, Lung, and
Blood Institute (U01HL66858, U01HL66857, U01HL66845, U01HL66856,
U01HL66855, U01HL66853, U01HL66852). The opinions expressed are those
of the authors and not necessarily those of the NIH or any other
organization with which the authors are affiliated.
The authors thank Bertha Hidalgo for her assistance in the preparation of
this manuscript.
Author details
1
Department of Epidemiology, University of Alabama at Birmingham, 1530
Third Ave, South, RPHB 220E, Birmingham, AL 35294-0022, USA.
2
Department
of Nutrition, University of North Carolina at Chapel Hill 245 Rosenau Hall,
CB#7461, Chapel Hill, NC 27599-7461, USA.
3
Department of Biostatistics,
University of North Carolina at Chapel Hill 137 E. Franklin Street, Suite 203,
CB#8030, Chapel Hill, NC 27599-8030, USA.
4
Department of Nutrition,
University of North Carolina at Chapel Hill, 305 Wollen Gym, CB#8605,
Chapel Hill, NC 27599-8605, USA.
5
Department of Nutrition, University of
North Carolina at Chapel Hill, 2206 McGavran-Greenberg, CB#7461, Chapel
Hill, NC 27599-7461, USA.
6
Division of Epidemiology and Community Health,
University of Minnesota, 1300 S. Second Street, Suite 300, Minneapolis, MN
55454-1015, USA.
7
Division of Behavioral and Community Health Sciences,
Louisiana State University, 1615 Poydras Street, Suite 1400, New Orleans, LA
70112-1272, USA.
8
Department of Epidemiology and Biostatistics, University
of Maryland, 1242A School of Public Health Building, College Park, MD
20742-0001, USA.
Authors’ contributions
OA contributed to the design of the study, the statistical analysis, the
interpretation of the data, and the drafting of the manuscript. JS, RM, DW,
LL, MS, DY contributed to the data interpretation and revision of the
manuscript. DC contributed to the statistical analysis and interpretation of
the data. All authors have read and approved the final manuscript.
Competing interests
The authors declare that they have no competing interests.
Received: 27 September 2010 Accepted: 11 February 2011
Published: 11 February 2011
References
1. Sirard JR, Pate RR: Physical activity assessment in children and
adolescents. Sports Med 2001, 31(6):439-454.
2. Puyau MR, Adolph AL, Vohra , Butte NF: Validation and calibration of
physical activity monitors in children. Obes Res 2002, 10:150-157.
3. Reilly JJ, Coyle J, Kelly L, Burke G, Grant S, Paton JY: An objective method
for measurement of sedentary behavior in 3- to 4-year olds. Obes Res
2003, 11:1155-1158.
4. Sallis JF, Saelens BE: Assessment of physical activity by self-report: status,
limitations, and future directions. Res Quart Exerc Sport 2000, 71(2):1-14.
5. Welk G, Corbin CB, Dale D: Measurement issues in the assessment of
physical activity in children. Res Quart Exerc Sci 2000, 71(2):59-73.
6. Adams SA, Matthews CE, Ebbeling CB, Moore CG, Cunningham JE, Fulton J,
Hebert JR: The effect of social desirability and social approval on self-
reports of physical activity. Am J Epidemiol 2005, 161(4):389-398.
7. Jago R, Baranowski T, Baranowski JC, Cullen KW, Thompson DI: Social
desirability is associated with some physical activity, psychosocial
variables and sedentary behavior but not self-reported physical activity
among adolescent males. Health Educ Res 2007, 22(3):438-449.
8. Klesges LM, Baranowski T, Beech B, Cullen K, Murray D, Rochon J, Pratt C:
Social desirability bias in self-reported dietary, physical activity and
weight concern measures in 8- to 10-year old African American girls:
results from the Girls Health Enrichment Multisite Studies (GEMS). Prev
Med 2004, 38(Suppl):S78-87.
9. Buchowski MS, Townsend KM, Chen KY, Acra SA, Sun M: Energy
expenditure determined by self-reported physical activity in related to
body fatness. Obes Res 1999, 7(1):23-32.
10. Booth ML, Owen N, Bauman A, Gore CJ: Relationship between a 14-day
recall measure of leisure-time physical activity and a submaximal test of
physical work capacity in a population sample of Australian adults. Res Q
Exerc Sport 1996, 67:221-227.
Affuso et al. Journal of Negative Results in BioMedicine 2011, 10:2
/>Page 8 of 9
11. Sallis JF, Strikmiller PK, Harsha DW, Feldman HA, Ehlinger S, Stone EJ,
Williston BJ, Woods S: Validation of interviewer- and self-administered
physical activity checklists for fifth grade students. Med Sci Sports Exerc
1996, 28:840-851.
12. Ribeiro J, Guerra S, Pinto A, Oliveira J, Duarte J, Mota J: Overweight and
obesity in children and adolescents: relationship with blood pressure,
and physical activity. Ann Bio 2003, 30(2):203-213.
13. Prochaska JJ, Sallis JF, Griffith B, Douglas J: Physical activity levels of
Barbadian youth and comparison to a U.S. sample. Int J Behav Med 2002,
9:360-372.
14. Myers L, Strikmiller PK, Webber LS, Berenson GS: Physical and sedentary
activity in school children grades 5-8: the Bogalusa Heart Study. Med Sci
Sports Exerc 1996, 28(7):852-859.
15. Cradcock AL, Wiecha JL, Peterson KE, Sobol AM, Colditz GA, Gortmaker SL:
Youth recall and TriTrac accelerometer estimates of physical activity
levels. Med Sci Sports Exerc 2004, 36(3):525-532.
16. Willet W: Nutrition epidemiology. Issues in analysis and presentation of
dietary data. Oxford Press; 1998:Chp 13:321-346.
17. Treuth MS, Sherwood NE, Butte NF, McClanahan B, Obarzanek E, Zhou A,
Ayers C, Adolph A, Jordan J, Jacobs DR, Rochon J: Validity and reliability of
activity measures in African-American girls for GEMS. Med Sci Sports Exerc
2003, 35(3):532-539.
18. Treuth MS, Sherwood NE, Baranowski T, Butte N, Jacobs DR, McClanahan B,
Gao S, Rochon J, Zhou A, Robinson TN, Pruitt L, Haskell W, Obarzanek E:
Physical activity self-report and accelerometry measures from the Girls
health Enrichment Multi-stie Studies. Prev Med 2004, 38:S43-S49.
19. Klesges RC, Eck LH, Mellon MW, Fulliton W, Somes GW, Hanson CL: The
accuracy of self-reports of physical activity. Med Sci Sports Exerc 1990,
22(5):690-697.
20. Baranowski T: Validity and reliability of self report measures of physical
activity: an information-processing perspective. RES Q EXERCISE SPORT
1988, 59(4):314-327.
21. Tilgner L, Wertheim EH, Paxton SJ: Effect of social desirability on
adolescent girls’ response to an eating disorders prevention program.
Int J Eat Disord 2004 35:211-216.
22. Stevens J, Murray DM, Catellier DJ, Hannan PJ, Lytle LA, Elder JP, Young DR,
Simons-Morton DG, Webber LS: Design of the Trial of Activity in
Adolescent Girls (TAAG). Contr Clin Trials 2005 26:223-233.
23. 2000 CDC Growth Charts: United States. Centers for Disease Control and
Prevention, National Center for Health Statistics; [ />growthcharts], (assessed 21 April 2003).
24. Patrick K, Norman GJ, Calfas KJ, Sallis JF, Zabinski MF, Rupp J, Cella J: Diet,
Physical Activity, and Sedentary Behaviors as Risk Factors for
Overweight in Adolescence. Arch Pediatr Adolesc Med 2004, 158:385-390.
25. Treuth MS, Schmitz K, Catellier DJ, McMurray RG, Murray DM, Almeida MJ,
Going S, Norman JE, Pate R: Defining accelerometer thresholds for
activity intensities in adolescent girls. Med Sci Sports Exerc 2004,
36(7):1259-1266.
26. David FN: The moments of the z and F distributions. Biomet 1949,
36:394-403.
27. Bland JM, Altman DG: Statistical methods for assessing agreement
between two methods of clinical management. Lancet 1986, 1:307-310.
28. Hopkins WG: Bias in Bland-Altman but not regression validity analyses.
Sportscience 2004, 8:42-46.
29. Littell RC, Milliken GA, Stroup WW, Wolfinger RD: SAS system for mixed
models. SAS Institute, Carey NC; 1996.
30. SAS Institute: SAS/STAT User’s Guide, Version 8. Cary, NC: SAS Institute,
Inc; 1999.
doi:10.1186/1477-5751-10-2
Cite this article as: Affuso et al.: Validity of self-reported leisure-time
sedentary behavior in adolescents. Journal of Negative Results in
BioMedicine 2011 10:2.
Submit your next manuscript to BioMed Central
and take full advantage of:
• Convenient online submission
• Thorough peer review
• No space constraints or color figure charges
• Immediate publication on acceptance
• Inclusion in PubMed, CAS, Scopus and Google Scholar
• Research which is freely available for redistribution
Submit your manuscript at
www.biomedcentral.com/submit
Affuso et al. Journal of Negative Results in BioMedicine 2011, 10:2
/>Page 9 of 9