Báo cáo khoa hoc:" Applying the Stages of Change model to Type 2 diabetes care in Trinidad: A randomised trial" pptx
Bạn đang xem bản rút gọn của tài liệu. Xem và tải ngay bản đầy đủ của tài liệu tại đây (319.77 KB, 8 trang )
RESEARCH Open Access
Applying the Stages of Change model to Type 2
diabetes care in Trinidad: A randomised trial
VA Partapsingh
1
, RG Maharaj
2*
and JM Rawlins
2
Abstract
Objective: To improve glycaemic control among Type 2 diabetics using patient-physician consultations guided by
the Stages of Change (SOC) model.
Design and Methods: A randomised trial was conducte d. After ensuring concealment of allocation, Type 2
diabetics were randomly assigned to receive the intervention or the control. The intervention consisted of
identifying each patient’s Stage of Change for managing their diabetes by diet, exercise and medications, and
applying personalised, stage-specific care during the patient-physician consultations based on the SOC model.
Patients in the control group received routine care. The variables of interest were effect on glycaemic control
(measured by the difference in HbA
1c
levels) and patients’ readiness to change (measured by identifying patients’
SOC for managing their diabetes by diet, exercise and medications).
Results: Participants were primarily over age 50, male and Indo-Trinidadian. Most had received only a primary
school education and over 65% had a monthly income of $320 USD/month or less. Sixty-one Type 2 diabetics
participated in each arm. Three patients were lost to follow-up in the intervention arm. After 48 weeks, there was
an overall increase in HbA
1c
of 0.52% (SE 0.17) and 1.09% (SE 0.18) for both the intervention and control groups
respectively. There was a relative reduction in HbA
1c
of 0.57% (95% CI 0.07, 1.07) with the intervention group
compared to the control (p = 0.025). For exercise and diet there was an overall tendency for participants in the
intervention arm to move to a more favourable SOC, but little change was noted with regards medication use.
Conclusions: The result suggests a tendency to a worsening of glycaemic control in this population despite
adopting more favourable SOC for diet and exercise. We hypothesized that harsh social conditions prevailing at
the time of the study overrode the clinical intervention.
Background
The Stages of Change model postulates behavioural
change as a process of 5 identifiable stages through
which patients pass: precontemplation, contemplation,
preparation, action and maintenance [1-3]. The model
illustrates that for most persons a change in behaviour
occurs gradually, with the patient moving from being
uninterested, unaware or unwilling to make a change
(precontemplation), to considering a change (contempla-
tion), or deciding and preparing to make a change (pre-
parat ion); genuine , determined action is then taken and,
over time, attempts to maintain the new behaviour
occur [1]. This ‘ stage’ conc ept allows for apply ing a
tempora l dimension to the Stages of Change [4]. Within
the model, relapses are almost inevitable and become
part of the p rocess of working toward life-long change
[1].
The Stages of Change model has been evaluated in a
number of contexts [1,3,5], and although not widely
used to provide care for Type 2 diabetes, it has been
used to guide i nterventions for dietary change [5] and
exercise behavior [1], both of which are important in
managing diabetes. The intervention for this study was
developed incorporating the Stages of Change model
into the patient-physician consultation and attempted to
answer the question: Does using the Stages of Change
model to provide stage-specific and personalised care
for managing Type 2 diabetes by diet, exercise and med-
ications, improve glycaemic control in the Trinidadian
setting?
* Correspondence:
2
Unit of Public Health and Primary Care, Faculty of Medical Sciences, St.
Augustine, The University of the West Indies, Trinidad and Tobago
Full list of author information is available at the end of the article
Partapsingh et al. Journal of Negative Results in BioMedicine 2011, 10:13
/>© 2011 Partapsingh et al; lice nsee BioMed Central Ltd. This is an Open Access article distributed under the terms of the Creative
Commons Attribution License ( which permits unrestricted use, distribution, and
reproduction in any medium, provided the original work is properly cited.
Methods
The setting
Trinidad and Tobago has the sixth highest prevalence of
diabetes mellitus in th e Caribbean [6], affecting between
10 - 20% of adults, 85-90% of whom can be classified as
Type 2 diabetics [7,8]. Care for these patients in the
public health system in Trinidad and Tobago is pro-
vided by specialists at secondary and tertiary care cen-
tres and by primary care physicians at over 70 Primary
Health Care (PHC) centres. This research was con-
ducted at the Ste. Madeleine Health Centre (SMHC) in
south Trinidad. At th is clinic, care for Type 2 diabet es
is offered through weekly sessions: the Chronic Disease
(CD), Phlebotomy, Dietician, and Walk-in clinics.
Approximately 50 patients are scheduled for each ses-
sion with return visits in 16 weeks. The gover ning
health authority requires that Walk-In clinic services be
available everyday, all day. To facilitate this, the Walk-In
clinic is conducted simultaneously with the CD clinic,
using the same staff members. Two audits illustrate the
limits of the present policy. The first, an audit of dia-
betic control suggested that mean HbA
1c
was 8.5%.
Additionally an audit of patient-physician consultation
time determined that 59% of consultations lasted less
than 6 minutes and 38% lasted 4 minutes or less. Inter-
nat iona l studies report average consul tations in primary
care to range from 7-10 minutes [9]. Compromising on
consultation time for apparent efficiency may act to
diminish patient autonomy and encourage medical
paternalism by limiting discussion of patient values,
alternative treatments, or the impact of therapy on the
patient’ s overall life [10] . At the SMHC the current
approach has resulted in an increasing numbers of Type
2 diabetics who can be described as ‘frequent-visitors.’
Study design
Appr oval for the conduction of the study was granted by
the Ethics committee of the South West Regional Health
Authority. Patients who fu lfilled the inclusion and exclu-
sion criteria were randomly allocated to either the con-
trol group or an intervention group. Over 48 weeks,
subjects within the control group continued to receive
routine care; subjects within the intervention group were
treated with stage-specific, personalised care for Type 2
diabetes using t he Stages of Change model. To ensure
concealment of allocation, an independently designed
randomisation schedule using a table of random numbers
was created with sealed consecutively numbered opaque
envelopes. Each envelope contained a card indicating
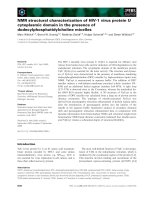
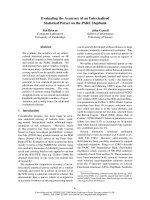
either “Intervention” or “Control”. See Figure 1.
Sample size
Sample size was calculated using the formul a [11]: Sam-
ple size (per e qually-sized group) = 16 ÷ (E/S)
2
.A
desiredeffect(E)sizeofHbA
1
c of 1% based on the
results of the UKPDS [12] and an audit described above
which provided a mean HbA
1
c of 8.48% and a standard
deviation (S) of the mean of 1.94% gave a sample size of
61 patients in each arm.
Inclusion and exclusion criteria
Patients were included if they were 69 years or less,
were registered in the clinic’s ‘Chronic Disease Register’
as Type 2 diabetics for the previous 12 months, not
using insulin therapy at the time of recruitment and
who agreed to participate after informed consent.
Patients were excluded if they had plans to travel abroad
for a period of more than four (4) weeks during the
study, lacked decision-making capacity, or w ho were
unable to perform activities of daily living. Additionally
those who were receiving scheduled additional Type 2
diabetes care at any secondary or tertiary care center
were also excluded. Once a pat ient was allocated to one
of the treat ment groups no other member of their
household was eligible to participate in the study.
Outcome variables
Primary outcome variable The primary outcome vari-
able measured was HbA
1c
level. All HbA1c samples
were tested at the same laboratory in the San Fer-
nando hospital, Southwest Regional Health Authority
in Trinidad. Other variables recorded includ ed Body
Mass Index , Blood pressure, plasma urea and creati-
nine, total cholesterol and triglycerides and random
glucometer values.
Secondary outcome variable Patients’ readiness to
change [1,2,4]
This represented patients’ SOC [4] measured by
identifying where patients are on the behaviour
change process [1] for each of di et, exercise and
management by medication.
All assessments were based on patient self-reported
data. Action stage for exercise was defined as a per-
son being involved in phys ical activity of moderate
intensity, 3-5 days a week for at least 30-45 minutes
per day. Action stage for medication use (for a per-
son) was defined as that person adhering to their
prescribed medication regimen. Action stage for diet
was assessed based on a person reporting use of a
specific dietary plan for managing diabetes.
The intervention
The intervention was ‘stage-specific’ and personalised: it
delivered care to Type 2 diabetics that was specific to
the patient’ s current SOC and specific to the patient as
a whole. These formats divided each consultation into
Partapsingh et al. Journal of Negative Results in BioMedicine 2011, 10:13
/>Page 2 of 8
sections specific for the named SOC. Each format was
translated into a form which was used at each patient-
physician consultation. Ther e were five forms in this
study and each patient was exposed to the one
appropriate to their present SOC with respect to diet,
exercise and medica tion use. These forms were used as
checklists for the physician to ensure all the sections of
the consultation were attended to during the visit.
Figure 1 Overview of study design.
Partapsingh et al. Journal of Negative Results in BioMedicine 2011, 10:13
/>Page 3 of 8
Examples of these forms are included in the appendix
(See Additional File 1). Consultation times were not
measured in this study.
The control group
Patients in the control group continued with their rou-
tine care, this involved monitoring weight, blood glu-
cose, blood pressure, discussing concerns with staff, if
any recognised; and receiving a prescription for their
appropriate medications.
Follow-up and adherence to protocol
The total number of patients in the control and inter-
vention groups were divided into four (4) subgroups and
seen at four (4) consecutive CD clinic sessions and four
(4) clinical sessions dedicated to the stage-specific perso-
nalized care for Type 2 diabetes patients, respectively.
This grouping was maintained throughout the study.
This pattern was repeated for each of the three 16-week
cycles. Patients from either group who did not attend
the SMHC for the following compulsory scheduled visits
(initial and fourth (final) plus either of 2
nd
or 3
rd
visits)
were not included in the statistical hypothesis testing.
Results
All patients in the control group completed the study.
Three (3) patients in the interventio n group were lost to
follow-up. The final analysis was performed with results
from one hundred and nineteen (119) patients. Complete
sets of measurements were available for one hundred and
eighteen (118) of these patients. The greatest proportion
of patients was between 40 to 59 years old; they were
equally distributed in both groups: forty (66%) patients in
the control and thirty-eight (62%) patients in the inter-
vention group. Male patients constituted the greatest
proportion of the research sample; thirty-nine (64%)
patients of the intervention group and forty (66%) of the
control group were males. Most patients in the study
were of East Indian ethnicity (85% of the interventi on
group and 93% of the control group). More than half of
the research sample had received only 7-8 years of formal
education up to the end of primary school, forty-one
(67%) pat ients in the control group, a nd thirty-five
patients (57%) in the intervention group. Baseline charac-
teristics are provided in Table 1 and results of the com-
plete set of variables are presented in Table 2.
Results from primary outcome variable and statistical test
of the hypothesis
The variable “Effect on glycaemic control” was the differ-
ence in glycaemic control (HbA
1c
)atthestartofthe
study from that at the end of the study for both the inter-
vention and control groups. The significance of this
“Effect on glycaemic control” was tested (a of 0.05) using
the independent-samples two-sided t-test. The result of
the statistical test indicated the “Effect on glycaemic con-
trol” observed for the study was significant (p =0.025):
the intervention did improve glycaemic control when
compared to the control group. From Table 2, glycaemic
control worsened for both groups compared to baseline.
The change in glycaemic control for the intervention
group was a mean increase in HbA
1c
of 0.52% (SE 0.17)
compared to that at baseline. The change in glycaemic
control for the control group was a mean increase in
HbA
1c
of 1.09% (SE 0.18) compared to that at baseline.
The “Effect on glycaemi c control” or the mean difference
in change in HbA
1c
for the intervention from the cont rol
group is -0.5 7% (95%CI 0.07 - 1.07). For all oth er vari-
ables the statistical analysis gave p-values > 0.05.
Results from secondary outcome variable - “Readiness to
change”
The largest number of patients to shift stages was
observed in the intervention group for managing Type 2
diabetes by exercise: twenty-one (21) pati ents had
moved positively and were more ready to change their
exercise behaviour by the end of the study. A longitudi-
nal comparison of the stage of change shifts for patients
at the start of the study and at the end was performed
and is illustrated in Figures 2, 3 and 4.
Among these twenty-one (21) patients: two (2) shifted
from precontemplation to contemp lation stage; three (3)
patients shifted from being in the precontemplation stage
to maintaining appropriate exercise behaviour for Type 2
Diabetes; four (4) patients were able to move to setting a
date to start the appropriate exercise behaviour from
initially being in the contemplatio n stag e; four (4)
patients each were able to move from preparation to
action stage and preparation t o maintenance stage; one
(1) person moved from the contemplation to the mainte-
nance stage; and three (3) patients continued the appro-
priate exercise behaviour throughout the study period.
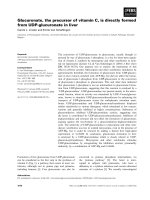
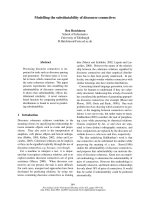
From the chart for dietary behaviour, the slope of the
line graphs illustrates that over the forty-eight (48) week
study period, the number of patients in the precontem-
plati on, contemplation and preparation stages decreased
while the number of patients in the action and mainte-
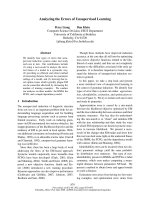
nance stages increased. For exercise behaviour, the pat-
tern is slightly different: the number of patients in the
precontemplation and preparation stages decreased and
the numbers in the maintenance stage increased as for
dietary behaviour, however, numbers in the contempla-
tion stage show no change and the number in the action
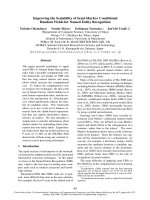
stage actually decreased. The line graphs for medication
use indicate little or no change except for a decrease in
the numbers of patients in the precontemplation stage.
Data on the number of patients who moved through
the stages of change was collected for both the
Partapsingh et al. Journal of Negative Results in BioMedicine 2011, 10:13
/>Page 4 of 8
intervention and control groups. Fewer persons e xperi-
enced a shift in SOC within the control group compared
to the intervention group. Within the control group, the
greatest number of positive shifts also occurred with
change in exercise behavior: 4 persons moved from the
action to maintenance stage, 1 person shifted from pre-
contemplation to action stage, 1 person shifted from
precontemplation to maintenance stage and 1 person
from preparation to action stage.
Discussion
The aim of the study to improve glycaemic control by
the end of the 48-week period was not realized. Inter-
estingly however, the hypothesis test i ndicated there
Table 1 Baseline characteristics of patients in the Intervention and Control groups
Descriptive characteristic Number of patients N (%)
Intervention group 61 (100) Control group 61 (100)
Age 20-39 years 6 (10) 2 (3)
40-49 years 16 (26) 8 (13)
50-59 years 22 (36) 32 (52)
60-69 years 17 (28) 19 (31)
Gender Male 39 (64) 40 (66)
Female 22 (36) 21 (34)
Ethnicity African 6 (10) 2 (3)
East Indian 52 (85) 57 (93)
Mixed 3 (5) 2 (3)
Education level None 5 (8) 8 (13)
Primary school (7-8 years duration) 35 (57) 41 (67)
Secondary school 11 (18) 6 (10)
Technical/vocational school 10 (16) 4 (7)
University 0 (0) 2 (3)
Employment status Retired 14 (23) 11 (18)
Permanently employed 8 (13) 8 (13)
Self-employed 8 (13) 9 (15)
Occasionally employed/Unemployed 10 (17) 14 (23)
Housewife only 21 (34) 19 (31)
Pension or Government assistance 20 (34) 24 (40)
Source of income Occupation 25 (41) 29 (48)
Savings 0 (0) 2 (3)
Spouse 14 (23) 19 (31)
Children who are employed 6 (10) 12 (20)
Other relative 1 (2) 0 (0)
Total monthly income < $500.00 2 (3) 4 (7)
< $1000.00 24 (39) 19 (31)
< $2000.00 16 (26) 21 (34)
> $2000.00 19 (31) 17 (28)
Duration as diabetic 1-5 years 27 (42) 16 (26)
5-10 years 21 (34) 21 (34)
> 10 years 13 (21) 24 (39)
Existing co-morbid conditions Hypertension 31 (51) 34 (56)
Ischaemic Heart Disease 5 (8) 9 (15)
Hypercholesterolemia 23 (38) 26 (43)
Asthma 0 (0) 1 (2)
Osteoarthritis 2 (3) 1 (2)
None 26 (43) 23 (38)
Partapsingh et al. Journal of Negative Results in BioMedicine 2011, 10:13
/>Page 5 of 8
was a stati stically significant difference between the
change in glycaemic control measured for the interven-
tion and control groups. The results from mean HbA
1c
indicated that all patients had poorer control of their
diabetes at the end of the study compared to baseline.
The hypothesis test indicated patients who received
the intervention had a significantly smaller increase in
HbA
1c
levels by the end of the study than those who
received the control. The statistical significance of this
result adds another dimension to the overall negative
result as follows: although both the intervention and
control groups had poorer glycaemic control reflected
by higher HbA
1c
levels compared to baseline, the
increase in HbA
1c
measured at the end of the 48-week
period was 0.57% less with the interventio n compared
to the control (p = 0.025).
Implications of the study
The negative result obtained highlight two important
considerations: first, there is some value to applying the
SOC model to type 2 diabetes care as evidenced by the
0.57% less rise in HbA
1
c relative to the control group,
and second, there is possibly a tendency for glycaemic
control to worsen over time among patients at SMHC.
What do we know about this topic so far?
A large RCT supports the findings of this paper which
suggests that patients can be moved from one stage of
change to another and that this can be beneficial [13].
The longitudinal com parisons of the stage of chang e
shifts from Figures 2, 3 and 4 illustrated these patterns
which add support to the intervention model and its
theory. A crossover pattern [14] was observed wherein
Table 2 Outcome variables and mean values at baseline and after 48 weeks for the intervention and control groups
Variable Intervention Group Control Group p-value
Baseline
Mean (SEM)
N=61
At 48 weeks
Mean (SEM)
N=58
Baseline
Mean (SEM)
N=61
At 48 weeks
Mean (SEM)
N=61
HbA
1
c (%) 8.5 (0.3) 9.1 (0.29) 8.2 (0.28) 9.3 (0.29) 0.025
Body Mass Index (kg/m2) 29.1 (0.66) 28.8 (0.68) 27.7 (0.58) 27.8 (0.57) *
Systolic BP (mmHg) 131.6 (2.32) 136.5 (2.43) 133.7 (2.44) 126.9 (1.92) *
Diastolic BP(mmHg) 85.6 (1.41) 83.4 (1.81) 83.3 (1.2) 82.8 (0.93) *
Plasma Urea (mmol/l) 14.3 (0.74) 15 (0.73) 16.6 (0.89) 16.4 (1.0) *
Plasma creatinine (mmol/l) 1.0 (0.03) 1.0 (0.02) 1.0 (0.04) 1.0 (0.05) *
Fasting Total Cholesterol (mg/dl) 214.3 (4.91) 214.4 (17.64) 232.7 (6.79) 217.2 (8.25) *
Fasting Total Triglycerides (mg/dl) 156.8 (15.73) 152.9 (10.33) 190.7 (23.4) 195.6 (22.87) *
Random glucometer value (mg/dl) 179.2 (9.06) 223.8 (11.12) 170.4 (9.54) 210.3 (7.73) *
Number of patients with albuminuria 10 (NA) 5 (NA) 8 (NA) 6 (NA)
Number of hypoglycemic episodes 00
* There was no significant difference between the intervention and control groups with p-values > 0.05 for all variables except HbA
1
c as discussed.
Movement through stage of change for diet
0
5
10
15
20
25
30
Precontemplation stage
Contemplation stage
Preparation stage
Action Stage
Maintenance stage
Stage of change
Number of patients
Baseline
End of study
Figure 2 Longitudinal comparisons of the Stage of Change
shifts for the intervention group for Dietary behaviour.
Movement through stages of change for exercise
0
5
10
15
20
25
30
35
Precontemplation stage
Contemplation stage
Preparation stage
Action Stage
Maintenance stage
Stage of change
Number of patients
Baseline
End of study
Figure 3 Longitudinal comparisons of the Stage of Change
shifts for the intervention group for Exercise behaviour.
Partapsingh et al. Journal of Negative Results in BioMedicine 2011, 10:13
/>Page 6 of 8
the number of patients in the precontemplation, con-
templation and preparation stages (collectively)
decreased while there was a simultaneous increase in
the number of patients in the action and maintenance
stages (collectively) at the end of the study.
In that publication application of a stage of change
model based intervention resulted in a greater reduction
of HbA1c than standard care, but this did not reach sta-
tistical significance [13]. So this paper adds to the litera-
ture by illustrating that a statistically significant
difference between intervention and controls can be
achieved (even though there are limits to our results as
we saw above).
What other factors may have caused this bilateral
worsening of glycemic control in both intervention and
control groups?
After dialogue with patients we postulate that severe
economic stress and social hardship facing the patients
who utilized the SMHC during the time of the study
and contributed to the unusual results. This economic
hardship occurred because of the closure of the sugar
factory, Caroni (1975) Limited [15] which was the major
employer in the Ste. Madeline area. This closure meant
that study participants would not have had the financial
wherewithal to fully carry out the planned behaviour
change, since this would involve more expensive diets
and time spent exercising. This study started in Febru-
ary 2006, 3 years after the closure of the sugar industry,
and at a time where many of the planned social buffers
had not yet been put in place.
Limitations of the Stages of Change model to Type 2
diabetes care at SMHC
The Stages of Change model was devised based on
obse rvations of people giving up smoking - an addictive
behaviour requiring complete cessation [16]. Smoking
can be considered to have one common set of behaviour
patterns as it is a single behaviour. Managing type 2 dia-
betes by diet, exercise and medication use needs to con-
sider the interaction of three different behaviours, each
having diff ering se ts of patterns, and each impacting on
glycaemic control.
It is possible that patients engaging in exercise and
dietary behaviours can be viewed as proceeding through
a continuous directional flow through steps beginning
with initiating the behaviour, followed by continuing it,
while constantly adapting it during the diabetes-disease
trajectory. Each of these steps, in turn, can be consid-
ered to have their unique set of SOC, including the pos-
sibility of new stages, and have their unique aims. The
intervention model did not incorporate such a complex
view of these behaviours and therefore it is possible that
this could have contributed to the results observed.
As we noted above there is a need for economic con-
siderations in whether the model succeeds or not.
Limitation of the study
Complete blinding at any level (single, double, triple)
was not achieved in this study since the PI provided
care to all patients- both the intervention and control
group. The PI was aware of the limits placed on the
study by his involvement in these steps and placed due
care on extraction of information from notes and in
care of patients to ensure his personal biases did not
interfere with the conduct of the study. Ideally addi-
tional personnel should be involved but the structure of
the health services clinic did not allow for this. We
acknowledge that this is a serious, but not fatal, short-
coming of the study.
Planning for the future
The overall results suggest the possibility of a tendency
for glycaemic control to be naturally worsen ed over
time at SMHC. This directs attention to other factors,
additional to the nature or style of the patient-physician
consultation, that are instrumental to the success of
achieving improved glycaemic control among type 2 dia-
betes at SMHC. These factors can include external phy-
sical factors, external psychological factors and internal
psychological factors [17].
Conclusion
The intervention used in this study was unable to
improve overall glycaemic control for patients at SMHC
despite the statistical significance of the relative reduc-
tion in HbA
1c
. The importance of othe r factors, espe-
cially the socio-economic factors influencing glycaemic
control at SMHC, has been highlighted. Additionally,
the possibility of an inherent tendency for glycaemic
Movement through stages of change for medication use
0
10
20
30
40
50
60
Precontemplation stage
Contemplation stage
Preparation stage
Action Stage
Maintenance stage
Stage of change
Number of patients
Baseline
End of study
Figure 4 Longitudinal comparisons of the Stage of Change
shifts for the intervention group for Medication use.
Partapsingh et al. Journal of Negative Results in BioMedicine 2011, 10:13
/>Page 7 of 8
control to be worsened at SMHC, due to the influence
of these factors, creates a worrying situation at the cen-
tre. The negative results obtained from this study pro-
vide a focal point to continue the search for an
appropriate intervention to effectively improve HbA
1c
at
the centre.
Additional material
Additional file 1: Appendix. There were five forms used in this study
for recording patient information based on their current Stage of Change
with respect to diet, exercise and medication use. These forms were
used as checklists for the physician to ensure all the sections of the
consultation were attended to during the visit. An Example of these
forms is included here.
Author details
1
Ste. Madeleine Health Centre, South-West Regional Health Authority,
Trinidad and Tobago.
2
Unit of Public Health and Primary Care, Faculty of
Medical Sciences, St. Augustine, The University of the West Indies, Trinidad
and Tobago.
Authors’ contributions
This work was carried out by VAP as a component of his Doctor of Medicine
(DM) (Family Medicine) degree from The University of the West Indies. RGM
and JMR were his academic supervisors during the process. VAP
conceptualized the project and RGM and JMR provided guidance to the
final protocol, design and implementation. VAP conducted the clinical
component and collected the data. All authors read, contributed to, and
approved the final document.
Competing interests
The authors declare that they have no competing interests.
Received: 13 January 2011 Accepted: 11 October 2011
Published: 11 October 2011
References
1. Zimmerman GL, Olsen CG, Bosworth MF: A ‘Stages of Change’ Approach
to Helping Patients Change Behavior. American Family Physician 2000,
61:1409-16.
2. Prochaska JO, Velicer WF, Rossi JS, Goldstein MG, Marcus BH, Rakowski W,
Fiore C, Harlow LL, Redding CA, Rosenbloom D, Rossi SR: Stages of Change
and Decisional Balance for 12 Problem Behaviors. Health Psychology 1994,
13(1):39-46.
3. Prochaska JO, Velicer WF, DiClemente CC, Fava J: Measuring process of
change: Application to smoking cessation. Journal of Consulting and
Clinical Psychology 1988, 56(4):520-8.
4. Cancer Prevention Research Centre: Detailed Overview of the
Transtheoretical Model. 2004 [ />detailedoverview.htm].
5. Ni Mhurchu C, Margetts BM, Speller VM: Applying the Stages-of-Change
Model to Dietary Change. Nutrition Reviews 1997, 55(1):10-16.
6. World Health Organisation (WHO): WHO country and regional data.[http://
www.who.int/diabetes/facts/world_figures/en/index3.html].
7. Gulliford MC, Ariyanayagam-Baksh SM, Bickram L, Picou D, Mahabir D:
Social Environment, Morbidity and Use of Health Care among People
with Diabetes Mellitus in Trinidad. Internal Journal of Epidemiology 1997,
26(3):620-7.
8. American Diabetes Association: Standards of Medical Care in Diabetes.
Diabetes Care 2005, 28(Suppl 1):4-36.
9. Collier J: Oxford Handbook of Clinical Specialties. London: Oxford
University Press;, 5 2000.
10. Warsi A, Wang PS, LaValley MP, Avorn J, Solomon DH: Self -management
education programs in chronic disease: a systematic review and
methodological critique of the literature. Arch Intern Med 2004,
164(15):1641-9.
11. Hulley SB, Cummings SR, Browner WS, Grady D, Hearst N, Newman TB:
Designing Clinical Research. Philadelphia (PA): Lippincott, Williams, Wilkins;,
2 2001.
12. Stratton IM, Adler AI, Neil HA, Matthews DR, Manley SE, Cull CA:
Association of glycemia and macrovascular and microvascular
complication of type 2 diabetes (UKPDS 35): prospective observational
study. BMJ 2000, 321:405-12.
13. Jones H, Edwards L, Vallis TM, Ruggiero L, Rossi SR, Rossi JS, Greene G,
Prochaska JO, Zinman B, Diabetes Stages of Change (DiSC) Study: Changes
in diabetes self-care behaviors make a difference in glycemic control:
the Diabetes Stages of Change (DiSC) study. Diabetes Care 2003,
26(3):732-7.
14. Prochaska JO, DiClemente CC, Norcross JC: In Search of How People
Change. American Psychologist 1992, 47(9):1102-1114.
15. Chullén J: Sweet words and harsh facts in Trinidad’ s sugar industry. 2010
[ />—actrav/
documents/publication/wcms_111457.pdf].
16. Goldberg DN, Hoffman AM, Farinha MF, Marder DC, Tinson-Mitchem L,
Burton D, Smith EG: Physician Delivery of Smoking-Cessation Advice
Based on the Stages-of-Change Model. Am J Prev Med 1994, 10(5):267-74.
17. Zgibor JC, Simmons D: Barriers to Blood Glucose Monitoring in a
Multiethnic Community. Diabetes Care 2002, 25:1772-1777.
doi:10.1186/1477-5751-10-13
Cite this article as: Partapsingh et al.: Applying the Stages of Change
model to Type 2 diabetes care in Trinidad: A randomised trial. Journal of
Negative Results in BioMedicine 2011 10:13.
Submit your next manuscript to BioMed Central
and take full advantage of:
• Convenient online submission
• Thorough peer review
• No space constraints or color figure charges
• Immediate publication on acceptance
• Inclusion in PubMed, CAS, Scopus and Google Scholar
• Research which is freely available for redistribution
Submit your manuscript at
www.biomedcentral.com/submit
Partapsingh et al. Journal of Negative Results in BioMedicine 2011, 10:13
/>Page 8 of 8