Báo cáo khoa hoc:" Diagnosis of tuberculosis: the experience at a specialized diagnostic laboratory" pdf
Bạn đang xem bản rút gọn của tài liệu. Xem và tải ngay bản đầy đủ của tài liệu tại đây (1.79 MB, 7 trang )
RESEARCH Open Access
Diagnosis of tuberculosis: the experience at a
specialized diagnostic laboratory
Anita Mashta
1†
, Pooja Mishra
1†
, Sonia Philipose
1†
, S Tamilzhalagan
1†
, Hanif Mahmud
2
, Sangeeta Bhaskar
1
and
Pramod Upadhyay
1*
Abstract
This work describes the experience at a tuberculosis clinical laboratory where relatively new TB diagnosis technologies;
nucleic acid detection of two target strands, IS6110 and devR, by PCR and microscopic observation drug susceptibility
(MODS) were used. The LJ culture was the gold standard. This evaluation was done from August 2007 to July 2009 on
463 sputum samples of tuberculosis suspects at a specialized tuberculosis clinic in Delhi, India.
None of the tests we evaluated can accurately detect the presence or absence of Mycobacterium tuberculosis in all
the samples and smear microscopy was found to be the most reliable assay in this study.
The PCR assay could detect down to 2 pg of H37Rv DNA. Sensitivity, specificity was 0.40, 0.60 and 0.19, 0.81 for
smear positive (n = 228) and negative samples (n = 235) respectively. In the MODS assay, sensitivity, specificity of
0.48, 0.52 and 0.38, 0.76 was observed for smear positive and negative samples. Sputum smear microscopy had
sensitivity of 0.77 and specificity of 0.70.
Introduction
Despite the availability of effecti ve and inexpensive ther-
apy, tuberculosis (TB) is one o f the leading causes of
death from an infectious disease. It is believed that the
clinical management o f TB is made more difficult by the
lack of a simple and effective diagnostic test. Correct and
timely diagnosis of TB is very important to achieve
higher compliance with the treatment, reduce transmis-
sion and to reduce the development of drug resistance.
Along with the emergence of evidence based diagnosis
approaches [1], a number of ne w technologies hav e been
introduced [2] . These include light-emitting diode
(LED)-based fluorescence microscopy [3], automated
liquid culture systems such as BacT/ALERT MP [4],
interferon-gamma release assays [5], etc.
Recently published meta-analys is and reviews make us
to believe that the future of TB diagnosis is bright. On the
other hand, WHO and other organizations su ch as FIND
(Geneva) perpetually call proposals for the development of
simple and cost effective tests for TB diagnosis. This sug-
gests that the current scenario is far from satisfactory and
not all the claims made by the researchers and companies
regarding the sensitivity and specificity etc. of the TB diag-
nostic tests are valid in actual ‘field conditions’.
We carried out an evaluation of relatively new TB diag-
nosis technologies. In addition to the direct sputum
microscopy, we performed nucleic acid detection of two
target strands, IS6110 and devR,byPCRandMODS.LJ
culture was used as the gold standard.
The direct sputum microscopy is still the primary
means for diag nosis of TB in In dia. Nucl eic acid amplifi-
cation tests (NAATs) in principle h ave h igh sen sitivity
and specificity. Due to the limited utility of IS6110 for TB
diagnosis in North India [6], we included another target
gene sequence, devR, which is expressed during hypoxia
conditions [7].
The existence of a toxic glycolipid, trehalose 6-6’ dim y-
colate (cord factor) of M. tuberculosis was known from a
long time [8-10]. Darzins and Fahr [11] demonstrated the
difference between pathogenic strains and non-pathogenic
strains on the basis of cord forming properties of
the mycobacterium. The cording of M. tuberculosis on
agar and i ts diagnostic potential was later demonstrated
by Lorian in 1966 [12,13]. It more recent time, the ability
of virulent M. t uberculosis togrowandfromcordshas
been demonstrated by a few groups [14,15]. Both of these
groups reported very high sensitivity of the test.
* Correspondence:
† Contributed equally
1
Product Development Cell, National Institute of Immunology, Aruna Asaf Ali
Marg, New Delhi 110067, India
Full list of author information is available at the end of the article
Mashta et al. Journal of Negative Results in BioMedicine 2011, 10:16
/>© 2011 Mashta et al; licensee BioMed Central Ltd. This is an Open Access article distributed under the terms of the Creative Commons
Attribution License (http://creativecom mons.org/licenses/by/2 .0), which permits unrestricted use, distribution, and reproduction in
any medium, provided the original work is properly cited.
A validation of such a test was carried out in Peru [16] and
given a new name, microscopic observation drug suscept-
ibility (MODS) to this assay.
This work describes the experience at the specialized
tuberculosis clinical laboratory. We observed disturbing
inconsistencies in results and it is hard to find explan a-
tions for the same.
Results
The detection limits of PCR
Serial dilutions of 200 ng H37Rv DNA were made in six
steps such that the amount of DNA in the final dilution
was 2 pg. PCR was performed on these dilutions for the
IS6110 gene and the lower detection limit of IS6110
sequence by PCR was found to be around 2 pg.
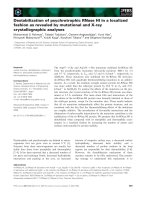
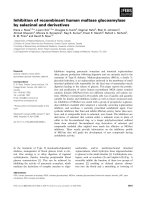
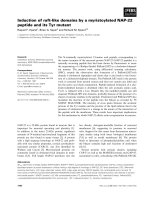
Typical results obtained from clinical samples
Some of the typical results obtained from clinical sam-
ples are shown in Figure 1. The distinct 197 base pairs
and 308 base pairs amplification bands of IS6110 and
devR respectively are neatly visible in DNA isolated
from sputum samples.
Results obtained by different diagnostic tests, over all
(463) as well as divided between smear positive (228)
and negative (235), are compared against the culture
reports. These are discussed below and compiled in
Table 1, 2 and 3.
PCR assay
The summary of data and analysis is shown in Table 1.
For the smear positive samples very low sensitivity 0.40
was observed which deteriorated to 0.19 for smear nega-
tive samples. The likelihood ratio of 1.37 for overall PCR
samples suggests that it could be of some importance to
finally classify a sample.
MODS assay
Results and analysis are shown in Table 2. The sensitiv-
ity figures observed with smear positive and negative
samples were 0.48 and 0.38 respectively; which make
Figure 1 Some representative results of the study. A typical gel pict ure showing amplification of IS6110 target sequence (A) and devR
sequence (B), a typical formation of cords by H37Rv (C) and sample (D) in the MODS assay.
Mashta et al. Journal of Negative Results in BioMedicine 2011, 10:16
/>Page 2 of 7
MODS results similar to P CR. Although slightly better
likelihood ratio of 1.53 for MODS may makes it more
preferred over PCR assay.
Sputum smear microscopy
Results and analysis are summarized in Table 3. The
sensitivity and specificity for smear microscopy was 0.77
and 0.70 respectively. The higher likelihood ratio of 2.6
can signifi cantly influence th e final outcome of the
readout.
Discussion
Limitations of the study
It is essential to highlight the limitations of this study
before any meaningful conclusion can be drawn.
1. We had access to only the results of the diagnostic
assays and therefore it is not possible to classify s peci-
mens on the basis of case history, age, sex etc.
2. We have used LJ culture as the gold standard and
this has led to some degree of underestimation of test
accuracy as some of the liquid culture assay like
BACTEC, MGIT etc. have around 10% higher sensitivity
[17]. When the sensitivity of gold standard (LJ culture
in our case) is not 100% and it is rarely non specific; the
sensitivity and not the specificity is the important para-
meter when comparison between LJ cultu re and ‘new
tests’ are made.
3.OurprocedurefortheMODSassaywassimilarto
the resources provided on />but there were minor differences.
We have used two well established sequences for the
NAATs [18,19] and we took extraordinary measures to
remove PCR inhibitors . The observed inconsistencies in
NAATs are perhaps a confirmation of the observation
that ‘ in-house’ NAATs produce highly inconsistent
results and have lower and highly variable sensitivity in
smear negative specimens [20,21].
The MODS is a very interesting liquid culture based
diagnostic assay [22]. Very high sensitivity of detection,
97.8% or similar [23] has been reported for this assay.
We were surprised that how in our case the sensitivit y
of MODS is so different.
Table 1 Summary of data for PCR and LJ culture
PCR and LJ culture
Smear +ve Smear -ve Overall
Culture +ve Culture -ve Total Culture +ve Culture -ve Total Culture +ve Culture -ve Total
PCR +ve 60(26.3) 32(14.0) 92(40.4) 9(3.8) 35(14.9) 44(18.7) 69(14.9) 71(15.3) 140(30.2)
PCR -ve 88(38.6) 48(21.1) 136(59.6) 39(16.6) 152(64.7) 191(81.3) 123(26.6) 200(43.2) 323(69.8)
Total 148(64.9) 80(35.1) 228(100) 48(20.4) 187(79.6) 235(100) 192(41.4) 271(58.5) 463(100)
Analysis of data
value 95% Confidence Interval value 95% Confidence Interval value 95% Confidence Interval
Sensitivity 0.40 0.32 to 0.49 0.19 0.089 to 0.32 0.36 0.29 to 0.43
Specificity 0.60 0.48 to 0.71 0.81 0.75 to 0.86 0.74 0.68 to 0.79
PPV 0.65 0.55 to 0.75 0.20 0.098 to 0.35 0.49 0.41 to 0.58
NPV 0.35 0.27 to 0.44 0.79 0.73 to 0.85 0.62 0.56 to 0.67
Likelihood Ratio 1.01 1.00 1.37
The comparison was carried out individually on smear +ve and -ve samples. Indicated values are n(%).
Table 2 Summary of data for MODS and LJ culture
MODS and LJ culture
Smear +ve Smear -ve Overall
Culture +ve Culture -ve Total Culture +ve Culture -ve Total Culture +ve Culture -ve Total
MODS +ve 72(31.6) 38(16.7) 110(48.2) 17(7.2) 45(19.1) 62(26.4) 89(19.2) 83(17.9) 172(37.1)
MODS -ve 76(33.3) 42(18.4) 118(51.7) 27(11.5) 146(62.1) 173(73.6) 103(22.2) 188(40.6) 291(62.8)
Total 148(64.9) 80(35.1) 228(100) 44(18.7) 191(81.3) 235(100) 192(41.4) 271(58.5) 463(100)
Analysis of data
Value 95% Confidence Interval Value 95% Confidence Interval Value 95% Confidence Interval
Sensitivity 0.49 0.40 to 0.57 0.39 0.24 to 0.55 0.46 0.39 to 0.54
Specificity 0.52 0.41 to 0.64 0.76 0.70 to 0.82 0.69 0.64 to 0.75
PPV 0.65 0.56 to 0.74 0.27 0.17 to 0.40 0.52 0.44 to 0.59
NPV 0.36 0.27 to 0.45 0.84 0.78 to 0.89 0.65 0.59 to 0.70
Likelihood Ratio 1.02 1.64 1.51
The comparison was carried out individually on smear +ve and -ve samples. Indicated values are n(%).
Mashta et al. Journal of Negative Results in BioMedicine 2011, 10:16
/>Page 3 of 7
The reason perhaps is the flawed generalization that all
pathogenic Mycobacterium tuberculosis form cords. Myco-
lic acids and mycolyl glycolipids are unique and ubiquitous
components of mycobacterial cell envelopes. Among such
components, TDM was first isolated a s cord factor from
highly virulent Mycobacterium tuberculosis showing cord-
like growth on the surface culture in liquid media. Later it
was demonstrated that most species of culture-able Myco-
bacteria including the BCG has TDM on their surface
[24]. Paradoxically, most tissue damage in TB disease is
not caused by Mycobacterium itself; instead it is caused by
body’s response towards the Mycobacterium [25]. There-
fore a generalization of the virulence of Mycobacterium on
the basis of its surface glycolip id or the property to form
cords cannot be accurate.
We did not have access to the profile and t he case his-
tory, such as for how long they were on antibiotics treat-
ment etc. of all the patients and therefore it is not
possible to provide an explanation for lower specificity of
micros cop y. In a realistic situation, not every patient has
or shares his/her case history with the hospital a nd such
samples are often excluded from most studies. After such
exclusions, we cannot hope to see the overview of the
clinic because such patients also get treatment on the
basis of their test reports. We therefore decided to
include all the samples even if they come without the
‘case history ’ and we could see a scenario which is the
‘true’ reflection, though it is difficult to interpret.
Possibly, the reason of poor correlation among differ-
ent tests is due to the fact that the limits of errors of
different methods and uncert ainties of samples vary dra-
matical ly from a research laboratory to a clinical labora-
tory. In a clinical laboratory, the diversity of samples
and limits of errors are generally high. In this study, we
observed the amplification of errors and limitations
when different methods (including the ‘ gold standard’ )
were put together. Although the sensitive assays like
NAATS, LJ and MODS can detect fewer Mycobacterium
but with every addition of steps in the methodology we
introduce additional errors and uncertainties also; intri-
cate steps are likely to add more errors.
Overall, our data s uggest that sputum smear micro-
scopy is a little better than any of the tests we evaluated.
It is the cheapest, simplest and the most straightforward
assay for TB diagnosis.
Materials and methods
All the steps were t aken to comply with the Standards
for the Reporting of Diagnostic accuracy studies
(STARD) checklist />Ethics Statement
National Institute of Immunology (NII) only received
anonymous, coded sputum specimens with no patient
identifiersanditwasapprovedbytheInstitutional
Human Ethics Committees of the NII, project serial
number IHEC#21/05.
Recruitment and Specimen collection
NDTB center fetches samples from a large geographical
area of North India. NDTB center is a Central TB Divi-
sion Ministry of Health, Governmen t of India, accre-
dited laboratory and training center. Necessary details
for the accreditation are given on india.
org/documents.asp.
Many (50-100) sputum samples of TB suspects are
received at the NDTB center daily and microscopy and LJ
culture are performed the same day. NII received coded,
single sputum sample from each patient from August
2007 to July 2009 on a working day, either in the second
or third week of the month. Due to the non-availability of
reagents, etc. samples could not be collected every month.
All t he samples received in the NDTB laboratory on that
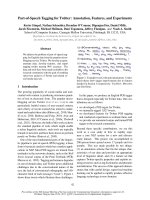
particular day were included in the study. Flow chart
shown in Figure 2 describes the movement of samples.
On a collection day, samples were divided in two ali-
quots and one of the aliquots was transported t o NII on
the same day on ice packs in double seal, air tight contain-
ers. Transportation time was than 1 hour. PCR and
MODS assay were performed within 12 hours. All the
tests were performed by highly skilled technicians and
trained research fellows. All of them had undergone man-
datory training o f two months for handling Mycobacter-
ium infected samples and setting up MODS and PCR
tests.
Blinding
HM at NDTB center was having the codes of samples. At
NII, PU coded the samples again and ensured that read-
out of all the assays remain blinded to each other. All the
codes were o pen only after completing t he study . None
Table 3 Summary of data for microscopy and LJ culture
Culture and Smear Microscopy
Culture +ve Culture -ve Total
Smear +ve 148(32.0) 80(17.2) 228(49.2)
Smear -ve 44(9.5) 191(41.2) 235(50.7)
Total 192(41.5) 271(58.5) 463(100)
Analysis of data
Value 95% Confidence Interval
Sensitivity 0.77 0.70 to 0.83
Specificity 0.70 0.65 to 0.76
PPV 0.65 0.58 to 0.71
NPV 0.81 0.76 to 0.86
Likelihood Ratio 2.61
Indicated values are n(%).
Mashta et al. Journal of Negative Results in BioMedicine 2011, 10:16
/>Page 4 of 7
of the details except smear microscopy result and culture
report of specimens were revealed by the NDTB center.
Microscopy
Detailed procedure used for microscopy is g iven at
cindia.or g/documents.asp. Briefly, sample
was placed in the centre of the slide, air dried for 15-20
minutes and fixed by passing through a flame. Filtered
carbol fuchsin was poured to cover the entire slide and
left a side for 5 minutes. Free carbol fuchsin stain was
then washed off under running water. The slide was
decolorized by 25% sulfuric acid treatment for 2-4 min-
utes and counterstained by 0.1% methylene blue for 30
seconds. The slide w as washe d under running water,
dried and around 100 fields were examined under the
microscope. Microscopy was done by experienced techni-
cians. They had undergone in house training for two
weeks at the begi nning of their carrier. All technicians
annually under go RNTCP training for 10 working days.
None of the technician at NDTB center has less than 5
years of experience. For the purpose of this study, sam-
ples were classified either as positive or negative without
any gradation of smear positive samples.
LJ culture
Samples were liquefied by 4% NaOH solution for 20 min-
utes, centrifuged at 3000 g and pellet was washed tw ice
with distilled water. One loopful of concentrated pallet
was inculated on to the LJ slope prepared in McCartney
bottle. Growth of Mycobacterium wa s examine d every
week. Contaminated cultures were identified within a
week’ s time. Such cases were less than 4%. These were
notexcludedfromthestudyandpatientswerecalled
again to collect another sample. Cultures were incubated
for eight weeks before classifying them as negative. Plates
were examined till 8 w eeks be fore conside ring them as
negative. NIACIN production, catalase activity at 68°C
and nitrate reduction tests were performed to ensure that
NTMs were not counted as culture positive. Det ailed
procedure is given at />ments.asp.
MODS assay
Isolation of cells
A thorough standardization of NaOH concentration in
sputum liquefaction solution and duration and force of
centrifugation was conducted. Mucus in the sputum sam-
ple was liquefied by mixing 5 ml (maximum) sputum with
equal volume of 1%NaOH, 0.5% N-Acetyl-L-Cysteine and
1.44% Sodium Citrate solution. After incubation at room
temperature for 15 minutes this mix was cent rifuged at
2000 g for 30 minutes. The resulting pellet was washed
with PBS and re-suspended 1 ml PBS.
Setting up the assay
We followed the procedure outlined in http://modsperu.
org/ with minor variations. Briefly, Middlebrook 7H9
broth medium with 10% OADC supplement and antibiotic
mixture (Carbenicillin disodium salt-50 mg /l, Cyclohexi-
mide-0.4 mg/l, Amphotericin B-15 mg/l, Polymyxin B-Sul-
phate-26 mg/l and Vancomycin-10 mg/l) was taken in 24
well plate. All of these reagents were purchased from Hi-
Media, India. Each well had 1.5 ml of the medium. Three
diff erent volumes, 10 μl, 20 μl, and 50 μl of cells isolated
from sputum were inoculated in triplicates. Only one spe-
cimen was plated on a plate. Every plate had H37Rv cul-
ture and blank in duplicates as positive and negative
Figure 2 Flow chart describing movement and processing of sputum samples.
Mashta et al. Journal of Negative Results in BioMedicine 2011, 10:16
/>Page 5 of 7
control respectively. The culture plates were sealed from
the all four sides and kept inside a polythene envelope and
sealed again and incub ated at 37°C. After 3 days cultures
were examined daily to detect the formation of cords
under an inverted microscope at 10× objective. Formation
of cords in any of the triplicates, at any of plating concen-
trat ion wa s classified as positive. Upon classifying a plate
as positive, it was removed from the incubator and appro-
priately discarded. Specimens were incubated for two
weeks before classifying them as negative.
Nucleic acid detection
DNA extraction
After setting up the MODS assay, in the remaining frac-
tion of cell suspension inhibitor removal solution contain-
ing 5 M GITC, 25 mM EDTA, Sarcosyl 0.5% w/v, 0.2 M
b-mercaptoethanol in 50 mM Tris-Cl (Trisma base) pH
7.5 was added for removing PCR inhibitors for 15 minutes
and it was washed with 50 mM PBS. DNA was isolated by
spin column (MDI Miniprep kit) and suggested pr otocol
was followed. Briefly, the pellet was re-suspended with
350 μl of BT-1 (MDI Miniprep kit) solution. 20 μl of 10%
lysozyme (Si gma) was added to lyse the ce ll. It was incu-
bated for 1 hour at 37°C. Then 5 μl of 0.1% Prot einase K
(Bio Basic Inc.) and 1 μl of 10% RNase (Bio Basic Inc.) was
added and incubated at 50°C for 30 minutes. 350 μlofBT-
2 (MDI Miniprep kit) solution was then added and kept at
50°C for 30 minutes. It was then centrifuged at 2000 g for
2 minutes. The supernatant was transferred into spin col-
umn and centrifuged at 16,000 g for 2 minutes. The col-
umn was then washed with wash buffer and kept at room
temperature for 15-20 minutes to evaporate the wash buf-
fer. DNA was coll ected by plac ing 100 μl of Mi llQ water
over the column and collected DNA was stored at -20°C.
In every DNA extraction cycle, a specimen containing
H37Rv culture and blank were included as positive and
negative control respectively.
Preparation of test genomic DNA
H37Rv culture was grown in 7H9 medium with 10%
OADC supplement. DNA was isolated by spin column
(MDI Miniprep kit) and the yield was estimated by mea-
suring the absorbance at 260 nm and 280 nm.
PCR assay
We used no ‘industry standard’ tuberculosis diagnosis PCR
assay kit and all necessary standardizati on was ‘in-house’
and used extensively studied target sequences, IS6110 and
devR for the PCR assay. iNtron Biotechnology kit was
used to perform the PCR. A single PCR of 20 μlconsists
of 2 μl of 10X PCR buffer, 50 μMdNTPs,0.2μM of for-
ward primer and reverse primer each, 0.75 Unit of Taq
DNA Polymerase along w ith 2 μl test DNA solution and
water. After an initial denaturation at 94°C for 5 minutes,
45 cycles of 94°C for 45 s (denaturation), 60°C for 45 s
(annealing), 72°C for 45 s (e xtension) were performed on
Eppendorf Mastercycler. After completing thermal cycles
the final extension at 72°C for 7 minutes was carried out.
Amplified amplicons were reso lved in 2% agaros e gel. In
every PCR assay, confirmed genomic DNA of H37Rv and
a blank were included as positive and negative control.
Primers and probes
devR gene
Amplicon length - 308 base pairs
Forward Primer - 177 5’ TGGCAACGGCATTGAAC
TGT 3’ 196
Reverse Primer - 484 5’ TAAGCAGGCCCAGTAG
CGT 3’ 466
IS6110 gene
Amplicon length -197 base pairs
Forward Primer - 502 5’TTCGGACC ACCAGCACC-
TAACC 3’ 523
Reverse Primer - 698 5’ CCTTCTTGTTGGCG
GGTCCAG 3’ 678
Data analysis
The statistical analysis was performed using Graph Pad
Instat software (GraphPad Software Inc.) version 3.05.
Acknowledgements
This work was supported by the core grant received from the Department
of Biotechnology, Government of India and project grant number BT/
PR7816/med/14/1122/2006.
Author details
1
Product Development Cell, National Institute of Immunology, Aruna Asaf Ali
Marg, New Delhi 110067, India.
2
New Delhi Tuberculosis Center, JLN Marg,
Delhi Gate, Delhi 110002, India.
Authors’ contributions
AM, PM, SP and ST performed the PCR and MODS assay. HM supervised
sample collection and was responsible for microscopy and LJ culture. SB
analyzed the data. PU performed and was responsible for the PCR and
MODS assay, analyzed data and wrote the paper. All authors read and
approved the final manuscript.
Competing interests
The authors declare that they have no competing interests.
Received: 17 October 2011 Accepted: 18 November 2011
Published: 18 November 2011
References
1. Pai M, Ramsay A, O’Brien R: Evidence-based tuberculosis diagnosis. PLoS
Med 2008, 5:e156.
2. Minion J, Zwerling A, Pai M: Diagnostics for tuberculosis: what new
knowledge did we gain through The International Journal of
Tuberculosis and Lung Disease in 2008? Int J Tuberc Lung Dis 2009,
13:691-697.
3. Steingart KR, Henry M, Ng V, Hopewell PC, Ramsay A, Cunningham J,
Urbanczik R, Perkins M, Aziz MA, Pai M: Fluorescence versus conventional
sputum smear microscopy for tuberculosis: a systematic review. Lancet
Infect Dis 2006, 6:570-581.
4. Pai M, Minion J, Sohn H, Zwerling A, Perkins MD: Novel and improved
technologies for tuberculosis diagnosis: progress and challenges. Clin
Chest Med 2009, 30:701-16, viii.
5. Pai M, Zwerling A, Menzies D: Systematic review: T-cell-based assays for
the diagnosis of latent tuberculosis infection: an update. Ann Intern Med
2008, 149:177-184.
Mashta et al. Journal of Negative Results in BioMedicine 2011, 10:16
/>Page 6 of 7
6. Siddiqi N, Shamim M, Amin A, Chauhan DS, Das R, Srivastava K, Singh D,
Sharma VD, Katoch VM, Sharma SK, et al: Typing of drug resistant isolates
of Mycobacterium tuberculosis from India using the IS6110 element
reveals substantive polymorphism. Infect Genet Evol 2001, 1:109-116.
7. Bagchi G, Mayuri Tyagi JS: Hypoxia-responsive expression of
Mycobacterium tuberculosis Rv3134c and devR promoters in
Mycobacterium smegmatis. Microbiology 2003, 149:2303-2305.
8. Kato M: Effect of diphtherial cord factor and diphtherial toxin on
mitochondrial oxidative phosphorylation. Jpn J Med Sci Biol 1972,
25:230-235.
9. Kato M: [Mechanism of action of cord factor (trehalose-6,6’-dimycolate)
of Mycobacterium tuberculosis]. Kekkaku 1972, 47:93-101.
10. Kato M: [Significance of cord factor in pathogenesis of tuberculosis
(author’s transl)]. Kekkaku 1974, 49:229-238.
11. Darzins E, Fahr G: Cord-forming property, lethality and pathogenicity of
Mycobacteria. Dis Chest 1956, 30:642-648.
12. Lorian V: Direct cord reading medium for isolation of mycobacteria. Appl
Microbiol 1966, 14:603-607.
13. Lorian V: Direct cord reading agar in routine mycobacteriology. Appl
Microbiol 1969, 17:559-562.
14. Moore DA, Mendoza D, Gilman RH, Evans CA, Hollm Delgado MG, Guerra J,
Caviedes L, Vargas D, Ticona E, Ortiz J, et al: Microscopic observation drug
susceptibility assay, a rapid, reliable diagnostic test for multidrug-
resistant tuberculosis suitable for use in resource-poor settings. J Clin
Microbiol 2004, 42:4432-4437.
15. Yagupsky PV, Kaminski DA, Palmer KM, Nolte FS: Cord formation in
BACTEC 7H12 medium for rapid, presumptive identification of
Mycobacterium tuberculosis complex. J Clin Microbiol 1990, 28:1451-1453.
16. Moore DA, Evans CA, Gilman RH, Caviedes L, Coronel J, Vivar A, Sanchez E,
Pinedo Y, Saravia JC, Salazar C, et al: Microscopic-observation drug-
susceptibility assay for the diagnosis of TB. N Engl J Med 2006,
355:1539-1550.
17. Chauhan A, Chauhan DS, Parashar D, Gupta P, Sharma VD, Sachan AS,
Gupta R, Agarawal BM, Katoch VM: DNA fingerprinting of Mycobacterium
tuberculosis isolates from Agra region by IS 6110 probe. Indian J Med
Microbiol 2004, 22:238-240.
18. Thierry D, Brisson-Noel A, Vincent-Levy-Frebault V, Nguyen S, Guesdon JL,
Gicquel B: Characterization of a Mycobacterium tuberculosis insertion
sequence, IS6110, and its application in diagnosis. J Clin Microbiol 1990,
28:2668-2673.
19. Chakravorty S, Pathak D, Dudeja M, Haldar S, Hanif M, Tyagi JS: PCR
amplification of shorter fragments from the devR (Rv3133c) gene
significantly increases the sensitivity of tuberculosis diagnosis. FEMS
Microbiol Lett 2006, 257:306-311.
20. Flores LL, Pai M, Colford JM Jr, Riley LW: In-house nucleic acid
amplification tests for the detection of Mycobacterium tuberculosis in
sputum specimens: meta-analysis and meta-regression. BMC Microbiol
2005, 5:55.
21. Sarmiento OL, Weigle KA, Alexander J, Weber DJ, Miller WC: Assessment by
meta-analysis of PCR for diagnosis of smear-negative pulmonary
tuberculosis. J Clin Microbiol 2003, 41:3233-3240.
22. Michael JS, Daley P, Kalaiselvan S, Latha A, Vijayakumar J, Mathai D, John KR,
Pai M: Diagnostic accuracy of the microscopic observation drug
susceptibility assay: a pilot study from India. Int J Tuberc Lung Dis 2010,
14:482-488.
23. Moore DA, Evans CA, Gilman RH, Caviedes L, Coronel J, Vivar A, Sanchez E,
Pinedo Y, Saravia JC, Salazar C, et al: Microscopic-observation drug-
susceptibility assay for the diagnosis of TB. N Engl J Med 2006,
355:1539-1550.
24. Kai M, Fujita Y, Maeda Y, Nakata N, Izumi S, Yano I, Makino M: Identification
of trehalose dimycolate (cord factor) in Mycobacterium leprae. FEBS Lett
2007, 581:3345-3350.
25. van Crevel R, Ottenhoff TH, van der Meer JW: Innate immunity to
Mycobacterium tuberculosis. Clin Microbiol Rev 2002, 15:294-309.
doi:10.1186/1477-5751-10-16
Cite this article as: Mashta et al.: Diagnosis of tuberculosis: the
experience at a specialized diagnostic laboratory. Journal of Negative
Results in BioMedicine 2011 10:16.
Submit your next manuscript to BioMed Central
and take full advantage of:
• Convenient online submission
• Thorough peer review
• No space constraints or color figure charges
• Immediate publication on acceptance
• Inclusion in PubMed, CAS, Scopus and Google Scholar
• Research which is freely available for redistribution
Submit your manuscript at
www.biomedcentral.com/submit
Mashta et al. Journal of Negative Results in BioMedicine 2011, 10:16
/>Page 7 of 7