Harris'''' Shock and Vibration Handbook Part 6 pps
Bạn đang xem bản rút gọn của tài liệu. Xem và tải ngay bản đầy đủ của tài liệu tại đây (819.59 KB, 82 trang )
VIBRATION TRANSDUCERS 12.7
FIGURE 12.5 Acceleration response to a half-sine pulse of accelera-
tion of duration τ (dashed curve) of a mass-spring transducer whose
natural period τ
n
is equal to: (A) 1.014 times the duration of the pulse
and (B) 0.203 times the duration of the pulse. The fraction of critical
damping ζ is indicated for each response curve. (Levy and Kroll.
1
)
FIGURE 12.6 Acceleration response to a triangular pulse of acceler-
ation of duration τ (dashed curve) of a mass-spring transducer whose
natural period is equal to: (A) 1.014 times the duration of the pulse and
(B) 0.203 times the duration of the pulse. The fraction of critical damp-
ing ζ is indicated for each response curve. (Levy and Kroll.
1
)
8434_Harris_12_b.qxd 09/20/2001 11:15 AM Page 12.7
between the pulse and the response; this occurs when τ
n
is approximately equal to τ.
However, when τ
n
is small relative to τ (Figs. 12.5B to 12.7B), the deviation between
the pulse and the response is much smaller. If a shock is generated by metal-to-metal
impact or by a pyrotechnic device such as that described in Chap. 26, Part II, and the
response accelerometer is located in close proximity to the excitation source(s), the
initial pulses of acceleration may have an extremely fast rise time and high ampli-
tude. In such cases, any type of mass-spring accelerometer may not accurately follow
the leading wave front and characterize the shock inputs faithfully. For example,
measurements made in the near field of a high-g shock show that undamped
piezoresistive accelerometers having resonance above 1 MHz were excited at reso-
nance, thereby invalidating the measured responses. To avoid this effect, accelerom-
eters should be placed as far away as possible, or practical, from the source of
excitation. Other considerations related to accelerometer resonance are discussed
below in the sections on Zero Shift and Survivability.
2. Damping in the transducer reduces the response of the transducer at its own
natural frequency; i.e., it reduces the transient vibration superimposed upon the
pulse, which is sometimes referred to as ringing. Damping also reduces the maxi-
mum value of the response to a value lower than the actual pulse in the case of large
damping. For example, in some cases a fraction of critical damping ζ=0.7 provides
an instrument response that does not reach the peak value of the acceleration pulse.
Low-Frequency Response. The measurement of shock requires that the
accelerometer and its associated equipment have good response at low frequencies
because pulses and other types of shock motions characteristically include low-
frequency components. Such pulses can be measured accurately only with an instru-
mentation system whose response is flat down to the lowest frequency of the
spectrum; in general, this lowest frequency is zero for pulses.
12.8 CHAPTER TWELVE
FIGURE 12.7 Acceleration response to a rectangular pulse of
acceleration of duration τ (dashed curve) of a mass-spring transducer
whose natural period τ
n
is equal to: (A) 1.014 times the duration of
the pulse and (B) 0.203 times the duration of the pulse. The fraction
of critical damping ζ is indicated for each response curve. (Levy and
Kroll.
1
)
8434_Harris_12_b.qxd 09/20/2001 11:15 AM Page 12.8
The response of an instrumentation system is defined by a plot of output voltage
vs. excitation frequency. For purposes of shock measurement, the decrease in
response at low frequencies is significant. The decrease is defined quantitatively by
the frequency f
c
at which the response is down 3 dB or approximately 30 percent
below the flat response which exists at the higher frequencies. The distortion which
occurs in the measurement of a pulse is related to the frequency f
c
as illustrated in
Fig. 12.8.
VIBRATION TRANSDUCERS 12.9
FIGURE 12.8 Response of an accelerometer to a half-sine accelera-
tion pulse for RC time constants equal to τ,5τ,10τ,50τ, and ∞, where τ is
equal to the duration of the half-sine pulse.
1
This is particularly important when acceleration data are integrated to obtain
velocity, or integrated twice to obtain displacement.A small amount of undershoot
shown in Fig. 12.8 may cause a large error after integration.A dc-coupled accelerom-
eter (such as a piezoresistive accelerometer, described later in this chapter) is rec-
ommended for this type of application.
Zero Shift. Zero shift is the displacement of the zero-reference line of an
accelerometer after it has been exposed to a very intense shock. This is illustrated in
Fig. 12.9.The loss of zero reference and the apparent dc components in the time his-
tory cause a problem in peak-value determination and induce errors in shock
response spectrum calculations.Although the accelerometer is not the sole source of
zero shift, it is the main contributor.
All piezoelectric shock accelerometers, under extreme stress load (e.g., a sensing
element at resonance), will exhibit zero-shift phenomena due either to crystal
domain switching or to a sudden change in crystal preload condition.
2
A mechanical
filter may be used to protect the crystal element(s) at the expense of a limitation in
bandwidth or possible nonlinearity.
3
Piezoresistive shock accelerometers typically
produce negligible zero shift.
Survivability. Survivability is the ability of an accelerometer to withstand
intense shocks without affecting its performance. An accelerometer is usually rated
in terms of the maximum value of acceleration it can withstand. Accelerometers
used for shock measurements may have a range of well over many thousands of gs.
In piezoresistive accelerometers which are excited at resonance, the stress buildup
8434_Harris_12_b.qxd 09/20/2001 11:15 AM Page 12.9
due to high magnitudes of acceleration may lead to fracture of the internal compo-
nents. In contrast, piezoelectric accelerometers are more robust than their piezore-
sistive counterparts due to lower internal stress.
IMPORTANT CHARACTERISTICS OF
ACCELEROMETERS
SENSITIVITY
The sensitivity of a shock- and vibration-measuring instrument is the ratio of its elec-
trical output to its mechanical input.The output usually is expressed in terms of volt-
age per unit of displacement, velocity, or acceleration. This specification of
sensitivity is sufficient for instruments which generate their own voltage independ-
ent of an external voltage power source. However, the sensitivity of an instrument
requiring an external voltage usually is specified in terms of output voltage per unit
of voltage supplied to the instrument per unit of displacement, velocity, or accelera-
tion, e.g., millivolts per volt per g of acceleration. It is important to note the terms in
which the respective parameters are expressed, e.g., average, rms, or peak. The rela-
tion between these terms is shown in Fig. 12.10. Also see Table 1.3.
RESOLUTION
The resolution of a transducer is the smallest change in mechanical input (e.g., accel-
eration) for which a change in the electrical output is discernible.The resolution of an
accelerometer is a function of the transducing element and the mechanical design.
Recording equipment, indicating equipment, and other auxiliary equipment used
with accelerometers often establish the resolution of the overall measurement sys-
12.10 CHAPTER TWELVE
FIGURE 12.9 A time history of an accelerometer that has been exposed to
a pyrotechnic shock. Note that there is a shift in the baseline (i.e., the zero ref-
erence) of the accelerometer as a result of this shock; the shift may either be
positive or negative.
8434_Harris_12_b.qxd 09/20/2001 11:15 AM Page 12.10
tem. If the electrical output of an instru-
ment is indicated by a meter, the resolu-
tion may be established by the smallest
increment that can be read from the
meter. Resolution can be limited by
noise levels in the instrument or in the
system. In general, any signal change
smaller than the noise level will be
obscured by the noise, thus determining
the resolution of the system.
TRANSVERSE SENSITIVITY
If a transducer is subjected to vibration
of unit amplitude along its axis of maxi-
mum sensitivity, the amplitude of the
voltage output e
max
is the sensitivity. The
sensitivity e
θ
along the X axis, inclined at
an angle θ to the axis of e
max
, is e
θ
= e
max
cos θ, as illustrated in Fig. 12.11. Simi-
larly, the sensitivity along the Y axis is
e
t
= e
max
sin θ. In general, the sensitive axis of a transducer is designated. Ideally, the
X axis would be designated the sensitive axis, and the angle θ would be zero. Practi-
cally, θ can be made only to approach zero because of manufacturing tolerances
and/or unpredictable variations in the characteristics of the transducing element.
Then the transverse sensitivity (cross-axis sensitivity) is expressed as the tangent of
the angle, i.e., the ratio of e
t
to e
θ
:
= tan θ (12.11)
In practice, tan θ is between 0.01 and 0.05 and is expressed as a percentage. For
example, if tan θ=0.05,the transducer is said to have a transverse sensitivity of 5 per-
cent. Figure 12.12 is a typical polar plot
of transverse sensitivity.
AMPLITUDE LINEARITY
AND LIMITS
When the ratio of the electrical output
of a transducer to the mechanical input
(i.e., the sensitivity) remains constant
within specified limits, the transducer is
said to be “linear” within those limits, as
illustrated in Fig. 12.13. A transducer is
linear only over a certain range of
amplitude values. The lower end of this
range is determined by the electrical
noise of the measurement system.
The upper limit of linearity may be
imposed by the electrical characteristics
e
t
ᎏ
e
θ
VIBRATION TRANSDUCERS 12.11
FIGURE 12.10 Relationships between aver-
age, rms, peak, and peak-to-peak values for a
simple sine wave. These values are used in speci-
fying sensitivities of shock and vibration trans-
ducers (e.g., peak millivolts per peak g, or rms
millivolts per peak-to-peak displacement).
These relationships do not hold true for other
than simple sine waves.
FIGURE 12.11 The designated sensitivity e
θ
and cross-axis sensitivity e
t
that result when the
axis of maximum sensitivity e
max
is not aligned
with the axis of e
θ
.
8434_Harris_12_b.qxd 09/20/2001 11:15 AM Page 12.11
of the transducing element and by the size or the fragility of the instrument. Gen-
erally, the greater the sensitivity of a transducer, the more nonlinear it will be. Sim-
ilarly, for very large acceleration values, the large forces produced by the spring of
the mass-spring system may exceed the yield strength of a part of the instrument,
causing nonlinear behavior or complete
failure.
2
FREQUENCY RANGE
The operating frequency range is the
range over which the sensitivity of the
transducer does not vary more than a
stated percentage from the rated sensitiv-
ity. This range may be limited by the elec-
trical or mechanical characteristics of the
transducer or by its associated auxiliary
equipment. These limits can be added to
amplitude linearity limits to define com-
pletely the operating ranges of the instru-
ment, as illustrated in Fig. 12.14.
Low-Frequency Limit. The mechani-
cal response of a mass-spring transducer
does not impose a low-frequency limit
for an acceleration transducer because
the transducer responds to vibration
with frequencies less than the natural
frequency of the transducer.
12.12 CHAPTER TWELVE
FIGURE 12.12 Plot of transducer sensitivity
in all axes normal to the designated axis e
θ
plot-
ted according to axes shown in Fig. 12.11. Cross-
axis sensitivity reaches a maximum e
t
along the
Y axis and a minimum value along the Z axis.
FIGURE 12.13 Typical plot of sensitivity as a
function of amplitude for a shock and vibration
transducer.The linear range is established by the
intersection of the sensitivity curve and the spec-
ified limits (dashed lines).
FIGURE 12.14 Linear operating range of a
transducer.Amplitude linearity limits are shown
as a combination of displacement and accelera-
tion values. The lower amplitude limits usually
are expressed in acceleration values as shown.
8434_Harris_12_b.qxd 09/20/2001 11:15 AM Page 12.12
In evaluating the low-frequency limit, it is necessary to consider the electrical
characteristics of both the transducer and the associated equipment. In general, a
transducing element that utilizes external power or a carrier voltage does not have a
lower frequency limit, whereas a self-generating transducing element is not opera-
tive at zero frequency. The frequency response of amplifiers and other circuit com-
ponents may limit the lowest usable frequency of an instrumentation system.
High-Frequency Limit. An acceleration transducer (accelerometer) has an upper
usable frequency limit because it responds to vibration whose frequency is less than
the natural frequency of the transducer.
The limit is a function of (1) the natural
frequency and (2) the damping of the
transducer, as discussed with reference
to Fig. 12.3. An attempt to use such a
transducer beyond this frequency limit
may result in distortion of the signal, as
illustrated in Fig. 12.15.
The upper frequency limit for slightly
damped vibration-measuring instru-
ments is important because these instru-
ments exaggerate the small amounts of
harmonic content that may be contained
in the motion, even when the operating
frequency is well within the operating
range of the instrument. The result of
exciting an undamped instrument at its
natural frequency may be to either dam-
age the instrument or obscure the de-
sired measurement. Figure 12.15 shows how a small amount of harmonic distortion
in the vibratory motion may be exaggerated by an undamped transducer.
Phase Shift. Phase shift is the time delay between the mechanical input and the
electrical output signal of the instrumentation system. Unless the phase-shift char-
acteristics of an instrumentation system meet certain requirements, a distortion may
be introduced that consists of the superposition of vibration at several different fre-
quencies. Consider first an accelerometer, for which the phase angle θ
1
is given by
Fig. 12.4. If the accelerometer is undamped, θ
1
= 0 for values of ω/ω
n
less than 1.0;
thus, the phase of the relative displacement δ is equal to that of the acceleration
being measured, for all values of frequency within the useful range of the accelerom-
eter. Therefore, an undamped accelerometer measures acceleration without distor-
tion of phase. If the fraction of critical damping ζ for the accelerometer is 0.65, the
phase angle θ
1
increases approximately linearly with the frequency ratio ω/ω
n
within
the useful frequency range of the accelerometer.Then the expression for the relative
displacement may be written
δ=δ
0
cos (ωt −θ) =δ
0
cos (ωt − aω) =δ
0
cos ω(t − a) (12.12)
where a is a constant. Thus, the relative motion δ of the instrument is displaced in
phase relative to the acceleration ü being measured; however, the increment along
the time axis is a constant independent of frequency. Consequently, the waveform of
the accelerometer output is undistorted but is delayed with respect to the waveform
of the vibration being measured. As indicated by Fig. 12.4, any value of damping in
VIBRATION TRANSDUCERS 12.13
FIGURE 12.15 Distorted response (solid line)
of a lightly damped (ζ<0.1) mass-spring ac-
celerometer to vibration (dashed line) containing
a small harmonic content of the small frequency
as the natural frequency of the accelerometer.
8434_Harris_12_b.qxd 09/20/2001 11:15 AM Page 12.13
an accelerometer other than ζ=0 or ζ=0.65 (approximately) results in a nonlinear
shift of phase with frequency and a consequent distortion of the waveform.
ENVIRONMENTAL EFFECTS
Temperature. The sensitivity, natural frequency, and damping of a transducer
may be affected by temperature.The specific effects produced depend on the type of
transducer and the details of its design.The sensitivity may increase or decrease with
temperature, or remain relatively constant. Figure 12.16 shows the variation of
damping with temperature for several different damping media. Either of two
methods may be employed to compensate for temperature effects.
1. The temperature of the pickup may be held constant by local heating or cooling.
2. The pickup characteristics may be measured as a function of temperature; if nec-
essary, the appropriate corrections can then be applied to the measured data.
Humidity. Humidity may affect the characteristics of certain types of vibration
instruments. In general, a transducer which operates at a high electrical impedance
is affected by humidity more than a transducer which operates at a low electrical
impedance. It usually is impractical to correct the measured data for humidity
effects. However, instruments that might otherwise be adversely affected by humid-
ity often are sealed hermetically to protect them from the effects of moisture.
Acoustic Noise. High-intensity sound waves often accompany high-amplitude
vibration. If the case of an accelerometer can be set into vibration by acoustic exci-
tation, error signals may result. In general, a well-designed accelerometer will not
produce a significant electrical response except at extremely high sound pressure
levels. Under such circumstances, it is likely that vibration levels also will be very
high, so that the error produced by the accelerometer’s exposure to acoustic noise
usually is not important.
12.14 CHAPTER TWELVE
FIGURE 12.16 Variation of damping with temperature for different
damping means. The ordinate indicates the fraction of critical damping ζ at
various temperatures assuming ζ=1 at 70°F (21°C).
8434_Harris_12_b.qxd 09/20/2001 11:15 AM Page 12.14
Strain Sensitivity. An accelerometer may generate a spurious output when its case
is strained or distorted. Typically this occurs when the transducer mounting is not flat
against the surface to which it is attached, and so this effect is often called base-bend
sensitivity or strain sensitivity. It is usually reported in equivalent g per micro-
strain, where 1 microstrain is 1 × 10
−6
inch per inch. The Instrument Society of Amer-
ica recommends a test procedure that determines strain sensitivity at 250 microstrain.
4
An accelerometer with a sensing element which is tightly coupled to its base
tends to exhibit large strain sensitivity. An error due to strain sensitivity is most
likely to occur when the accelerometer is attached to a structure which is subject to
large amounts of flexure. In such cases, it is advisable to select an accelerometer with
low strain sensitivity.
PHYSICAL PROPERTIES
Size and weight of the transducer are very important considerations in many vibra-
tion and shock measurements.A large instrument may require a mounting structure
that will change the local vibration characteristics of the structure whose vibration is
being measured. Similarly, the added mass of the transducer may also produce sub-
stantial changes in the vibratory response of such a structure. Generally, the natural
frequency of a structure is lowered by the addition of mass; specifically, for a simple
spring-mass structure:
=
Ί
(12.13)
where f
n
= natural frequency of structure
∆f
n
= change in natural frequency
m = mass of structure
∆m = increase in mass resulting from addition of transducer
In general, for a given type of transducing element, the sensitivity increases
approximately in proportion to the mass of the transducer. In most applications, it is
more important that the transducer be small in size than that it have high sensitivity
because amplification of the signal increases the output to a usable level.
Mass-spring-type transducers for the measurement of displacement usually are
larger and heavier than similar transducers for the measurement of acceleration. In
the former, the mass must remain substantially stationary in space while the instru-
ment case moves about it; this requirement does not exist with the latter.
For the measurement of shock and vibration in aircraft or missiles, the size and
weight of not only the transducer but also the auxiliary equipment are important. In
these applications, self-generating instruments that require no external power may
have a significant advantage.
PIEZOELECTRIC ACCELEROMETERS
5
PRINCIPLE OF OPERATION
An accelerometer of the type shown in Fig. 12.17A is a linear seismic transducer uti-
lizing a piezoelectric element in such a way that an electric charge is produced which
is proportional to the applied acceleration. This “ideal” seismic piezoelectric trans-
ducer can be represented (over most of its frequency range) by the elements shown
m
ᎏ
m +∆m
f
n
−∆f
n
ᎏ
f
n
VIBRATION TRANSDUCERS 12.15
8434_Harris_12_b.qxd 09/20/2001 11:15 AM Page 12.15
in Fig. 12.17B. A mass is supported on a linear spring which is fastened to the frame
of the instrument. The piezoelectric crystal which produces the charge acts as the
spring.Viscous damping between the mass and the frame is represented by the dash-
pot c. In Fig. 12.17C the frame is given an acceleration upward to a displacement of
u, thereby producing a compression in the spring equal to δ. The displacement of the
mass relative to the frame is dependent upon the applied acceleration of the frame,
the spring stiffness, the mass, and the viscous damping between the mass and the
frame, as indicated in Eq. (12.10) and illustrated in Fig. 12.3.
For frequencies far below the resonance frequency of the mass and spring, this
displacement is directly proportional to the acceleration of the frame and is inde-
pendent of frequency. At low frequencies, the phase angle of the relative displace-
ment δ, with respect to the applied acceleration, is proportional to frequency. As
indicated in Fig. 12.4, for low fractions of critical damping which are characteristic of
many piezoelectric accelerometers, the phase angle is proportional to frequency at
frequencies below 30 percent of the resonance frequency.
In Fig. 12.17, inertial force of the mass causes a mechanical strain in the piezo-
electric element, which produces an electric charge proportional to the stress and,
hence, proportional to the strain and acceleration. If the dielectric constant of the
piezoelectric material does not change with electric charge, the voltage generated is
also proportional to acceleration. Metallic electrodes are applied to the piezoelectric
element, and electrical leads are connected to the electrodes for measurement of the
electrical output of the piezoelectric element.
In the ideal seismic system shown in Fig. 12.17, the mass and the frame have infi-
nite stiffness, the spring has zero mass, and viscous damping exists only between the
12.16 CHAPTER TWELVE
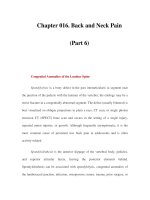
FIGURE 12.17 (A) Schematic diagram of a linear seismic piezoelectric
accelerometer. (B) A simplified representation of the accelerometer shown in
(A) which applies over most of the useful frequency range.A mass m rests on the
piezoelectric element, which acts as a spring having a spring constant k. The
damping in the system, represented by the dashpot, has a damping coefficient c.
(C) The frame is accelerated upward, producing a displacement u of the frame,
moving the mass from its initial position by an amount x, and compressing the
spring by an amount δ.
(B)
(A)
(C)
8434_Harris_12_b.qxd 09/20/2001 11:15 AM Page 12.16
mass and the frame. In practical piezoelectric accelerometers, these assumptions
cannot be fulfilled. For example, the mass may have as much compliance as the
piezoelectric element. In some seismic elements, the mass and spring are inherently
a single structure. Furthermore, in many practical designs where the frame is used to
hold the mass and piezoelectric element, distortion of the frame may produce
mechanical forces upon the seismic element. All these factors may change the per-
formance of the seismic system from those calculated using equations based on an
ideal system. In particular, the resonance frequency of the piezoelectric combination
may be substantially lower than that indicated by theory. Nevertheless,the equations
for an ideal system are useful both in design and application of piezoelectric
accelerometers.
Figure 12.18 shows a typical frequency response curve for a piezoelectric
accelerometer. In this illustration, the electrical output in millivolts per g accelera-
tion is plotted as a function of frequency. The resonance frequency is denoted by f
n
.
If the accelerometer is properly mounted on the device being tested, then the upper
frequency limit of the useful frequency range usually is taken to be f
n
/3 for a devia-
tion of 12 percent (1 dB) from the mean value of the response. For a deviation of 6
percent (0.5 dB) from the mean value, the upper frequency limit usually is taken to
be f
n
/5.As indicated in Fig. 12.1, the type of mounting can have a significant effect on
the value of f
n
.
The decrease in response at low frequencies (i.e., the “rolloff”) depends primarily
on the characteristics of the preamplifier that follows the accelerometer. The low-
frequency limit also is usually expressed in terms of the deviation from the mean
value of the response over the flat portion of the response curve, being the frequency
at which the response is either 12 percent (1 dB) or 6 percent (0.5 dB) below the
mean value.
VIBRATION TRANSDUCERS 12.17
FIGURE 12.18 Typical response curve for a piezoelectric accelerometer. The reso-
nance frequency is denoted by f
n
. The useful range depends on the acceptable devia-
tion from the mean value of the response over the “flat” portion of the response curve.
8434_Harris_12_b.qxd 09/20/2001 11:15 AM Page 12.17
PIEZOELECTRIC MATERIALS
A polarized ceramic called lead zirconate titanate (PZT) is most commonly used in
piezoelectric accelerometers. It is low in cost, high in sensitivity, and useful in the tem-
perature range from −180° to +550°F (−100° to +288°C). Polarized ceramics in the bis-
muth titanate family have substantially lower sensitivities than PZT, but they also have
more stable characteristics and are useful at temperatures as high as 1000°F (538°C).
Quartz, the single-crystal material most widely used in accelerometers, has a sub-
stantially lower sensitivity than polarized ceramics, but its characteristics are very
stable with time and temperature; it has high resistivity. Lithium niobate and tour-
maline are single-crystal materials that can be used in accelerometers at high tem-
peratures: lithium niobate up to at least 1200°F (649°C), and tourmaline up to at
least 1400°F (760°C). The upper limit of the useful range is usually set by the ther-
mal characteristics of the structural materials rather than by the characteristics of
these two crystalline materials.
Polarized polyvinylidene fluoride (PVDF), an engineering plastic similar to
Teflon, is used as the sensing element in some accelerometers. It is inexpensive, but
it is generally less stable with time and with temperature changes than ceramics or
single-crystal materials. In fact, because PVDF materials are highly pyroelectric,
they are used as thermal sensing devices.
TYPICAL PIEZOELECTRIC ACCELEROMETER CONSTRUCTIONS
Piezoelectric accelerometers utilize a variety of seismic element configurations.
Their methods of mounting are described in Chap. 15. See also Ref. 6. Most are con-
structed of polycrystalline ceramic piezoelectric materials because of their ease
of manufacture, high piezoelectric sensitivity, and excellent time and temperature
stability. These seismic devices may be classified in two modes of operation:
compression- or shear-type accelerometers.
Compression-type Accelerometer. The compression-type seismic accelerome-
ter, in its simplest form, consists of a piezoelectric disc and a mass placed on a frame
as shown in Fig. 12.17. Motion in the direction indicated causes compressive (or ten-
sile) forces to act on the piezoelectric element, producing an electrical output pro-
portional to acceleration. In this example, the mass is cemented with a conductive
material to the piezoelectric element which, in turn, is cemented to the frame. The
components must be cemented firmly so as to avoid being separated from each
other by the applied acceleration.
In the typical commercial accelerom-
eter shown in Fig. 12.19, the mass is held
in place by means of a stud extending
from the frame through the ceramic.
Accelerometers of this design often use
quartz, tourmaline, or ferroelectric ce-
ramics as the sensing material.
This type of accelerometer must be
attached to the structure with care in
order to minimize distortion of the hous-
ing and base which can cause an electri-
cal output. See the section on Strain
Sensitivity.
12.18 CHAPTER TWELVE
FIGURE 12.19 A typical compression-type
piezoelectric accelerometer.The piezoelectric ele-
ment(s) must be preloaded (biased) to produce
an electrical output under both tension forces and
compression forces. (Courtesy of Endevco Corp.)
8434_Harris_12_b.qxd 09/20/2001 11:15 AM Page 12.18
The temperature characteristics of compression-type accelerometers have been
improved greatly in recent years; it is now possible to measure acceleration over a
temperature range of −425 to +1400°F (−254 to +760°C). This wider range has been
primarily a result of the use of two piezoelectric materials: tourmaline and lithium
niobate.
Shear-type Accelerometers. One shear-type accelerometer utilizes flat-plate
shear-sensing elements. Manufacturers preload these against a flattened post ele-
ment in several ways. Two methods are shown in Fig. 12.20. Accelerometers of this
style have low cross-axis response, excellent temperature characteristics, and negli-
gible output from strain sensitivity or base bending. The temperature range of the
bolted shear design can be from −425 to +1400°F (−254 to +760°C). The following
are typical specifications: sensitivity, 10 to 500 picocoulombs/g; acceleration range, 1
to 500g; resonance frequency, 25,000 Hz; useful frequency range, 3 to 5000 Hz; tem-
perature range, −425 to +1400°F (−254 to 760°C); transverse response, 3 percent.
Another shear-type accelerometer,
illustrated in Fig. 12.21, employs a cylin-
drically shaped piezoelectric element fit-
ted around a middle mounting post; a
loading ring (or mass) is cemented to the
outer diameter of the piezoelectric ele-
ment.The cylinder is made of ceramic and
is polarized along its length; the output
voltage of the accelerometer is taken
from its inner and outer walls. This type of
design can be made extremely small and
is generally known as an axially poled
shear-mode annular accelerometer.
Beam-type Accelerometers. The
beam-type accelerometer is a variation
of the compression-type accelerometer.
VIBRATION TRANSDUCERS 12.19
FIGURE 12.20 Piezoelectric accelerometers: (A) Delta-shear type. (Courtesy of Bruel & Kjaer.)
(B) Isoshear type. (Courtesy of Endevco Corp.)
(A)
(B)
FIGURE 12.21 An annular shear accelerome-
ter.The piezoelectric element is cemented to the
post and mass. Electrical connections (not
shown) are made to the inner and outer diame-
ters of the piezoelectric element. (Courtesy of
Endevco Corp.)
8434_Harris_12_b.qxd 09/20/2001 11:15 AM Page 12.19
It is usually made from two piezoelectric plates which are rigidly bonded together to
form a beam supported at one end, as illustrated in Fig. 12.22.As the beam flexes, the
bottom element compresses, so that it increases in thickness. In contrast, the upper
element expands, so that it decreases in thickness. Accelerometers of this type gen-
erate high electrical output for their size, but are more fragile and have a lower res-
onance frequency than most other designs.
PHYSICAL CHARACTERISTICS OF PIEZOELECTRIC
ACCELEROMETERS
Shape, Size, and Weight. Commercially available piezoelectric accelerometers
usually are cylindrical in shape. They are available with both attached and detach-
able mounting studs at the bottom of the cylinder. A coaxial cable connector is pro-
vided at either the top or side of the housing.
Most commercially available piezoelectric accelerometers are relatively light in
weight, ranging from approximately 0.005 to 4.2 oz (0.14 to 120 grams). Usually, the
larger the accelerometer, the higher its sensitivity and the lower its resonance fre-
quency. The smallest units have a diameter of less than about 0.2 in. (5 mm); the
larger units have a diameter of about 1 in. (25.4 mm) and a height of about 1 in.
(25.4 mm).
12.20 CHAPTER TWELVE
FIGURE 12.22 Configurations of piezoelectric elements in a beam-type
accelerometer. (A) A series arrangement, in which the two elements have
opposing directions of polarization. (B) A parallel arrangement, in which
the two elements have the same direction of polarization.
(B)
(A)
8434_Harris_12_b.qxd 09/20/2001 11:15 AM Page 12.20
Resonance Frequency. The highest fundamental resonance frequency of an
accelerometer may be above 100,000 Hz. The higher the resonance frequency, the
lower will be the sensitivity and the more difficult it will be to provide mechanical
damping.
Damping. The amplification ratio of an accelerometer is defined as the ratio of
the sensitivity at its resonance frequency to the sensitivity in the frequency band in
which sensitivity is independent of frequency. This ratio depends on the amount of
damping in the seismic system; it decreases with increasing damping. Most piezo-
electric accelerometers are essentially undamped, having amplification ratios
between 20 and 100, or a fraction of critical damping less than 0.1.
ELECTRICAL CHARACTERISTICS OF PIEZOELECTRIC
ACCELEROMETERS
Dependence of Voltage Sensitivity on Shunt Capacitance. The sensitivity of an
accelerometer is defined as the electrical output per unit of applied acceleration. The
sensitivity of a piezoelectric accelerometer can be expressed as either a charge sensitiv-
ity q/¨x or voltage sensitivity e/¨x. Charge sensitivity usually is expressed in units of
coulombs generated per g of applied acceleration; voltage sensitivity usually is
expressed in volts per g (where g is the acceleration of gravity). Voltage sensitivity
often is expressed as open-circuit voltage
sensitivity, i.e., in terms of the voltage pro-
duced across the electrical terminals per
unit acceleration when the electrical load
impedance is infinitely high. Open-circuit
voltage sensitivity may be given either
with or without the connecting cable.
An electrical capacitance often is
placed across the output terminals of a
piezoelectric transducer. This added
capacitance (called shunt capacitance)
may result from the connection of an
electrical cable between the pickup and
other electrical equipment (all electrical
cables exhibit interlead capacitance).
The effect of shunt capacitance in reduc-
ing the sensitivity of a pickup is shown in
Fig. 12.23.
The charge equivalent circuits, with shunt capacitance C
S
, are shown in Fig.
12.23A. The charge sensitivity is not changed by addition of shunt capacitance. The
total capacitance C
T
of the pickup including shunt is given by
C
T
= C
E
+ C
S
(12.14)
where C
E
is the capacitance of the transducer without shunt capacitance.
The voltage equivalent circuits are shown in Fig. 12.23B. With the shunt capaci-
tance C
S
, the total capacitance is given by Eq. (12.14) and the open-circuit voltage
sensitivity is given by
= (12.15)
1
ᎏ
C
E
+ C
S
q
s
ᎏ
¨x
e
s
ᎏ
¨x
VIBRATION TRANSDUCERS 12.21
FIGURE 12.23 Equivalent circuits which in-
clude shunt capacitance across a piezoelectric
pickup. (A) Charge equivalent circuit. (B) Volt-
age equivalent circuit.
(A) (B)
8434_Harris_12_b.qxd 09/20/2001 11:15 AM Page 12.21
where q
s
/¨x is the charge sensitivity.The voltage sensitivity without shunt capacitance
is given by
= (12.16)
Therefore, the effect of the shunt capacitance is to reduce the voltage sensitivity by
a factor
= (12.17)
Piezoelectric accelerometers are used with both voltage-sensing and charge-sensing
signal conditioners, although charge sensing is by far the most common because the
sensitivity does not change with external capacitance (up to a limit). These factors
are discussed in Chap. 13. In addition, electronic circuitry can be placed within the
case of the accelerometer, as discussed below.
LOW-IMPEDANCE PIEZOELECTRIC ACCELEROMETERS
CONTAINING INTERNAL ELECTRONICS
Piezoelectric accelerometers are available with simple electronic circuits internal to
their cases to provide signal amplification and low-impedance output. For example,
see the charge preamplifier circuit shown in Fig. 13.2. Some designs operate from
low-current dc voltage supplies and are designed to be intrinsically safe when cou-
pled by appropriate barrier circuits. Other designs have common power and signal
lines and use coaxial cables.
The principal advantages of piezoelectric accelerometers with integral electron-
ics are that they are relatively immune to cable-induced noise and spurious
response, they can be used with lower-cost cable, and they have a lower signal con-
ditioning cost. In the simplest case the power supply might consist of a battery, a
resistor, and a capacitor. Some such accelerometers provide a velocity or displace-
ment output. These advantages do not come without compromise.
7
Because the
impedance-matching circuitry is built into the transducer, gain cannot be adjusted to
utilize the wide dynamic range of the basic transducer.Ambient temperature is lim-
ited to that which the circuit will withstand, and this is considerably lower than that
of the piezoelectric sensor itself. In order to retain the advantages of small size, the
integral electronics must be kept relatively simple.This precludes the use of multiple
filtering and dynamic overload protection and thus limits their application.
All other things being equal, the reliability factor (i.e., the mean time between
failures) of any accelerometer with internal electronics is lower than that of an
accelerometer with remote electronics, especially if the accelerometer is subject to
abnormal environmental conditions. However, if the environmental conditions are
fairly normal, accelerometers with internal electronics can provide excellent signal
fidelity and immunity from noise. Internal electronics provides a reduction in over-
all system noise level because it minimizes the cable capacitance between the sensor
and the signal conditioning electronics.
An accelerometer containing internal electronics that includes such additional
features as self-testing, self-identification, and calibration data storage is sometimes
referred to as a “smart accelerometer.” During normal operation of the smart sen-
sor, its output is an analog electrical signal. If such a transducer contains a built-in
digital identification chip, it can be designed to send out a digitized signal providing
such useful information as the calibration of the device and compensation coeffi-
C
E
ᎏ
C
E
+ C
S
e
s
/¨x
ᎏ
e/¨x
1
ᎏ
C
E
q
s
ᎏ
¨x
e
ᎏ
¨x
12.22 CHAPTER TWELVE
8434_Harris_12_b.qxd 09/20/2001 11:15 AM Page 12.22
cients.
8
Such a device is often called a mixed-mode smart sensor or a mixed-mode
analog smart transducer.
Velocity-Output Piezoelectric Devices. Piezoelectric accelerometers are avail-
able with internal electronic circuitry which integrates the output signal provided by
the accelerometer, thereby yielding a velocity or displacement output. These trans-
ducers have several advantages not possessed by ordinary velocity pickups. They are
smaller, have a wider frequency response, have no moving parts, and are relatively
unaffected by magnetic fields where measurements are made.
ACCELERATION-AMPLITUDE CHARACTERISTICS
Amplitude Range. Piezoelectric accelerometers are generally useful for the meas-
urement of acceleration of magnitudes of from 10
−6
g to more than 10
5
g. The lowest
value of acceleration which can be measured is approximately that which will produce
an output voltage equivalent to the electrical input noise of the coupling amplifier con-
nected to the accelerometer when the pickup is at rest. Over its useful operating range,
the output of a piezoelectric accelerometer is directly and continuously proportional
to the input acceleration. A single accelerometer often can be used to provide meas-
urements over a dynamic amplitude range of 90 dB or more, which is substantially
greater than the dynamic range of some of the associated transmission, recording, and
analysis equipment. Commercial accelerometers generally exhibit excellent linearity
of electrical output vs. input acceleration under normal usage.
At very high values of acceleration (depending upon the design characteristics of
the particular transducer), nonlinearity or damage may occur. For example, if the
dynamic forces exceed the biasing or clamping forces, the seismic element may
“chatter” or fracture, although such a fracture might not be observed in subsequent
low-level acceleration calibrations. High dynamic accelerations also may cause a
slight physical shift in position of the piezoelectric element in the accelerometer—
sometimes sufficient to cause a zero shift or change in sensitivity. The upper limit of
acceleration measurements depends upon the specific design and construction
details of the pickup and may vary considerably from one accelerometer to another,
even though the design is the same. It is not always possible to calculate the upper
acceleration limit of a pickup. Therefore one cannot assume linearity of acceleration
levels for which calibration data cannot be obtained.
EFFECTS OF TEMPERATURE
Temperature Range. Piezoelectric accelerometers are available which may be
used in the temperature range from −425°F (−254°C) to above +1400°F (+760°C)
without the aid of external cooling. The voltage sensitivity, charge sensitivity, capac-
itance, and frequency response depend upon the ambient temperature of the trans-
ducer. This temperature dependence is due primarily to variations in the
characteristics of the piezoelectric material, but it also may be due to variations in
the insulation resistance of cables and connectors—especially at high temperatures.
Effects of Temperature on Charge Sensitivity. The charge sensitivity of a
piezoelectric accelerometer is directly proportional to the d piezoelectric constant of
the material used in the piezoelectric element. The d constants of most piezoelectric
materials vary with temperature.
VIBRATION TRANSDUCERS 12.23
8434_Harris_12_b.qxd 09/20/2001 11:15 AM Page 12.23
Effects of Temperature on Voltage Sensitivity. The open-circuit voltage sensi-
tivity of an accelerometer is the ratio of its charge sensitivity to its total capacitance
(C
s
+ C
E
). Hence, the temperature variation in voltage sensitivity depends on the
temperature dependence of both charge sensitivity and capacitance. The voltage
sensitivity of most piezoelectric accelerometers decreases with temperature.
Effects of Transient Temperature Changes. A piezoelectric accelerometer that
is exposed to transient temperature changes may produce outputs as large as several
volts, even if the sensitivity of the accelerometer remains constant. These spurious
output voltages arise from
1. Differential thermal expansion of the piezoelectric elements and the structural
parts of the accelerometer, which may produce varying mechanical forces on the
piezoelectric elements, thereby producing an electrical output.
2. Generation of a charge in response to a change in temperature because the
piezoelectric material is inherently pyroelectric. In general, the charge generated
is proportional to the temperature change.
Such thermally generated transients tend to generate signals at low frequencies
because the accelerometer case acts as a thermal low-pass filter.Therefore, such spu-
rious signals often may be reduced significantly by adding thermal insulation around
the accelerometer to minimize the thermal changes and by electrical filtering of low-
frequency output signals from the accelerometer.
PIEZORESISTIVE ACCELEROMETERS
PRINCIPLE OF OPERATION
A piezoresistive accelerometer differs from the piezoelectric type in that it is not self-
generating. In this type of transducer a semiconductor material, usually silicon, is used
as the strain-sensing element. Such a material changes its resistivity in proportion to an
applied stress or strain. The equivalent electric circuit of a piezoresistive transducing
element is a variable resistor. Piezoresistive elements are almost always arranged in
pairs; a given acceleration places one element in tension and the other in compression.
This causes the resistance of one element to increase while the resistance of the other
decreases. Often two pairs are used and the four elements are connected electrically in
a Wheatstone-bridge circuit, as shown in Fig. 12.24B. When only one pair is used, it
forms half of a Wheatstone bridge, the other half being made up of fixed-value resis-
tors, either in the transducer or in the signal conditioning equipment.The use of trans-
ducing elements by pairs not only increases the sensitivity, but also cancels zero-output
errors due to temperature changes, which occur in each resistive element.
At one time, wire or foil strain gages were used exclusively as the transducing ele-
ments in resistive accelerometers. Now silicon elements are often used because of
their higher sensitivity. (Metallic gages made of foil or wire change their resistance
with strain because the dimensions change.The resistance of a piezoresistive material
changes because the material’s electrical nature changes.) Sensitivity is a function of
the gage factor; the gage factor is the ratio of the fractional change in resistance to the
fractional change in length that produced it. The gage factor of a typical wire or foil
strain gage is approximately 2.5; the gage factor of silicon is approximately 100.
A major advantage of piezoresistive accelerometers is that they have good fre-
quency response down to dc (0 Hz) along with a relatively good high-frequency
response.
12.24 CHAPTER TWELVE
8434_Harris_12_b.qxd 09/20/2001 11:15 AM Page 12.24
DESIGN PARAMETERS
Many different configurations are possible for an accelerometer of this type. For
purposes of illustration, the design parameters are considered for a piezoresistive
accelerometer which has a cantilever arrangement as shown in Fig. 12.24A. This uni-
formly stressed cantilever beam is loaded at its end with mass m. In this arrange-
ment, four identical piezoresistive elements are used—two on each side of the beam,
whose length is L in. These elements, whose resistance is R, form the active arms of
the balanced bridge shown in Fig. 12.24B. A change of length L of the beam pro-
duces a change in resistance R in each element.The gage factor K for each of the ele-
ments [defined by Eq. (17.1)] is
K == (12.18)
where ε is the strain induced in the beam, expressed in inches/inch, at the surface
where the elements are cemented. If the resistances in the four arms of the bridge
are equal, then the ratio of the output voltage E
o
of the bridge circuit to the input
voltage E
i
is
==⑀K (12.19)
TYPICAL PIEZORESISTIVE ACCELEROMETER CONSTRUCTIONS
Figure 12.25 shows three basic piezoresistive accelerometer designs which illustrate
several of the many types available for various applications.
Bending-Beam Type. This design approach is described by Fig. 12.25A. The
advantages of this type are simplicity and ruggedness. The disadvantage is relatively
low sensitivity for a given resonance frequency. The relatively lower sensitivity
results from the fact that much of the strain energy goes into the beam rather than
the strain gages attached to it.
∆R
ᎏ
R
E
o
ᎏ
E
i
∆R/R
ᎏ
⑀
∆R/R
ᎏ
∆L/L
VIBRATION TRANSDUCERS 12.25
FIGURE 12.24 (A) Schematic drawing of a piezoresistive accelerometer of the cantilever-
beam type. Four piezoresistive elements are used—two are either cemented to each side of the
stressed beam or are diffused or ion implanted into a silicon beam. (B) The four piezoresistive
elements are connected in a bridge circuit as illustrated.
(A) (B)
8434_Harris_12_b.qxd 09/20/2001 11:15 AM Page 12.25
12.26 CHAPTER TWELVE
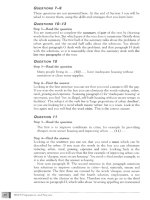
FIGURE 12.25 Three basic types of piezoresistive accelerometers. (A) Bending-beam type; the
strain elements are usually bonded to the beam. Such an arrangement has been implemented in a
micromachined accelerometer either by high-temperature diffusion of tension gages into the beam
or by ion implantation. (B) Stress-concentrated type; the thin section on the neutral axis acts as a
hinge of the seismic mass. Under dynamic conditions, the strain energy is concentrated in the piezore-
sistive gages. (C) Stress-concentrated micromachined type; the entire mechanism is etched from a
single crystal of silicon. The thin section on the neutral axis acts as a hinge; the pedestal serves as
a mounting base. (D) An enlarged view of one corner of the accelerometer shown in (C), which has a
total thickness of 200 micrometers.
(D)
(C)
(A)
(B)
8434_Harris_12_b.qxd 09/20/2001 11:15 AM Page 12.26
Stress-Concentrated Stopped and Damped Type. To provide higher sensitiv-
ities and resonance frequencies than are possible with the bending-beam type,
designs are provided which place most of the strain energy in the piezoresistive ele-
ments.This is described by Fig. 12.25B. This approach is used to provide sensitivities
more suitable for the measurement of acceleration below 100g.To provide environ-
mental shock resistance, overload stops are added. To provide wide frequency
response, damping is added by surrounding the mechanism with silicone oil. The
advantages of these designs are high sensitivity, broad frequency response for the
sensitivity, and over-range protection.The disadvantages are complexity and limited
temperature range. The high sensitivity results from the relatively large mass with
the strain energy mostly coupled into the strain gages. (The thin section on the neu-
tral axis acts as a hinge; it contributes very little stiffness.) The broad frequency
response results from the relatively high damping (0.7 times critical damping),
which allows the accelerometer to be used to frequencies nearer the resonance fre-
quency without excessive increase in sensitivity. The over-range protection is pro-
vided by stops which are designed to stop the motion of the mass before it
overstresses the gages. (Stops are omitted from Fig. 12.25B in the interest of clarity.)
Over-range protection is almost mandatory in sensitive piezoresistive accelerome-
ters; without it they would not survive ordinary shipping and handling. The viscosity
of the damping fluid does change with temperature; as a result, the damping coeffi-
cient changes significantly with temperature. The damping is at 0.7 times critical
only near room temperature.
Micromachined Type. The entire working mechanism (mass, spring, and sup-
port) of a micromachined-type accelerometer is etched from a single crystal of sili-
con, a process known as micromachining. This produces a very tiny and rugged
device, shown in Fig. 12.25C. The advantages of the micromachined type are very
small size, very high resonance frequency, ruggedness, and high range. Accelerome-
ters of such design are used to measure a wide range of accelerations, from below
10g to over 200,000g. No adhesive is required to bond a strain gage of this type to
the structure, which helps to make it a very stable device. For shock applications, see
the section on Survivability.
ELECTRICAL CHARACTERISTICS OF PIEZORESISTIVE
ACCELEROMETERS
Excitation. Piezoresistive transducers require an external power supply to provide
the necessary current or voltage excitation in order to operate. These energy sources
must be well regulated and stable since they may introduce sensitivity errors and sec-
ondary effects at the transducer which will result in error signals at the output.
Traditionally, the excitation has been provided by a battery or a constant voltage
supply. Other sources of excitation, such as constant current supplies or ac excitation
generators, may be used. The sensitivity and temperature response of a piezoresis-
tive transducer may depend on the kind of excitation applied.Therefore, it should be
operated in a system which provides the same source of excitation as used during
temperature compensation and calibration of the transducer. The most common
excitation source is 10 volts dc.
Sensitivity. The sensitivity of an accelerometer is defined as the ratio of its elec-
trical output to its mechanical input. Specifically, in the case of piezoresistive
VIBRATION TRANSDUCERS 12.27
8434_Harris_12_b.qxd 09/20/2001 11:15 AM Page 12.27
accelerometers, it is expressed as voltage
per unit of acceleration at the rated exci-
tation (i.e., mV/g or peak mV/peak g at
10 volts dc excitation).
Loading Effects. An equivalent cir-
cuit of a piezoresistive accelerometer,
for use when considering loading effects,
is shown in Fig. 12.26. Using the equivalent circuit and the measured output resist-
ance of the transducer, the effect of loading may be directly calculated:
E
oL
= E
o
(12.20)
where R
o
= output resistance of accelerometer, including cable resistance
E
o
= sensitivity into an infinite load
E
oL
= loaded output sensitivity
R
L
= load resistance
Because the resistance of the strain-gage elements varies with temperature, output
resistance should be measured at the operating temperature.
Effect of Cable on Sensitivity. Long cables may result in the following effects:
1. A reduction in sensitivity because of resistance in the input wires. The fractional
reduction in sensitivity is equal to
(12.21)
where R
i
is the input resistance of the transducer and R
ci
is the resistance of one
input (excitation) wire.This effect may be overcome by using remote sensing leads.
2. Signal attenuation resulting from resistance in the output wires. This fractional
reduction in signal is given by
(12.22)
where R
co
is the resistance of one output wire between transducer and load.
3. Attenuation of the high-frequency components in the data signal as a result of
R-C filtering in the shielded instrument leads. The stray and distributed capaci-
tance present in the transducer and a short cable are such that any filtering
effect is negligible to frequencies well beyond the usable range of the
accelerometer. However, when long leads are connected between transducer
and readout equipment, the frequency response at higher frequencies may be
affected significantly.
Warmup Time. The excitation voltage across the piezoresistive elements causes
a current to flow through each element. The I
2
R heating results in an increase in
temperature of the elements above ambient which slightly increases the resistance
of the elements. Differentials in this effect may cause the output voltage to vary
slightly with time until the temperature is stabilized. Therefore, resistance meas-
urements and shock and vibration data should not be taken until stabilization is
reached.
R
L
ᎏᎏ
R
o
+ R
L
+ 2R
co
R
i
ᎏ
R
i
+ 2R
ci
R
L
ᎏ
R
o
+ R
L
12.28 CHAPTER TWELVE
FIGURE 12.26 Loading effects on piezoresis-
tive accelerometers.
8434_Harris_12_b.qxd 09/20/2001 11:15 AM Page 12.28
Input and Output Resistance. For an equal-arm Wheatstone bridge, the input
and output resistances are equal. However, temperature-compensating and zero-
balance resistors may be internally connected in series with the input leads or in
series with the sensing elements. These additional resistors will usually result in
unequal input and output resistance. The resistance of piezoresistive transducers
varies with temperature much more than the resistance of metallic strain gages, usu-
ally having resistivity temperature coefficients between about 0.17 and 0.95 percent
per degree Celsius.
Zero Balance. Although the resistance elements in the bridge of a piezoresistive
accelerometer may be closely matched during manufacture, slight differences in
resistance will exist. These differences result in a small offset or residual dc voltage
at the output of the bridge. Circuitry within associated signal conditioning instru-
ments may provide compensation or adjustment of the electrical zero.
Insulation. The case of the accelerometer acts as a mechanical and electrical
shield for the sensing elements. Sometimes it is electrically insulated from the ele-
ments but connected to the shield of the cable. If the case is grounded at the struc-
ture, the shield of the connecting cable may be left floating and should be connected
to ground at the end farthest from the accelerometer. When connecting the cable
shield at the end away from the accelerometer, care must be taken to prevent
ground loops.
Thermal Sensitivity Shift. The sensitivity of a piezoresistive accelerometer
varies as a function of temperature. This change in the sensitivity is caused by
changes in the gage factor and resistance and is determined by the temperature
characteristics of the modulus of elasticity and piezoresistive coefficient of the sens-
ing elements. The sensitivity deviations are minimized by installing compensating
resistors in the bridge circuit within the accelerometer.
Thermal Zero Shift. Because of small differences in resistance change of the
sensing elements as a function of temperature, the bridge may become slightly
unbalanced when subjected to temperature changes. This unbalance produces small
changes in the dc voltage output of the bridge. Transducers are usually compensated
during manufacture to minimize the change in dc voltage output (zero balance) of
the accelerometer with temperature. Adjustment of external balancing circuitry
should not be necessary in most applications.
Damping. The frequency response characteristics of piezoresistive accelerome-
ters having damping near zero are similar to those obtained with piezoelectric
accelerometers. Viscous damping is provided in accelerometers having relatively
low resonance frequencies to increase the useful high-frequency range of the
accelerometer and to reduce the output at resonance. At room temperature this
damping is usually 0.7 of critical damping or less.With damping, the sensitivity of the
accelerometer is “flat” to greater than one-fifth of its resonance frequency.
The piezoresistive accelerometer using viscous damping is intended for use in a
limited temperature range, usually +20 to +200°F (−7 to +94°C).At high temperatures
the viscosity of the oil decreases, resulting in low damping; and at low temperatures
the viscosity increases, which causes high damping. Accordingly, the frequency
response characteristics change as a function of temperature.
VIBRATION TRANSDUCERS 12.29
8434_Harris_12_b.qxd 09/20/2001 11:15 AM Page 12.29
FORCE GAGES AND IMPEDANCE HEADS
MECHANICAL IMPEDANCE MEASUREMENT
Mechanical impedance measurements are made to relate the force applied to a
structure to the motion of a point on the structure. If the motion and force are
measured at the same point, the relationship is called the driving-point impedance;
otherwise it is called the transfer impedance. Any given point on a structure has six
degrees-of-freedom: translations along three orthogonal axes and rotations around
the axes, as explained in Chap. 2. A complete impedance measurement requires
measurement of all six excitation forces and response motions. In practice, rota-
tional forces and motions are rarely measured, and translational forces and motions
are measured in a single direction, usually normal to the surface of the structure
under test.
Mechanical impedance is the ratio of input force to resulting output velocity.
Mobility is the ratio of output velocity to input force, the reciprocal of mechanical
impedance. Dynamic stiffness is the ratio of input force to output displacement.
Receptance, or admittance, is the ratio of output displacement to input force, the
reciprocal of dynamic stiffness. Dynamic mass, or apparent mass, is the ratio of input
force to output acceleration.All of these quantities are complex and functions of fre-
quency. All are often loosely referred to as impedance measurements. They all
require the measurement of input force obtained with a force gage (an instrument
which produces an output proportional to the force applied through it). They also
require the measurement of output motion. This is usually accomplished with an
accelerometer; if velocity or displacement is the desired measure of motion, either
can be determined from the acceleration.
Impedance measurements usually are made for one of these reasons:
1. To determine the natural frequencies and mode shapes of a structure (see Chap. 21)
2. To measure a specific property, such as stiffness or damping, of a material or
structure
3. To measure the dynamic properties of a structure in order to develop an analyti-
cal model of it
The input force (excitation) applied to a structure under test should be capable
of exciting the structure over the frequency range of interest.This excitation may be
either a vibratory force or a transient impulse force (shock). If vibration excitation
is used, the frequency is swept over the range of interest while the output motion
(response) is measured. If shock excitation is used, the transient input excitation and
resulting transient output response are measured.The frequency spectra of the input
and output are then calculated by Fourier analysis.
FORCE GAGES
A force gage measures the force which is being applied to a structural point. Force
gages used for impedance measurements invariably utilize piezoelectric transducing
elements. A piezoelectric force gage is, in principle, a very simple device. The trans-
ducing element generates an output charge or voltage proportional to the applied
force. Piezoelectric transducing elements are discussed in detail earlier in this chapter.
12.30 CHAPTER TWELVE
8434_Harris_12_b.qxd 09/20/2001 11:15 AM Page 12.30