Báo cáo khoa hoc:" Application of a biotin functionalized QD assay for determining available binding sites on electrospun nanofiber membrane" pdf
Bạn đang xem bản rút gọn của tài liệu. Xem và tải ngay bản đầy đủ của tài liệu tại đây (382.04 KB, 7 trang )
RESEARCH Open Access
Application of a biotin functionalized QD assay
for determining available binding sites on
electrospun nanofiber membrane
Patrick Marek
1*
, Kris Senecal
2
, Dawn Nida
1
, Joshua Magnone
1
and Andre Senecal
1
Abstract
Background: The quantification of surface groups attached to non-woven fibers is an important step in
developing nanofiber biosensing detection technologies. A method utilizing biotin functionalized quantum dots
(QDs) 655 for quantitative analysis of available biotin binding sites within avidin immobilized on electrospun
nanofiber membranes was developed.
Results: A method for quantifying nanofiber bound avidin using biotin functionalized QDs is presented. Avidin was
covalently bound to electrospun fibrous polyvinyl chloride (PVC 1.8% COOH w/w containing 10% w/w carbon
black) membranes using primary amine reactive EDC-Sulfo NHS linkage chemistry. After a 12 h exposure of the
avidin coated membranes to the biotin-QD complex, fluorescence intensity was measured and the total amount of
attached QDs was determined from a standard curve of QD in solution (total fluorescence vs. femtomole of QD
655). Additionally, fluorescence confocal microscopy verified the labeling of avidin coated nanofibers with QDs. The
developed method was tested against 2.4, 5.2, 7.3 and 13.7 mg spray weights of electrospun nanofiber mats. Of
the spray weight samples tested, max imum fluorescence was measured for a weight of 7.3 mg, not at the highest
weight of 13.7 mg. The data of total fluorescence from QDs bound to immobilized avidin on increasing weights of
nanofiber membrane was best fit with a second order polynomial equation (R
2
= .9973) while the standard curve
of total fluorescence vs. femtomole QDs in solution had a linear response (R
2
= .999).
Conclusion: A QD assay was developed in this study that provides a direct method for quantifying ligand
attachment sites of avidin covalently bound to surfaces. The strong fluorescence signal that is a fundamental
characteristic of QDs allows for the measurement of small changes in the amount of these particles in solution or
attached to surfaces.
Background
Non-woven fiber materials comprised of nano-scale elec-
trospun fibers have unique properties and are being
developed for use in filter media, scaffolds for tissue engi-
neering, protective clothing, reinforcement in composite
materials and sensors [1]. Nanofiber materials have a
large surface area per unit mass on the order of 10
3
m
2
/g
[2] and can easily be functionalized [1]. Nanofiber mate-
rials can be produced by an electrospinning process, dur-
ing which nanofibers are created from an electrically
charged jet of polymer solutions or polymer melts [1,3,4].
Nanofibers produced by electrospinning normally result
in a fiber laden, nonwoven mat o r membrane of rando-
mized fiber orientation, size and spatial separations
(pores). The origin of the randomness for which the el ec-
trospun nanofiber mat is known has been described as a
chaotic oscillation of the spinning jet [5] and as a jet
whippingandbendinginstabilityatthenozzletip[6].
Research has been conducted on using electrospun mem-
branes as sensors and as substrates for immunoassays
[7-12]. Recently, electrospun nanofiber membranes have
been demonstrated as a promising technology for biolo-
gical agent capture and detection [12]. In biosensor appli-
cations, it is important to functionalize the fibers with
ligands and chemistries in a consistent and repeatable
* Correspondence:
1
Food Safety and Defense Team, U. S. Army Natick Soldier Research,
Development and Engineering Center, 15 Kansas St. Natick M. A. 01760-5018,
USA
Full list of author information is available at the end of the article
Marek et al. Journal of Nanobiotechnology 2011, 9:48
/>© 2011 Marek et al; licensee BioMed Central Ltd. This is an Open Access article distributed under the terms of the Creative Commons
Attribution License ( which permits u nrestricted use, distribution, and reproduction in
any medium, provided the original work is properly cited.
manner so that detection and quantitation of analytes is
reproducible. The density of binding sites is an important
characteristic for sensor development [13]. Because of
the complexity of non-woven electrospun membranes it
would be of value to determine the optimum physical
characteristics (as determined by weight during produc-
tion) that provides the greates t number of available ant i-
body attachment sites for assay development. Increasing
the quantity of nanofibers per square cm will increase the
surface area of the mat and the potential number of bind-
ing sites for antibody attachment. However, additional
fibers are added only to the z-plane, increasing the thick-
ness of the membrane, and potentially subjecting the sig-
nal of fluorescence based assays to attenuation.
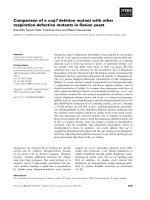
Previously it was demonstrated that PVC-COOH nano-
fiber material could be functionalized with antibodies
using a directional orientated two step: avidin protein -
biotinylated antibody linkage [12] (Figure 1). Methods
identified to determine the amount of avidin protein cova-
lently attached to the membrane for assay development
were found to be inadequate. Commonly used methods
such as Micro BCA and Modified Lowry (Thermo Fisher
Scientific, Rockford IL) are inefficient to quantify protei n
covalently attached to the nanofibrous membrane. These
assays are designed to verify protein concentrations in
solution and not proteins bound to a surface. Additionally,
they lack the desired sensitivi ty for samples with protein
concentrations in the nanogram range (2 - 40 ug/ml
Micro BCA and 10 - 1500 ug/ml Modified Lowry). Alter-
native methods to quantify proteins absorbed to a surface
via Nano Orange (Invitrogen), amido black staining and
quartz crystal microbalance (QCM) showed assay sensitiv-
ities into the nanogram per cm
2
[14]. The Nano Orange
fluorometric analysis is the only method to give absolut e
quantities of surface-bound proteins measure after the
adsorbed protein was liberated from the surface using
sequential rinse cycles of undiluted ethanol and distilled
deionized water, concentrated with solvent evaporated
[14].
The purpose of this study was to develop a new method
for determining the amount of avidin protein covalently
attached to complex nonwoven surfaces. Here we describe
a fluorescence based method using QDs, taking advantage
of their high quantum yield and excellent photostability,
to quantify avidin immobilized by covalent attachment on
nanofiber material with a direct measurement.
Results
Inhibition of membrane autofluorescence
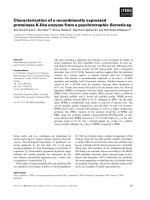
PVC-COOH membranes demonstrated a broad autofluor-
escence signature upon excitation with va rious wavelengths
from 280 nm to 400 nm. Figure 2 shows that when excited
at 400 nm the electrospun membrane revealed significant
autofluore scence emission between 455 nm and 705 nm.
Although the intensity decreased towards the red region,
the emission of a red emitting fluorescent reporter would
still be interfered with by the background signal. Adding a
10% w/w carbon black powder to the polymer prior to
solubilization in DMF and electrospinning significantly
reduced the fiber autofluorescence, especially in the red
region, Figure 2. The autofluorescence emission spectrum
of PVC-COOH containing 10% CB decreased steadily
(nearly linear) moving towards longer wavelength visible
light(450to700nm)whiletheuntreatedPVC-COOHhad
multiple emission peeks. Emission intensities of the CB
containing nanofibers in the 635 to 700 nm wavelength
range were nearly z ero making it an ideal w avelength range
for a direct measure assa y.
QD surface assay
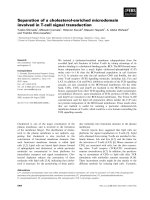
A standard curve for the concentration of QD 655 in solu-
tion versus fluorescent intensity produced a linear
response (R
2
= .999), Figure 3. The relationship between
fluorescence and QD concentration was used to calculate
the amount of avaliable biotin (ligand) binding sites of avi-
din bound to the nanofiber membrane by the QD 655
binding assay. The relationship of total fluorescence to
binding site numbers was hypothesized to have a linear
response, similar to what is seen in the standard curve.
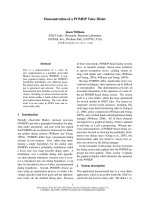
The QD binding assay was used to measure t he total
fluorescent response in relation to the covalent binding of
avidin to different weights of nanofiber mats (Figure 4).
Results showed a nonlinear response to increasing fiber
mat weights. The relationship of the total fluorescence to
membrane spra y weight appears to be represented accu-
rately with a second order polynomial equation (R
2
=
.9973) within the boundaries of the data set. The initial
increase in fluorescence from 2.4 to 7.3 does have linear
trend but as the weight of the nanofiber mat increases so
does the thickness and congestion of the fibers resulting in
a decrease in signal for the heaviest fiber mat tested. Fluor-
escence intensity reached a maximum for the 7.3 mg fiber
mat sample. Table 1 summarizes the data for the
EDC
crosslinker
Avidin
Biotinylated Antibod
y
F
u
n
c
t
i
o
n
a
liz
ed
fi
be
r
Figure 1 Functionalized nanofiber. Shows method used for
attaching antibodies to PVC-COOH nanofibers.
Marek et al. Journal of Nanobiotechnology 2011, 9:48
/>Page 2 of 7
femtomoles of QD bound to avidin on the surface for the
different weights of nanofiber mats as determined by the
equation (fluorescence intensity- 5.3062) ÷ 0.6907 = fem-
tomoles of QD 655). Using only the linear portion of the
fluorescence values from figure 4 it can be determined
that on average 65 femtomole of QD can bind to 1 mg of
nanofiber material. It can then be extrapolated that the
heaviest sample at 13.7 mg should theoretically bind 890.5
femtomoles QD, 2.5x the amount calculated using the
relative fluorescent values measured from the sample.
Discussion
Previously we were successful in developing an electro-
spun membrane sensor by covalently attaching avidin to
0
0.05
0.1
0.15
0.2
0.25
0
.
3
455 505 555 605 655 705
Fluorescence intensity (A.U.)
Emission wavelength (nm)
PVC-COOH 0%CB
PVC-COOH 10%CB
Black Paper
Figure 2 Emission spectra of PVC-COOH membrane. Fluorescence emission spectra of PVC-COOH electrospun nanofiber membrane with and
without 10% w/w carbon black at 400 nm excitation. Fluorescence was measured on an Aminco Bowman II front face spectrophotometer.
0
100
200
300
400
500
600
700
800
0 200 400 600 800 1000
Fluorescence intensity (A.U.)
Femtomole QD 655
Figure 3 Standard curve: femtom oles QD vs. fluoresc ence.The
fluorescence intensity was measured from QD 655 nm standard
solutions (1000, 500, 250, 125, 62.5, 31.5, 15.6 and 0 femtomole in
TBS) in a black 96 well plate (n = 3, 100 ul). Linear regression: y =
0.6907x + 5.3062 (R
2
= 0.999).
0
50
100
150
200
250
300
350
400
0 1 2 3 4 5 6 7 8 9 10 11 12 13 14 1
5
Fluorescence intensity (A.U.)
Milligram
Figure 4 Relationship of fluorescence and membrane weight.
Electrospun membrane material (PVC-COOH 10%w/w CB) of
differing weights functionalized with avidin was interrogated with
biotin-QD complexes. The fluorescence intensity (mean ± standard
error, n = 18) has a 2
nd
order polynomial relationship to the
membrane weight, y = -4.757x
2
+ 88.878x - 75.945 (R
2
= 0.9973).
Marek et al. Journal of Nanobiotechnology 2011, 9:48
/>Page 3 of 7
the surface of the nanofibers for functionalization with
biotinylated antibodies [12]. However, b ecause the pro-
teins are chemically attached to the surface and not in
solution,wehavebeenunabletoquantifytheantibody
receptor sites on the nanofiber membrane mats. We
attempted to use conventional protein assays (Modified
LowryandMicroBCA)toquantifytheamountofsur-
face bound avidin in order to determine the amount of
ligand binding sites. We were unable to measure the
amount of avidin protein a ttached to the nanofiber
material with these assays, either because the amount of
protein was below the assays sensitivity limits or because
these assays are designed to quantify proteins in solution
and not protein bound to a surface. We determined that
an assay needed to be developed that was sensitive in
the nanogram range to quantitate protein bound to a
surface. The avidin protei n can be attached to a surface
and still mai ntain the biotin binding functionality allow-
ing attachment of biotin labeled receptors. The strong
binding affinity of avidin for biotin (Ka = 10
15
M
-1
)has
made it useful for bioanalytical applications and immo-
bilization of proteins to surfac es [13,15]. Therefore, we
designed an assay that utilizes attachment other mole-
cules to biotin, while still maintaining the stro ng affinity
of biotin to avidin. We chose QDs attached to biotin as
our reporter molecules for the assay.
The inherent properties of QDs make them useful tools
for quantitation assays. They have been identified to have
optical advantages in fluorescence detection when com-
pared to conventional organic fluorophores [16]. QDs
advantages over traditional organic dyes include the
brightness originating from the high extinction coefficient,
large Stokes shift and photostability, while having a com-
parable quantum yield to traditional organic fluorescent
dyes [17]. It has been estimated that quantum dots are 20
times brighter and 100 times more stable than traditional
fluorescent reporters [18]. The photostability and bright-
ness of QDs make them ideal labels for developing an
assay to measure surface bound moetities since multiple
readings and long exposures to excitation light may be
necessary to achieve sensitivities in femtomole range
including sensitive photomultiplier tube (PMT) based sys-
tems. Materials such as PVC, used to produce electrospun
nanofiber membranes in this study, can have an autofluor-
escence signature. Depending on the spectral response of
the material at a specific excitation it may be difficult to
find a fluorophore that is not hindered by the material
autofluorescence intensity and profile. We found incorpor-
ating carbon black into the PVC-COOH spin dope almost
completely diminished nanofiber autofluorescence. Utiliz-
ing both carbon black and QDs we were able to achieve
sensitivity and very low sample noise.
In this study, non avidin functionalized PVC-COOH
membranes were exposed to high concentrations of the
biotin-QD 655 complex t o determine the extent of non-
specific binding to the nanofiber material. Previously we
had determined that protein like immunoglobulins will
nonspecifically absorb to the surface of nanofibers and are
not easily washed off (unpublished data). However in this
studyitwasfoundthatthebiotin-QDcomplexdidnot
readily stick to the fibers and only accounted for a fluores-
cence signal in tensity < 2.0 after washing. H ere we demon-
strated a QD 655 binding assay as a technique to measure
the overall fluorescence response for avidin c ovalently
attached onto nanofiber mats. Fluorescent confocal micro-
scopy verified the labeling of covalently attached avidin to
electrospun nanofibers with QDs, Figure 5. Two assump-
tions were made ; first only one biotin functionalized QD
wouldbeabletobindtoasinglebiotinbindingsite
located on avidin, and second the fluorescent intensity of
QDs in solution would be comparable to QDs attached to
a surface. The second assumption is based on the under-
standing that, QDs are not known to quench in close
proximity [19]. Consequently, by measuring the fluores-
cence intensity of bound biotin-QD complex, one should
be able to calculate the moles of available binding sites
from the covalent attached avidin protein located on the
surface of nanofibers. Once the method was developed, it
was utilized it to determine the relationship b etween avail-
able antibody binding sites to different weights of electro-
spun nanofiber mats. Incr easing fiber mat weight results
in fiber mats of similar diameter having a greater total
number of fibers thereby increasing the carboxylated func-
tional groups available for avidin attachment. The experi-
mental results (Figure 4) showed that the different
membrane weights did not have a linear response. Fluores-
cence intensity for the differ ent membrane weights
reached a maximum at 7.3 mg then fell sharply at 13.7
mg. It is hypothesized that increasing the fiber mass
beyond 7.3 mg causes the anterior fibers to attenuate both
excitation and emission of the QDs located on posterior
nanofibers. The polynomial relationship described here
may purely be an artifact generated from line of site when
using fluorescence labeled reporters combined with com-
plex nanofiber mats. It is anticipated that measurement of
binding sites on a planar system using this method would
maintain a linear response then plateau at a saturation
Table 1 Calculated femtomoles of QD 655 nm bound to
avidin on the surface of electrospun nanofibers
Membrane Average SEM n Femtomole
Weight Fluorescence Qdot 655 nm
2.4 111.93 10.86 18 154.38
5.2 251.48* 9.56 18 356.43
7.3 324.00 25.85 18 461.43
13.7 248.35* 21.33 18 351.89
*No significant difference (p-value > 0.05).
Marek et al. Journal of Nanobiotechnology 2011, 9:48
/>Page 4 of 7
point. However, in this study the added electrospun fibers
are done so in a vertical manner (in the z-plane), affecting
the linearity of the relationship for fiber weight vs. fluores-
cence intensity due to signal attenuation. The strong fluor-
escence signal that is a fundamental aspect of quantum
dots has the promise to allow for measurement of small
changes in the amount of these particles in solution or
attached to a planar surface. More investigation is still
needed to determine the limits for utilization of QDs for
quantitation on more complex structures like the nanofi-
ber mats investigated here.
Conclusions
A QD assay was developed that allowed for the determina-
tion of available ligand binding sites of avidin chemically
attached to surfaces . The assay lost its linearity when the
thickness of the electrospun nanofiber mat was increased
above a threshold. It is hypothesized t hat a shadowi ng
effect (line of site) maybe taking place where the anterior
fibers were blocking quantum dots located on posterior
nanofibers. The crowding of fibers has the potential to
block excitation and emission of bound QDs. It is antici-
pated that measurement of binding sites on a planar sys-
tem using this method woul d maintain a linear response
before a saturation point then plateau. The strong fluores-
cence signal that is a fundamental aspect of quantum dots
has the promise to allow for measurement of small
changes in the amount of these particles in solution or
attached to a surface. Data observed could help with opti-
mizing electrospun nanofiber membrane design for sensor
development. More investigation is still needed to deter-
mine the limits for utilization of QDs for quantitation on
more complex structur es li ke the nanofiber mats investi-
gated here.
Materials and Methods
Electrospinning device
The electrospinning apparatus used consisted of a DC
power source (Gamma High Voltage Research, Inc. Model
ES 30P-5W/DAM) where the charged positive electrode
wire was coupled to a blunt end 22 gauge syringe contain-
ing polymeric so lution. The polymer solution was drawn
into the disposable 5 ml syringe (polypropylene) and
mounted into KD scientific syringe pump model 780100
and flow rate set t o 0.02 ml/h. An 18 AWG ground wire
from the power source was attached to a conducting cop-
per plat e holding a 6.4 cm diameter screen, consisting of
100 mesh, woven 0.0045 inch T304 stainless steel wire. A
voltage of 14 Kv was applied to the syringe with a gap dis-
tance of 17.5 cm from the collector.
Polymer solutions for electrospinning
The polymer used to f abricate electrospun membranes
was polyvinyl chloride 1.8% carboxylated (PVC-COOH)
(Aldrich Chemical, St. Louis, MO). This polymer was
solublized at 10% by weight in 80% dimethyl formamide
Figure 5 Image of Qdot labeled nanofibers and binding reaction. The fluorescent CLSM image (left) taken shows the uniform attachment of
Qdot 655 nm to bound avidin on PVC-COOH nanofibers containing 10%w/w carbon black. The graphical representation (right) show the
binding scheme used in the quantification of available biotin binding sites: where avidin is covalently attached to PVC-COOH nanofiber via
carbodiimide chemistries (EDC and Sulfo-NHS) and biotin-Qdot complexes bind preferentially to avidin.
Marek et al. Journal of Nanobiotechnology 2011, 9:48
/>Page 5 of 7
(DMF) and 10% tetrahydrofuran (THF) w/w mixed with a
magnetic stirplate for 24 h at room temperature. PVC-
COOH nanofiber polymer material itself has a broad
autofluore scence signature and emission scans at various
wavelengths within the 450 nm to 800 nm range. Carbon
black (CB) was added to the spin dope (10% weight of
polymer), to lessen the autofluorescenc e of the polymer,
then sonicated over night and mixed constantly on a
magnetic stirrer until the polymer was electrospun.
Fiber weight of electrospun membranes
Different weights of fiber mats were produced for assay
development. Milligram quantities of fiber were electro-
spun on 6.4 cm diameter stainless steel screens. Screen
weights were taken before and after electrospinning to
determine total weight of fibers deposited on th e screens.
Fiber mats at total weights of approximately 2.4, 5.2, 7.3
and 13.7 mg were used in the study. From each 6.4 cm
fiber mat, 18 sm aller 0.75 cm circ les were produced using a
die cutter for the QD assay development in 96 well plates.
Further mention of fiber weights in this paper will refer to
the weights of the fibers produced by electrospinning on
the 6.4 cm stainless steel screens, since fiber weights of the
small 0.75 cm screen punches could not be measured with
accuracy.
Avidin attachment to electrospun membranes
Avidin was covalently attached to the carboxylated PVC
using 1-ethyl-3-(3-Dimethylaminopropyl) carbodiimide
Hydrochloride (EDC) in the presences of N-Hydroxysulfo-
succinimide (Sulfo-NHS) (Thermo Fisher Scientific, Rock-
ford, IL) with some modification [7]. Each of the 0.75 cm
fibers were placed in individual wells of a 24 well tissue
culture plate and wetted with 1 ml phosphate bufferend
saline (PBS)/Tween 20 0.3% pH 7.2, soaked for 5 min and
then rinsed with 500 ul of pH 5.0, 0.1 M 2-[N-morpho-
lino] ethane sulfonic acid (MES)/0.1% Tween 20, 5 min
shaking at 75 rpm on an orbital shaker. The wash solution
was removed and 500 ul of fresh MES/0.1% Tween was
added. Carboxyl groups on the nanofiber membranes were
activated with 100 ul of EDC (10 mg/ml in MES Tween
0.1% pH 5.0) and 100 ul of Sulfo-NHS (27.5 mg/ml in
MES Tween 0.1% pH 5.0) added to each well, shaken for 5
min at 75 rpm and then incubated for 30 min statically.
Membranes were then washed twice in 1 ml of PBS (100
mM sodium phosphate, 150 mM NaCl, pH 7.2) to remove
un-reacted EDC and Sulfo-NHS before a final 500 ul
volume of avidin-PBS solution (200 ug/ml, PBS pH 7.4)
was added to each membrane and shaken at 75 rpm for
1 h then static incubation overnight at 4°C.
Attachment of QD
Each avidin coated membrane was washed 3 times in a
Tris-buffered saline (TBS) containing 0.05% Tween
20 pH 8.0 on an orbital shaker for 5 min at 75 rpm.
The final wash solution was removed before addition of
the biotinylated QDs. Biotinylated QD (QDot 655, Invi-
trogen Corp. Carlsbad CA.) was prepared in TBS pH 8.0
at a concentration of 5 nM and 500 ul was added to
each well for static incubation, 1 h at RT and then over-
night at 4°C. Following overnight incubation each mem-
brane was washed 3 times in TBS pH 8.0 containing
0.05% Tween 20 at 75 rpm for 5 min.
Measurement and analysis
Each QD 655 coated membrane was transferred to a black
96 well micro titer plate being careful to orientate the elec-
trospun nanofibers facing up. Each membrane was cov-
ered with 100 ul of TBS pH 8.0 to prevent dehydration
and quenching of the QDs during measurement of fluor-
escence. A standard curve was generated (total fluores-
cence vs. femtomole of QD 655) from a serial dilution
series of the stock 2 uM QD 655 solution at 1000, 500,
250, 125, 62.5, 31.5, 15.6 and 0 femtomoles of QDs con-
tained in100 ul of TBS pH 8.0,measured in triplicate. The
samples were read on a fluorescence plate reader (Fluoros-
kan, Thermo Fisher Scientific) using a normal beam siz e
and an integration time of 1000 ms (320 nm excitation
and 650 nm emission filter set). Control membranes for
measurement of fluorescence background and nonspecific
binding of the QDs to the nanofibers were also included
in the assay. The nonspecific binding was measured on
membranes that received a dose of biotinylated QD 655
but were not activated with EDC and Sulfo-NHS.
Confocal laser scanning microscopy (CLSM)
Images of QD labeled electrospun nanofibers were ta ken
on a Carl Zeiss LSM 710 (Thornwood, NY) confocal
microscope using an EC Plan-Neofluar Iris M27, 100x
objective (NA 1.3, oil). The sample was excited using the
405 nm diode laser (30%, 1.0 × zoom, pinhole 66 um) and
the emission detection was set from 635 nm to 678 nm
capturi ng the narrow emission peek of the 655 quantum
dot.
Statistical Analysis
Statistical analysis was performed using Statistical Analysis
Systems software version 9.1 (SAS Institute, Inc., Cary, N.
C.). Regression analysis was conducted to determine the
line of best fit for both the standard curve and membrane
weight data sets. The means of each concentration or
treatment level for both the standard curve (n = 3) and the
memb rane weight data (n = 18) were used for linear and
2
nd
order polynomial analysis using the REG procedure
respectively. Analysis of variance was conducted using the
MIXED model procedure for the membrane weight data
with significant differences (P ≤ 0.05) between LSMEANS
determined by the PDIFF statement.
Marek et al. Journal of Nanobiotechnology 2011, 9:48
/>Page 6 of 7
Acknowledgements and Funding
This work was directly funded under the DoD Joint Service Combat Feeding
Technology Program.
Author details
1
Food Safety and Defense Team, U. S. Army Natick Soldier Research,
Development and Engineering Center, 15 Kansas St. Natick M. A. 01760-5018,
USA.
2
Molecular Sciences and Engineering Team, U. S. Army Natick Soldier
Research, Development and Engineering Center, 15 Kansas St. Natick M. A.
01760-5018, USA.
Authors’ contributions
KS and AS conceived of the study and contributed to data interpretation.
PM and JM performed QD binding assays and PM also conducted statistical
analysis and LSCM imaging. DN performed electrospinning with KS. PM, KS
and DN all contributed to writing the manuscript. AS and JM reviewed and
revised the manuscript. All authors have read and approved the final
manuscript.
Competing interests
The authors declare that they have no competing interests.
Received: 30 August 2011 Accepted: 24 October 2011
Published: 24 October 2011
References
1. Jayaraman K, Kotaki M, Zhang Y, Mo X, Ramakrishna S: Recent advances in
polymer nanofibers. J Nanosci Nanotechnol 2004, 4:52-65.
2. Gibson P, Schreuder-Gibson H, Rivin D: Transport properties of porous
membranes based on electrospun nanofibers. Colloid Surface A 2001,
187-188:469-481.
3. Ming-Huang Z, Zhang YZ, Kotaki M, Ramakrishna S: A review on polymer
nanofibers by electrospinning and their applications in nanocomposits.
Composites Science Technology 2003, 63:2223-2253.
4. Li D, Xia Y: Electrospinning of nanofibers: Reinventing the wheel. Adv
Mater 2004, 16:1151-1170.
5. Deitzel JM, Kleinmeyer JD, Hirvonen JK, Beck Tan NC: Controlled
deposition of electrospun poly(ethylene oxide) fibers. Polymer 2001,
42:8163-8170.
6. Carnell LS, Siochi EJ, Wincheski RA, Holloway NM, Clark RL: Electric field
effects on fiber alignment using an auxiliary electrode during
electrospinning. Scripta Mater 2009, 60:359-361.
7. Wu D, Han D, Steckl AJ: Immunoassays on free-standing electrospun
membranes. Appl Mater & Inter 2010, 2:252-258.
8. Wang XY, Drew C, Lee SH, Senecal KJ, Kumar J, Samuelson L: Electrospun
nanofibrous membranes for highly sensitive optical sensors. Nano Lett
2002, 2:1273-1275.
9. Yang DY, Niu X, Liu YY, Wang Y, Gu X, Song LS, Zhao R, Ma LY, Shao YM,
Jiang XY: Electrospun nanofibrous membranes: A novel solid substrate
for microfluidic immunoassays for HIV. Adv Mater 2008, 20:4770-4775.
10. Wu D, Steckl AJ: High speed nanofluidic protein accumulator. Lab on a
Chip 2009, 9:1890-1896.
11. Manis AE, Bowman JR, Bowlin GL, Simpson DG: Electrospun nitrocellulose
and nylon: Design and fabrication of novel high performance platforms
for protein blotting applications. J Biol Eng 2007, 1.
12. Senecal A, Magnone J, Marek P, Senecal K: Development of functional
nanofibrous membrane assemblies towards biological sensing. React
Funct Polym 2008, 68:1429-1434.
13. Wayment JR, Harris JM: Biotin-avidin binding kinetics measured by single-
molecule imaging. Anal Chem 2009, 81:336-342.
14. Roach P, Shirtcliffe NJ, Farrar D, Perry CC: Quantification of surface-bound
proteins by fluorometric assay: comparison with quartz crystal
microbalance and amido black assay. J Phys Chem B 2006,
110:20572-20579.
15. Wilchek M, Bayer EA: Introduction to avidin-biotin technology. In
Avidin-
Biotin Technology. Edited by: Wilchek M and Bayer EA. New York: Academic
Press; 1990:5-13, [Abelson JN and Simon MI (Series Editors) Methods in
Enzymology, vol 184.].
16. Monton H, Nogues C, Rossinnyol E, Castell O, Roldan M: QDs versus alexa:
reality of promising tools for immunochemistry. J Nanobiotech 2009, 7.
17. Michalet X, Pinaud FF, Bentolila LA, Tsay JM, Doose S, Li JJ, Sundaresan G,
Wu AM, Gambhir SS, Weiss S: Quantum dots for live cells, in vivo imaging
and diagnostics. Science 307:538-544.
18. Walling MA, Novak JA, Shepard JRE: Quantum dots for live cell and in
vivo imaging. Int J Mol Sci 2009, 10:441-491.
19. Qdot
®
Nanocrystal Frequently Asked Questions. [itrogen.
com/site/us/en/home/brands/Molecular-Probes/Key-Molecular-Probes-
Products/Qdot/Frequently-Asked-Questions.html].
doi:10.1186/1477-3155-9-48
Cite this article as: Marek et al.: Application of a biotin functionalized
QD assay for determining available binding sites on electrospun
nanofiber membrane. Journal of Nanobiotechnology 2011 9:48.
Submit your next manuscript to BioMed Central
and take full advantage of:
• Convenient online submission
• Thorough peer review
• No space constraints or color figure charges
• Immediate publication on acceptance
• Inclusion in PubMed, CAS, Scopus and Google Scholar
• Research which is freely available for redistribution
Submit your manuscript at
www.biomedcentral.com/submit
Marek et al. Journal of Nanobiotechnology 2011, 9:48
/>Page 7 of 7