Báo cáo khoa hoc:" Searching for plasticity in dissociated cortical cultures on multi-electrode arrays" docx
Bạn đang xem bản rút gọn của tài liệu. Xem và tải ngay bản đầy đủ của tài liệu tại đây (554.37 KB, 19 trang )
BioMed Central
Page 1 of 19
(page number not for citation purposes)
Journal of Negative Results in
BioMedicine
Open Access
Research
Searching for plasticity in dissociated cortical cultures on
multi-electrode arrays
Daniel A Wagenaar*
1,2
, Jerome Pine
3
and Steve M Potter*
4
Address:
1
Department of Physics, California Institute of Technology, Caltech 103-33, Pasadena, CA 91125, USA,
2
Present address: Division of
Biological Sciences, Neuroscience Section, University of California at San Diego, 9500 Gilman Drive, La Jolla, CA 92093, USA,
3
Department of
Physics, California Institute of Technology, Caltech 256-48, Pasadena, CA 91125, USA and
4
Coulter Department of Biomedical Engineering,
Georgia Institute of Technology and Emory University, 313 Ferst Drive, Atlanta, GA 30332-0535, USA
Email: Daniel A Wagenaar* - ; Jerome Pine - ; Steve M Potter* -
* Corresponding authors
Abstract
We attempted to induce functional plasticity in dense cultures of cortical cells using stimulation
through extracellular electrodes embedded in the culture dish substrate (multi-electrode arrays,
or MEAs). We looked for plasticity expressed in changes in spontaneous burst patterns, and in
array-wide response patterns to electrical stimuli, following several induction protocols related to
those used in the literature, as well as some novel ones. Experiments were performed with
spontaneous culture-wide bursting suppressed by either distributed electrical stimulation or by
elevated extracellular magnesium concentrations as well as with spontaneous bursting untreated.
Changes concomitant with induction were no larger in magnitude than changes that occurred
spontaneously, except in one novel protocol in which spontaneous bursts were quieted using
distributed electrical stimulation.
Background
Cultured neuronal networks can be used as models for the
study of the cellular and network properties that underlie
learning, memory, and information processing [1-5]. Cul-
tures of dissociated neurons and glia on multi-electrode
arrays (MEAs) are a very attractive model system for stud-
ying both structural and functional plasticity, since they
make it possible to record from the same set of neurons
for several months [6-8] – as opposed to mere hours for
intracellular experiments. Furthermore, it is much easier
to image a network in culture over time [9] than it is to
image an intact brain at the cellular level [10]. By consid-
ering electrical stimuli delivered by MEA electrodes as arti-
ficial sensory input, and recorded signals as analogous to
motor outputs, one can make in vitro studies more rele-
vant to in vivo neural processing. By closing the sensory-
motor loop around a culture, for example, by connecting
it to an artificial [11] or robotic [12,13] embodiment,
neural plasticity in vitro can serve as a simpler and more
accessible model for learning and memory studies than
intact lab animals.
An essential component of the implementation of learn-
ing and memory in vertebrates is changes to the connec-
tions between cortical neurons. Such changes can take the
form of the extension or retraction of neurites and spines,
accompanied by the formation or elimination of syn-
apses, or they can take the form of strengthening or weak-
ening of existing synapses (e.g. [14-16]). In culture,
plasticity in individual synapses can be induced by forcing
the postsynaptic cell to fire either just before or just after
the synapse has been activated using intracellular electro-
Published: 26 October 2006
Journal of Negative Results in BioMedicine 2006, 5:16 doi:10.1186/1477-5751-5-16
Received: 02 June 2006
Accepted: 26 October 2006
This article is available from: />© 2006 Wagenaar et al; licensee BioMed Central Ltd.
This is an Open Access article distributed under the terms of the Creative Commons Attribution License ( />),
which permits unrestricted use, distribution, and reproduction in any medium, provided the original work is properly cited.
Journal of Negative Results in BioMedicine 2006, 5:16 />Page 2 of 19
(page number not for citation purposes)
physiology [17,18]. By cleverly manipulating visual
inputs, Fu et al.[19] have shown that such 'spike timing
dependent plasticity' (STDP) can also be made to occur in
the cortex in vivo. Indeed, STDP appears to occur through-
out the brain; see [20] for a recent review of results both
in vivo and in slice.
While changes in the anatomical and functional connectiv-
ity in neural tissue take place on time-scales from millisec-
onds to years, changes that occur rapidly yet stay in effect
for a long time are particularly interesting because of their
relevance to memory formation. This is why we, as well as
may other researchers, focus on them. Accordingly, for the
purpose of this report, we define functional plasticity as
those changes in stimulus – response relationships or in
spontaneous activity patterns, that are experimentally
induced by electrical stimulation, and lasting at least on the
order of one hour. Thus, long-term potentiation (LTP) [
21
]
and long-term depression (LTD) [
22
,
23
] would be
included in the definition, but paired pulse facilitation and
depression would not, nor would spontaneously occurring
changes or developmental changes.
The history of published MEA studies demonstrating
functional plasticity in cultured networks began in the
1990s. The research group of Akio Kawana at NTT in
Japan reported that tetanic stimulation through one or
several electrodes resulted in plasticity [24]. They
observed a change in the probability of evoking bursts by
test pulses, as well as a change in the rate of spontaneous
bursting, as a result of repeatedly evoking bursts using
strong tetanic stimulation. Jimbo et al. observed similar
results with more modest tetani, and used voltage clamp
to observe inward currents associated with evoked bursts
[25]. After tetanization, the onset latencies of these cur-
rents were earlier and more precise. The following year,
Jimbo et al. reported that tetanizing a single electrode
resulted in changes in the responses to test pulses to other
electrodes [26]. Culture-wide responses to a particular
stimulation electrode were either all upregulated or all
downregulated, a phenomenon they called 'pathway-
dependent plasticity'. Individual pathways (defined as
responses throughout the array to stimuli on one particu-
lar electrode) were upregulated or downregulated
depending on the correlation between (pretetanus)
responses to stimuli applied to the test electrode and to
the tetanization electrode. In a final paper, simultaneous
tetanization through a pair of electrodes was used to
induce more subtle forms of plasticity, expressed in
detailed spike patterns evoked by electrical (probe) pulses
[27].
Since then, a few other groups have reported on other
forms of plasticity in MEA neural cultures. Typically, these
later papers have focused on more abstract plasticity
results, seemingly requiring network-level interpretations
rather than synapse-level ones. For instance, Shahaf and
Marom reported that networks could be made to learn to
respond in specific ways to test pulses, by repeatedly stim-
ulating until the desired response was obtained [3], while
Ruaro et al. reported that cultured networks could learn to
"extract a specific pattern from a complex image" that had
been presented repeatedly as spatial patterns of multielec-
trode stimulation [5].
An overview of the protocols and principal results of each
of the above-mentioned papers is given in Table 1. To the
best of our knowledge, no peer-reviewed reports by other
Table 1: Overview of plasticity-inducing stimuli used by other researchers. The following is a very brief synopsis of the methods and
main results of a number of previous studies that reported plasticity in dense cortical cultures on MEAs. Please refer to the original
papers for more information.
Ref. Induction stimuli Test stimuli Results
Maeda et al. (1998) [24] Trains of 20 pulses at 20 Hz simultaneously
to each of 5 electrodes, repeated 5–10× at
10–15 s intervals.
Trains of 20–30 pulses at 1 kHz or stronger
single pulses, to 1 or 5 electrodes, repeated
every 15–30 s.
Increased probability of evoking array-wide
bursts by test stimuli after tetanization.
Jimbo et al. (1998) [25] Trains of 11 pulses at 20 Hz to a single
electrode, repeated 10× at 5 s intervals.
Single pulses, repeated every 10 s. As above, plus earlier and more precisely
timed onset for intracellular inward currents
due to evoked bursts.
Jimbo et al. (1999) [26] Trains of 10 pulses at 20 Hz to one
electrode, repeated 20× at 5 s intervals.
Individual pulses to each of 64 electrodes,
repeated 10× at 3 s intervals.
'Pathway- dependent' plasticity.
Tateno and Jimbo (1999) [27] As above, as well as simultaneous
tetanization of a pair of electrodes.
Individual pulses to the tetanized electrodes,
repeated 53×.
Increased response to test pulses after
paired tetani, with improved temporal
precision of first response spikes.
Shahaf and Marom (2001) [3] Bipolar stimulation between a pair of
electrodes, at 1–3 s intervals, repeated until
the desired response was seen, or for 10 min
max.
Induction stimuli served as test stimuli. Desired responses (increased spike rate 50–
60 ms post-stimulus) obtained after fewer
trials on successive test series.
Ruaro et al. (2005) [5] Trains of 100 pulses at 250 Hz
simultaneously to each of 15 electrodes in an
L-shape, repeated 40× at 2 s intervals.
Stimuli, simultaneously to several electrodes,
in an L- or O-shape.
Responses to L-shape enhanced relative to O-
shape.
Journal of Negative Results in BioMedicine 2006, 5:16 />Page 3 of 19
(page number not for citation purposes)
research groups verifying any of these results have been
published to date. As a result, whether cortical cultures
can, in fact, learn is currently a subject of controversy [28].
At least, it appears that the conditions in which plasticity
can be induced in dissociated cortical cultures using extra-
cellular electrical stimuli are subtle and not very well
understood.
As a necessary prerequisite to studying learning and mem-
ory in MEA cultures, we sought to demonstrate reliable
functional plasticity using extracellular stimulation proto-
cols similar to some of those mentioned above. One pro-
tocol, in which bursting was quieted with distributed
multi-site stimuli [29] showed a small but statistically sig-
nificant plasticity, but all other protocols failed to show
functional plasticity (in the sense defined above). We dis-
cuss the implications of effects of spontaneous popula-
tion bursting on plasticity in cultured networks.
Results
Confirmation of cultures' basic physiological properties
Since we describe mostly negative results, it was critical to
make sure that positive results could have been obtained.
That is, the stimulation and recording systems must be
working, the preparations healthy, and their spontaneous
activity and responses to test pulses comparable to those
observed in cultures in which induced plasticity has been
reported by others. Similarity in reaction to common
pharmacological agents should also be confirmed.
Our cultures passed each of these checks:
Spontaneous activity
The spontaneous activity of our cultures consisted of
interspersed firing of several cells at low rates, inter-
rupted by culture-wide bursts at varying intervals [30].
This is similar to the behavior of the cultures used by
the NTT group [31] and others [32,8].
Responses to test pulses
As reported before [33], we observed individual spikes
and short trains of spikes on many electrodes in
response to electrical stimulation on a single elec-
trode, just as the NTT group did [26]. In addition, cul-
ture-wide bursts were observed in response to some
stimuli, in agreement with the findings of [24].
Reactions to pharmacological manipulations
An increased magnesium concentration in the
medium reduced or abolished burstiness, presumably
by blocking the calcium channels of NMDA receptors
(Figure 1A). An increase in burst frequencies and inter-
burst spike rates was obtained by adding potassium
(Figure 1B), presumably through shifting the resting
membrane potential: adding 3 mM K
+
(to the baseline
of 5.8 mM) should result in a depolarization by about
11 mV. With NMDA receptors blocked by AP5 (100
μ
M), bursting ceased (Figure 1C). Blocking AMPA
receptors with CNQX (10
μ
M) also prevented burst-
ing, and reduced inter-burst spike rates (Figure 1D).
Conversely, bicuculline, a blocker of GABA receptors,
increased burst rates at a concentration of 50
μ
M (Fig-
ure 1E).
We also tested whether our cultures exhibited the 'elastic'
changes in response strength observed in [34]. They found
that when two electrodes were repeatedly stimulated, one
at a very slow rate (0.02 Hz) and one at a faster rate (0.2
Hz), the responses to the 'slow' electrode were enhanced
while the responses to the 'fast' electrode are weakened,
effects which were fully reversible. In our tests, we stimu-
lated one electrode, A, at 1 Hz for one hour, while stimu-
lating another, B, at 1/60 Hz. Indeed, responses to
electrode A decreased significantly (p < 0.001; N = 16 elec-
trode pairs in 4 cultures), while responses to electrode B
appeared to increase slightly (p = 0.06; Figure 2). Then, the
roles were reversed for one hour – B was stimulated at 1
Hz, and A at 1/60 Hz – and soon responses to A increased
back to baseline or perhaps slightly above (p = 0.2), while
responses to B decreased significantly (p < 0.05), in agree-
ment with [34]. In conclusion, our cultures are healthy,
and – by all measures we tested – are similar to those used
by other researchers.
Overview of protocols
We looked for plasticity induced by electrical stimulation
in three series of investigations: Changes induced in burst
patterns, Changes in stimulus-response maps, and Changes in
specific responses. Within each series, we performed experi-
ments with several different protocols. Before describing
the methods and results in detail, we provide in this sec-
tion an overview of our protocols.
Series I: Changes induced in burst patterns
If a plasticity-inducing stimulus sequence has an effect
on many synapses, it should have an effect on a cul-
ture's overall activity, and in particular on its sponta-
neous culture-wide bursts. Strong stimuli, delivered
through several electrodes in parallel, should have the
best chance of inducing such global plasticity. To test
this hypothesis, we recorded spontaneous activity
before and after attempting to induce plasticity using
strong stimuli, and measured burst frequencies, sizes,
and the total number of spikes in bursts per unit time.
In similar experiments, [24] found that burst frequen-
cies increased following tetanization.
Journal of Negative Results in BioMedicine 2006, 5:16 />Page 4 of 19
(page number not for citation purposes)
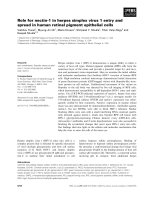
Reactions to pharmacological manipulationsFigure 1
Reactions to pharmacological manipulations. A Adding 1 mM Mg
2+
(to the baseline of 0.8 mM) stopped spontaneous
bursts, and reduced the array-wide spike detection rate (ASDR) outside of bursts slightly. B Adding 1 or 3 mM K
+
(to the base-
line of 5.4 mM) increased burst rates and inter-burst firing rates. The fraction of spikes that occurred inside bursts (as opposed
to between bursts) remained similar. C CNQX, an AMPA channel blocker, inhibited bursting and reduced baseline ASDR. D
AP5, an NMDA channel blocker, inhibited bursting for a limited period of time. E Bicuculline methiodide (BMI), a GABA chan-
nel blocker, increased burstiness. (Data for A–E were obtained from different cultures, N = 1 for each substance. Baselines
were recorded immediately prior to adding drugs. Since the results were fully consistent with expectations, a more in-depth
investigation was deemed unnecessary.)
0 10 20
Time (min)
0
5000
10000
ASDR (s
−1
)
Baseline
+ 1 mM MgCl
2
0 10 20 30
Time (min)
0
5000
10000
ASDR (s
−1
)
+0 +1
[MgCl
2
] (mM)
0
100
200
300
ASDR (s
−1
)
Median
Mean
0 10 20 30
Time (min)
0
2000
4000
ASDR (s
−1
)
Baseline
0 10 20 30
Time (min)
0
2000
4000
ASDR (s
−1
)
+ 1 mM KCl
0 10 20 30
Time (min)
0
2000
4000
ASDR (s
−1
)
+ 3 mM KCl
+0 +1 +3
[KCl] (mM)
0
100
200
300
ASDR (s
−1
)
Median
Mean
+0 +1 +3
[KCl] (mM)
0
1
2
Burst rate (bpm)
+0 +1 +3
[KCl] (mM)
0
0.5
1
Fraction spikes in bursts
0 10 20 30
Time (min)
0
500
1000
1500
ASDR (s
−1
)
Baseline
0 10 20 30
Time (min)
0
500
1000
1500
ASDR (s
−1
)
+ 10 μM CNQX
0 10 20 30
Time (min)
0
500
1000
1500
2000
2500
ASDR (s
−1
)
Baseline
0 10 20 30
Time (min)
0
500
1000
1500
2000
2500
ASDR (s
−1
)
+ 100 μM AP5
0 10 20 30
Time (min)
0
2000
4000
6000
ASDR (s
−1
)
Baseline
0 10 20 3
0
Time (min)
0
2000
4000
6000
ASDR (s
−1
)
+ 50 μM BM
I
A
B
C
D
E
Journal of Negative Results in BioMedicine 2006, 5:16 />Page 5 of 19
(page number not for citation purposes)
Series II: Changes in stimulus – response maps
According to [26], tetanization through a single elec-
trode can induce changes that are stimulation-site spe-
cific, that is, array-wide responses to test stimuli on a
given electrode (not necessarily the tetanized elec-
trode) are either all upregulated or all downregulated.
To test this hypothesis, we recorded responses to test
pulses delivered sequentially to each electrode in the
array before and after tetanization. Then we asked two
questions: (1) Is there any change in how strongly
individual recording sites respond to particular stim-
uli? (2) Are such changes stimulation-site specific (as
reported by [26]), recording-site specific, or more
complexly distributed?
Series III: Changes in specific responses
From intracellular recording experiments, it is well
known that tetanizing a pair of cells can strengthen or
weaken synapses between those cells depending on
the timing of the tetanizing stimuli. MEA electrodes do
not provide direct access to pairs of cells with known
synaptic connectivity, but if one electrode records
responses both after stimulation to electrode A and to
electrode B, it is likely that shared synaptic pathways
exist. Therefore, tetanizing the pair A and B can be
expected to affect the responses on the shared target.
To test this hypothesis, we selected pairs of stimula-
tion electrodes that both evoked responses at a third
site, recorded those responses, and compared them
before and after paired-pulse tetanization.
These protocols were chosen because of their relative sim-
plicity, and because their expected results have an intui-
tive connection to established properties of LTP and LTD
induction in individual pairs of cells (compare [24,26]
and [18]). We hoped that this would make it easier to
obtain positive results. Viewed in this light, the more
abstracted learning described by [3] or [5] would be less
obvious starting points for studying the generalizability of
plasticity results. (Note that our choices were in no way
politically motivated, nor do we intend to cast doubt on
any specific results previously reported.)
In all experiments, spontaneous or test-pulse-evoked
activity was recorded for two hours (or more) before and
two hours after the induction sequence. The activity in the
first hour after induction (the "post" period) was then
compared to the activity in the last hour before (the "base-
line" period), to determine the changes associated with
the induction sequence. Importantly, the activity in the
hour before induction was also compared to the activity
one hour before that (the "control"), to estimate the mag-
nitude of spontaneous changes attributable merely to drift
or random variability. This is critical, because drift typi-
cally substantially exceeds inter-trial variability in record-
ings from dissociated cultures on MEAs. Statistical tests
were applied to determine whether changes concomitant
with the induction sequence were larger than spontane-
ous changes. Each protocol was tested on multiple cul-
tures. These experiments should have had enough
statistical power to discover plastic changes if any of the
effects previously reported occurred in our cultures.
Multiple ways of handling culture-wide bursts
A large part of the spontaneous activity of dense cortical
cultures on MEAs consists of globally synchronized
intense bursts [31,32,8,30]. These bursts often contain
thousands of spikes in a brief period (0.1–2 s), and should
be distinguished from bursts consisting of only a few
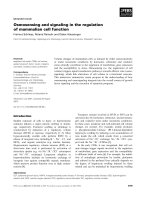
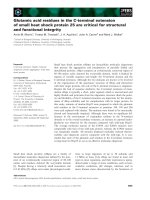
Confirmation of the elasticity results of Eytan et al. (2003) [34]Figure 2
Confirmation of the elasticity results of Eytan et al.
(2003) [34]. One electrode was initially stimulated at 1 Hz
for one hour (solid symbols), while another was stimulated at
1/60 Hz (open symbols). Then, the roles were reversed. The
graph shows the number of spikes recorded array-wide, 15–
30 ms after a stimulus, normalized to the value at the begin-
ning of the experiment. 'Start' refers to the first stimulus to
the 'slow' electrode, or the average of the first 5 stimuli to
the 'fast' electrode; 'Early' refers to the average of the first 5
stimuli to the 'slow' electrode, or the average of the 5 × 4
surrounding stimuli to the 'fast' electrode; 'Late' refers to
average of the last 20 stimuli to the 'slow' electrode, or the
average of the last 1200 stimuli to the 'fast' electrode. (This
slightly unusual way of organizing the data was used to bal-
ance the need to collect sufficient statistics with the desire to
measure as close as possible to the beginning of the experi-
ment.) Data are mean ± SEM (in log-space) from 16 experi-
ments on 4 cultures. The sequence of open and closed
symbols near the top of the graph are a cartoon of the stim-
ulation sequence; the actual number of stimuli was much
greater.
Start Early Late Start Rev. Early Rev. Late Rev.
Time frame
0.2
0.3
0.4
0.5
1
1.5
2
3
Normalized response strength
Journal of Negative Results in BioMedicine 2006, 5:16 />Page 6 of 19
(page number not for citation purposes)
spikes recorded from individual cells. We previously
hypothesized that this ongoing spontaneous bursting
activity may interfere with inducing plasticity and main-
taining changes [29]. Therefore, in addition to experi-
ments under baseline conditions, we used two different
methods to reduce bursting. One was to add 1 or 2 mM
magnesium chloride to the medium (baseline concentra-
tion of Mg
2+
: 0.8 mM). This transiently reduced or abol-
ished spontaneous bursting, presumably by reducing
NMDA channel conductance (see Figure 1). Note that
even though partially blocking NMDA channels could be
expected to affect LTP and LTD, this same method of
reducing bursting was used in [24], apparently without
negatively affecting plasticity. The other method we used
was distributed electrical stimulation [29], which com-
pletely suppressed bursting for as long as it was applied.
Distributed electrical stimulation, when used, was also
applied for the entire duration of the experiment, so that
any potential (unintentional) short-term or long-term
plasticity it might cause would not confound our tests for
plasticity caused by the (intentional) induction protocols.
(Note that in previous work [29] we saw no plastic effects
from burst quieting.)
We shall now proceed to describe each of the three series
of experiments in detail.
Series I: Changes induced in burst patterns
We tested whether strong stimuli could induce changes in
spontaneous bursting behavior in 10 cultures. We meas-
ured the number of bursts spanning at least 10 electrodes
in one-hour windows before and after an induction
sequence, as well as the number of spikes in those bursts.
Very strong stimuli were used as induction sequences in
these experiments. In most cases, several experiments
were performed consecutively on one culture, with several
hours between experiments.
Details of induction sequences
Induction consisted of volleys of pulses to 5–10 elec-
trodes. Electrodes were chosen on the basis that they
evoked strong responses when stimulated individually
(see Choice of electrodes, under Methods). Within a volley,
each electrode received one pulse, and successive elec-
trodes were stimulated at 2–5 ms intervals (inter-electrode
interval; IEI). Such volleys had a high probability of evok-
ing bursts, which, according to [24], is essential for affect-
ing later spontaneous bursting. Volleys were either
delivered singly, or in sets of 4 or 20 with an inter-volley
interval (IVI) of 50–500 ms. A pause of 5–10 s was inter-
posed between sets, so that each set had a good chance of
evoking bursts. (In general, evoking bursts was subject to
a relative refractory period on the order of 1 s [31].) The
full induction sequence lasted 8–17 min. The precise pro-
tocols used in this series are listed in Table 2.
Data analysis and results
To test whether stimuli had an effect on spontaneous
bursting, we counted the number of bursts in the hour
immediately before the induction sequence (N
base
), as
well as in the hour after (N
post
). In order to be able to test
whether the change concomitant with the induction
sequence was larger than changes that occurred spontane-
ously, we also counted bursts in the hour before the base-
line hour, called the control hour (N
ctrl
). We then
computed the absolute value of the change concomitant
with the induction sequence, ΔN
ind
= |N
post
- N
base
|, as well
as the spontaneous change, i.e., the change attributable to
drift, ΔN
spont
|N
base
- N
ctrl
|.
Only one experiment out of 28 showed significantly larger
changes concomitant with the induction sequence than in
spontaneous activity; this is the example shown in Figure
3A. Contrary to the observations by [24], these changes
consisted of a decrease in burst rates. More typically, the
Table 2: Details of experiments on plasticity expressed in burst patterns (Series I).
Protocol Tetanus Conditions No. and ages of
cultures
Total expts. Intervals
a
I.1 Sets of 4 volleys (IVI: 500 ms) to 10 geometrically
close electrodes (IEI: 5 ms), repeated every 5 s
for 15 min.
Baseline medium,
spontaneous bursting.
2 × 2
b
; 10–19 div 4 -
I.2 Single volleys to 5 electrodes (IEI: 2 ms), repeated
every 10 s for 17 min.
Baseline medium,
spontaneous bursting.
4; 13–16 div 16 4 h
I.3a Single volleys to 8 electrodes in a vertical column
(IEI: 2 ms), repeated every 10 s for 15 min.
Elevated magnesium (1–2
mM) to reduce
spontaneous bursting.
3; 18–20 div 6 2 h
I.3b Sets of 20 volleys (IVI: 50 ms) to 8 electrodes in a
vertical column (IEI: 2 ms), repeated every 5 s for
8 min.
Elevated magnesium (1–2
mM) to reduce
spontaneous bursting.
1; 17 div 2 2 h
a
Between experiments on a single culture.
b
Two cultures were each used twice, 6 days apart, resulting – for practical purposes – in four independent experiments.
Journal of Negative Results in BioMedicine 2006, 5:16 />Page 7 of 19
(page number not for citation purposes)
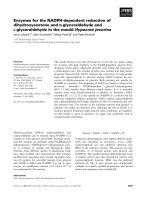
Results of Series I: Changes induced in spontaneous bursting by strong stimulation through several electrodesFigure 3
Results of Series I: Changes induced in spontaneous bursting by strong stimulation through several electrodes.
A An exceptional example from protocol I.1, where the induction sequence resulted in reduced burst rates and sizes. Note
though, that spontaneous drift in the burst rate before the analyzed portion of the recording was of comparable magnitude. B
A typical example from protocol I.2, showing no effect. Induction sequences in A and B are marked by gray bars. Top to bot-
tom: number of spikes in individual bursts; number of bursts in successive one-hour time windows (with error bars based on
assumed Poisson statistics); total number of spikes in bursts in successive hours. C A summary of all experiments in Series I
shows that changes concomitant with induction were no larger than spontaneous changes. D Comparison of spontaneous
changes and changes concomitant with induction in hourly burst rates. Unlike in C, all changes were normalized to the hourly
burst rate before the induction sequence. Data are mean ± SEM of absolute values of changes; N = 4, 16, 8 for protocols I.1,
I.2, I.3 respectively. Paired t-tests revealed no significant effects of the induction sequence.
−4 −3 −2 −1 0 1 2 3 4
Time (hours)
0
100
200
300
Spikes/burst
0
10
20
30
40
Bursts/hour
0
5000
10000
B.spikes/hour
−4 −3 −2 −1 0 1 2 3 4
Time (hours)
0
1000
2000
3000
Spikes/burst
0
20
40
60
80
Bursts/hour
0
25000
50000
75000
B.spikes/hour
−20 0 20 40 60 80
Spontaneous change (bursts/hour)
−20
0
20
40
60
80
Change concomitant with induction (bursts/hour)
Protocol I.1
Protocol I.2
Protocol I.3 (a and b)
I.1 I.2 I.3 (a and b)
Protocol
0%
20%
40%
60%
Normalized absolute change in hourly burst count
Spontaneous
Concomitant
with induction
AB
CD
Journal of Negative Results in BioMedicine 2006, 5:16 />Page 8 of 19
(page number not for citation purposes)
induction sequences had no appreciable effect (see, for
example, Figure 3B). Overall, changes concomitant with
induction were no larger than spontaneous changes in
any protocol (Figure 3C). It is not clear why one culture
did show plasticity; apart from its reaction to the induc-
tion sequence, nothing set it obviously apart from its sister
cultures. Certainly, the top panel of Figure 3A looks quite
convincing, so it is attractive to hypothesize that some-
thing special happened. However, the culture used in this
experiment was not in any way special: its age was in the
middle of the range, we noted no distinguishing physical
characteristics, and its pre-experimental activity was simi-
lar to the other cultures tested. Thus, we suspect the results
may have been a statistical fluke. After all, testing at the p
< .05-level, one positive result out of 28 is not unexpected.
For the purpose of comparing results between cultures
with widely varying burst rates, we normalized the
changes by the baseline burst rates N
base
, and calculated
the averages of |ΔN
ind
|/N
base
and |ΔN
spont
|/N
base
across all
experiments with a given protocol. This revealed that
changes concomitant with the induction sequence were
not significantly greater than spontaneous changes in any
protocol (Figure 3D). (In protocol I.3, with elevated extra-
cellular magnesium to reduce bursting, spontaneous
changes were in fact larger. This may be due to transient
effects of the magnesium, which partially wore off during
the course of the experiment, resulting in additional drift,
especially between control and baseline periods.) We also
calculated the average number of spikes per burst before
and after the induction sequence, and found no signifi-
cant effects of stimulation in that measure either (data not
shown).
Series II: Changes induced in stimulus–response maps
We tested whether tetani delivered to individual elec-
trodes could cause network-level plasticity resulting in
changes in array-wide responses to probe stimuli on any
electrode. As in Series I, several experiments were usually
performed on each culture, with several hours between
experiments.
Details of induction sequences
In most experiments, induction sequences consisted of
several tetanic trains of stimuli delivered to a single elec-
trode. Each train consisted of 20 pulses, at 50 ms intervals.
A complete induction sequence consisted of 20 trains,
with 2 s between trains. Before experiments, the relation
between stimulation voltage and array-wide response
strength was determined for each electrode (see Choice of
electrodes, under Methods). For tetanization, we then chose
electrodes that evoked strong culture-wide responses. In
one set of experiments (protocols II.5a and b), tetanic
stimulation was applied to clusters of electrodes, as in I.3a
and b. Details of all experiments are summarized in Table
3.
Details of probe sequences
Each of the 59 electrodes in the array was probed with test
stimuli for a one-hour "control" period followed by a one-
hour "baseline" period. Probes were delivered cyclically to
all electrodes, with 3 s between pulses. The firing rates of
each of 58 functional recording electrodes were observed,
10–50 ms after a test pulse to one of the 59 stimulation
electrodes. After the tetanic induction sequence, the net-
work was probed in the same manner for another one-
hour "posttetanic" period. In most experiments, probe
pulse amplitudes were fixed at 0.8 V. In some (protocol
II.4), they were reduced in an attempt to define probe
Table 3: Details of experiments on plasticity expressed in stimulus–response maps (Series II).
Protocol Tetanus target Probe amplitude Conditions No. and ages of
cultures
Total expts. Intervals
II.1 Single electrode. Fixed, 0.8 V. Baseline medium, spontaneous
bursting.
4; 17–22 div 8 2 h
II.2 Single electrode. Fixed, 0.8 V. Bursts completely suppressed by 50
Hz background stimulation distributed
over 20–40 electrodes, except during
tetanization.
3
a
; 17–22 div 6 2 h
II.3 Single electrode. Fixed, 0.8 V. Spontaneous bursts suppressed by 1
mM magnesium.
3; 26–28 div 6 2 h
II.4 Single electrode. Reduced (see
Methods).
Spontaneous bursts suppressed by 2
mM magnesium.
4; 29–32 div 16 2 h
II.5a 8 electrodes, as in
I.3a.
Range of voltages,
100–900 mV.
Spontaneous bursts suppressed by 1–2
mM magnesium.
3; 18–20 div 12 2 h
II.5b 8 electrodes, as in
I.3b.
Range of voltages,
100–900 mV.
Spontaneous burst suppressed by 2
mM magnesium.
1; 17 div 4 2 h
a
In a 4th experiment, burst suppression did not work sufficiently well. Those data were excluded from further analysis.
Journal of Negative Results in BioMedicine 2006, 5:16 />Page 9 of 19
(page number not for citation purposes)
pulses that would not evoke culture-wide bursts. (This
attempt was largely unsuccessful, see Methods.) In proto-
cols II.5a and b we probed for test responses using many
different pulse amplitudes.
Data analysis and results
By averaging the responses recorded within each one-hour
period (separately for each stimulation electrode-record-
ing electrode pair), a response map was constructed. Dif-
ferences between the "baseline" and "posttetanic" maps
were then compared to differences between the "baseline"
and "control" maps. Specifically, we counted the number
of spikes 10–50 ms after each probe stimulus, separately
for each recording electrode. For each of the three periods,
we then computed the mean number of spikes detected
on electrode R (for 'Recording'), after a test stimulus on
electrode S (for 'Stimulation'): (the mean over all
stimuli to a given electrode S in the baseline period just
before tetanization), (the means for the control
period before that), and (the means for the hour
immediately after tetanization).
We wanted to know not only whether significant tetanus-
related changes occurred in individual (S,R)-pairs, but
also whether such changes were linked to specific stimula-
tion sites, as reported in [26]. In that case, responses on all
or most recording sites to one given stimulation site
should be up- or downregulated together. We also consid-
ered the converse hypothesis: changes might occur at spe-
cific recording sites, in other words, all responses on a
given recording site could be up- or downregulated
together, independently of which stimulation site was
used to evoke the response. To test these hypotheses, we
calculated
which would deviate significantly from zero if changes
were stimulation-site specific (as in [26]), as well as
which would deviate significantly from zero if changes
were recording-site specific. (If changes were randomly
distributed, both inner sums would have a roughly equal
number of positive and negative terms, and hence not be
very large.)
In protocols II.3 and II.4, stimulation-site-specific
changes exceeded recording-site-specific changes, in
agreement with [26]; see Figure 4A for an example. How-
ever, stimulation-site-specific differences between the
control and baseline periods were also observed, and no
obvious difference was seen between the spontaneous dif-
ferences and those concomitant with tetanization. We
quantified this by calculating
and comparing this with . In protocols II.5a and
b, where stimuli of many different voltages were used on
each electrode, we considered each of the ~3400 stimu-
lus–response pairs in turn, and fitted a straight line to the
response 10–50 ms post-stimulus vs. voltage, independ-
ently for each hour. The fit value at 700 mV was then com-
pared before and after the induction sequence, just as n
SR
was in other protocols. While differed signifi-
cantly from in protocols II.3 and II.4 (Figure 4B
and 4D), it did not differ significantly from (Fig-
ure 4C and 4E). Thus, the stimulation-site-specific
changes could not be attributed to the tetanization. In
protocol II.1 stimulation-site-specific changes across
tetani were also slightly larger than recording-site-specific
changes, but again they were no larger than spontaneous
changes. In protocols II.2 and II.5 no significant effects
were seen at all. In short, no interesting changes could be
attributed to the induction sequences in any of the exper-
iments in Series II. (As an aside, extending the response
window to 10–160 ms (as in [26]) did not improve statis-
tics; we found that probe responses were typically largely
over before 50 ms poststimulus, so lengthening the win-
dow mainly added background activity to the spike
counts.)
Changes in the probability of evoking bursts
In addition to evoking immediate responses, electrical
stimulation can often evoke bursts [33]. Therefore, in
addition to testing for changes induced in stimulus-
response maps, we investigated whether tetanization had
an effect on the ability of test pulses to evoke bursts. We
counted spikes across the array 100–500 ms after each
stimulus, and found a clearly bimodal distribution in
n
SR
base
n
SR
ctrl
n
SR
post
Δnnn
SR SR
RS
ind
stim
post base
≡−
()
∑∑
,
Δnnn
SR SR
SR
ind
rec
post base
≡−
()
∑∑
,
Δnnn
SR SR
RS
spont
stim
base ctrl
≡−
()
∑∑
,
Δn
ind
stim
Δn
ind
stim
Δn
ind
rec
Δn
spont
stim
Journal of Negative Results in BioMedicine 2006, 5:16 />Page 10 of 19
(page number not for citation purposes)
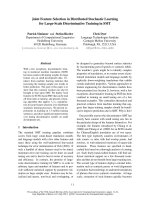
Results of Series II: Experiments on plasticity expressed in stimulus–response mapsFigure 4
Results of Series II: Experiments on plasticity expressed in stimulus–response maps. A An example from protocol
II.3. Colored pixels represent changes in the average number of spikes on a given recording electrode 10–50 ms after a test
pulse to a given stimulation electrode. The horizontal stripes of similar coloration reveal stimulation-site-specific changes.
However, spontaneous changes (right) were comparable in magnitude to changes concomitant with tetani (left). B A direct
comparison between stimulation-site-specific changes and recording-site-specific changes across tetani reveals that stimulation-
site-specific changes were dominant in all experiments. Each point corresponds to one experiment. Plot symbols indicate
tetanization protocols; arrows mark data points that fell outside the plot limits. C Direct comparison between stimulation-site-
specific changes concomitant with tetanization and due to spontaneous drift reveals that tetanization does not cause enhanced
change compared to drift. D Summary of data in B. All values were normalized by . Asterisks indicate
significance: p < 0.05 (*) or p < 0.001 (***), two-tailed t-test, N = 8, 6, 6, 16, 16 for protocols II.1, II.2, II.5. E Summary of data
in C, same normalization as in D. T-tests revealed no significant effects of tetanization.
Spontaneous
Recording site
Stimulation site
Concomitant with tetanus
Recording site
Stimulation site
−4
0
4
Change (spikes/trial)
II.1
II.2
II.3
II.4
II.5
0 500 1000
Δn
rec
tet
(spikes)
0
500
1000
1500
Δn
stim
tet
(spikes)
II.1
II.2
II.3
II.4
II.5
0 500 1000 150
0
Δn
stim
spont
(spikes)
0
500
1000
1500
Δn
stim
tet
(spikes)
*
***
***
II.1 II.2 II.3 II.4 II.5 (a and b)
Protocol
0%
20%
40%
60%
Normalized absolute change in spike count
Δn
rec
tet
/ n
base
Δn
stim
tet
/ n
base
II.1 II.2 II.3 II.4 II.5 (a and b)
Protocol
0%
20%
40%
60%
Normalized absolute change in spike count
Δn
stim
spont
/ n
base
Δn
stim
tet
/ n
base
A
BC
DE
nn
SR
SR
base base
≡
∑
,
Journal of Negative Results in BioMedicine 2006, 5:16 />Page 11 of 19
(page number not for citation purposes)
each experiment, making it very easy to distinguish trials
that evoked bursts from those that did not. For each stim-
ulation electrode, we determined the fraction of stimuli
that evoked bursts in one-hour windows. We calculated
spontaneous changes and changes concomitant with
tetani in this fraction, and found that they were equally
large (data not shown). In conclusion, tetanization did
not affect the probability of evoking bursts by test pulses.
The origin of apparent stimulation-site specific changes
How can apparently highly significant stimulation-site-
specific changes result spontaneously? We hypothesized
that network-wide bursts played an important role, since
they occurred only in some fraction of trials, but could
contribute strongly to the total number of spikes recorded
in those trials, and hence could be a major source of vari-
ability. Consider, for instance, a typical experiment from
protocol II.3. In the window of 10–50 ms post-stimulus
used for quantifying responses, most probe pulses elicited
a total of around 10–100 spikes across the entire record-
ing array, if no burst was evoked. If a burst was evoked,
this number could easily exceed 500 or even 1000, so
bursts have a major impact on the average spike count
across trials. Array-wide spike counts recorded after multi-
ple individual stimuli to each of 59 electrodes are shown
in Figure 5 for the same experiment that served as an
example in Figure 4A. It shows an immediately obvious
dichotomy between stimuli that elicited bursts and those
that did not: the former are represented by black or very
dark pixels, the latter by light gray pixels. While stimuli to
certain electrodes more readily evoked bursts than others,
burst generation was never quite reliable, so if (for exam-
ple) 4 out of 20 stimuli to a given electrode evoked bursts
in one hour, that number might well be 3 or 5 in the next
hour. Since network-wide bursts by definition affect all or
most recording sites, a random increase (or decrease)
from one hour to the next in the number of bursts evoked
by stimuli to an electrode S will result in changes in n
SR
that have the same sign for all recording electrodes R. This
produces a uniformly brown (or blue) stripe in the repre-
sentation of Figure 4A, and contributes a large positive
term to or (Whether the effect is on
or on depends on when the random
increase or decrease occurred. Either can happen with
equal likelihood, because the effect is unrelated to tetani-
zation). To give a specific example, the burst response
indicated by the small arrow in Figure 5 is responsible for
the blue row of pixels across the top of the right panel of
Figure 4A. By contrast, the response to 59 × 20 = 1180
stimuli are combined in the inner sum of (as well
as ), so individual bursts make a much smaller
relative contribution to those measures. Moreover, when
one electrode elicits an extra burst in a given hour, another
electrode is likely to elicit one burst fewer, further reduc-
ing their net contribution to and .
The effect of network-wide bursts was greatest in protocol
II.3–5, probably because elevated magnesium caused
bursts to be relatively rare and discrete events. In baseline
medium (protocol II.1), bursts occurred much more fre-
quently, while individual bursts were smaller and more
variable in size, reducing their impact on and
. With electrical burst quieting, bursts did not
usually occur at all, and could therefore not contribute to
apparent plasticity. Indeed, in protocol II.2, and
were not significantly different from
and . (Note that the relative changes shown in
Figure 4D and 4E were larger for protocol II.2 than for the
other protocols overall. This was due to a smaller absolute
spike count in probe responses in the presence of quieting
stimuli.)
Series III: Changes in specific responses
Paired-pulse stimulation of a presynaptic and a postsyn-
aptic cell with sharp intracellular or patch electrodes is a
well established protocol for inducing plasticity. Depend-
ing on the timing between the pulses, both long-term
potentiation (LTP) and long-term depression (LTD) can
be obtained using this technique in cultures from many
brain regions, including cortex and hippocampus [35,17].
We tested whether a similar protocol could be used with
MEA electrodes. Since we have no direct information
about which specific cells are stimulated by a given elec-
trode, nor from which cells an electrode records, the
search for modifiable synapses has to be, to some degree,
blind. We reasoned that if test pulses to electrode S
1
and
test pulses to electrode S
2
both evoked responses at elec-
trode R, those responses would likely be affected if paired-
pulse stimulation of S
1
and S
2
modified any synapses. This
directed search for plasticity is more sensitive than a full
(undirected) assay of changes in responses anywhere
evoked by stimulation through any electrode, because for
a full assay so many statistical tests have to be performed
that a very tight probability bound must be used to avoid
a deluge of false positives.
Δn
ind
stim
Δn
spont
stim
Δn
ind
stim
Δn
spont
stim
Δn
ind
rec
Δn
spont
rec
Δn
ind
rec
Δn
spont
rec
Δn
ind
stim
Δn
spont
stim
Δn
ind
stim
Δn
spont
stim
Δn
ind
rec
Δn
spont
rec
Journal of Negative Results in BioMedicine 2006, 5:16 />Page 12 of 19
(page number not for citation purposes)
As before, experiments consisted of a one-hour long "con-
trol" period, followed by a one-hour long "baseline"
period, followed by an induction sequence, and finally a
one-hour long "post-induction" period. In each period,
probe pulses were delivered to the tetanized electrodes S
1
and S
2
, and to two control electrodes, sequentially and
repeatedly. Responses (10–50 ms poststimulus) were
recorded on 5–10 electrodes R
i
that, during pre-experi-
mental probing, exhibited significantly elevated firing
rates both in response to stimuli to S
1
and in response to
stimuli to S
2
.
Selecting stimulation pairs
To find pairs of electrodes that shared synaptic targets, we
started with the set of candidate stimulation electrodes
identified in initial probing (see Choice of electrodes, under
Methods), and delivered 50 pulses of fixed amplitude to
each of them at 3 s intervals. For each stimulation elec-
trode, we determined the set of recording electrodes that
responded with a spike rate elevated above baseline by at
least 5 times the standard deviation of the baseline, 10–50
ms post-stimulus. We then selected from about 2000
available stimulation pairs according to the following cri-
teria:
Array-wide responses to individual stimuli in an experiment from protocol II.3Figure 5
Array-wide responses to individual stimuli in an experiment from protocol II.3. Spikes recorded on any electrode,
10–50 ms after a stimulus, are counted together and represented on a gray scale. Each pixel is one stimulus response; stimula-
tion order is top to bottom, then left to right. Separating white bars indicate division into 1-hr windows (corresponding to
blocks of 20 trials each per stimulation electrode); the dashed line represents the tetanus. Stimuli that evoked bursts show up
as black pixels. The red arrow points to a burst that, on its own, was responsible for the top-most horizontal blue stripe in Fig-
ure 4A, right sub-panel.
1 20 40 60
Probe stimulus number
Stimulation site
0
100
200
300
400
>500
Spike count
No intervention Tetanus
Journal of Negative Results in BioMedicine 2006, 5:16 />Page 13 of 19
(page number not for citation purposes)
Common response sites
Pairs of stimulation electrodes that evoked responses
on many common target sites were preferred, because
we hypothesized that plasticity would preferentially
occur at those common targets.
Mutually exclusive response sites
Pairs of electrodes that only evoked responses on com-
mon target sites were not selected, to avoid the case
where the pair of electrical pulses simply stimulated
one common cell at different locations along its axon.
For each experiment, we adjusted the selection criteria
until the number of candidate stimulation pairs was
between 10 and 20. Each of these candidate pairs typically
evoked responses at 5–20 shared electrodes, and there
typically were 5–10 electrodes that responded to one but
not the other member of the pair. For experimental use,
we then selected three pairs such that the shared targets of
any one pair minimally overlapped with the targets of the
other pairs. The distance between stimulation electrodes
within a pair was not a consideration, but no electrode
could serve in more than one pair. Pairs one and two were
tetanized in separate experiments, two hours apart; the
third pair served as a control for both experiments.
Details of induction sequences
Tetanization consisted of trains of pulse pairs: one pulse
to each of two electrodes (S
1
and S
2
), with 5 or 10 ms
between pulses (inter-electrode interval; IEI). Each train
consisted of 20 pairs, with 50 or 100 ms between pairs
(inter-pair interval; IPI). A complete tetanization
sequence contained 20 or 150 trains, at 2 or 6 s intervals
(inter-train interval; ITI). During tetanization, quieting
with electrical stimulation was suspended, except in pro-
tocol III.4 (Table 4 lists details of each of the four proto-
cols in this series).
Details of probe sequences
Test pulses with fixed amplitude (0.6 or 0.8 V) were deliv-
ered to each of the selected stimulation electrodes. Test
pulses were presented in cyclic order, with 1 or 5 s
between pulses (so that each electrode was stimulated
once every 6 or 30 s). Where electrical burst quieting was
used, quieting was suspended for 50 ms before and 200
ms after a test pulse, so that the responses to test pulses
could be measured without interference. While all six elec-
trodes were probed during both experiments, only
responses to the two tetanized electrodes and the two con-
trols were analyzed.
Data analysis and results
For each pair of stimulation electrode S and recording
electrode R the average number of spikes n
SR
per probe
response was determined in each period (control, base-
line, and postinduction). The changes in those numbers
concomitant with tetanization,
were calculated as well as the changes during normal
activity,
The results of these calculations for all experiments of pro-
tocols III.1 and III.4 are shown in Figure 6A. It is seen that
in protocol III.4, but not in protocol III.1, responses to
electrode S
1
(the electrode that led during the tetani)
appear to have been slightly potentiated. At the same
time, responses to electrode S
2
(the electrode that fol-
lowed 5 or 10 ms later) appear to have been slightly depo-
tentiated.
To quantify these observations, we calculated the averages
of and across all chosen recording elec-
trodes in all experiments, separately for S = S
1
, for S = S
2
,
Δnn n
SR SR SR
ind post base
≡−,
Δnnn
SR SR SR
spont base ctrl
≡−.
Δn
SR
ind
Δn
SR
spont
Table 4: Details of experiments on plasticity induced in specific responses (Series III)
Protocol Tetanus Probing Conditions No. and ages of
cultures
Total Expts. Intervals
III.1 20 trains (ITI: 2 s) of 20 pulse
pairs (IPI: 50 ms; IEI: 5 ms).
Single pulses of 0.8 V, at 5 s
intervals.
Baseline medium, with
spontaneous bursts.
4; 13–16 div 8 2 h
III.2 20 trains (ITI: 2 s) of 20 pulse
pairs (IPI: 50 ms; IEI: 5 ms).
Single pulses of 0.8 V, at 5 s
intervals.
Electrical burst quieting as in II.2.3
a
; 13–16 div 6 2 h
III.3 20 trains (ITI: 2 s) of 20 pulse
pairs (IPI: 50 ms; IEI: 5 ms).
Single pulses of 0.8 V, at 5 s
intervals.
Spontaneous bursts suppressed
by 1 mM magnesium.
4; 25–28 div 8 2 h
III.4 150 trains (ITI: 6 s) of 20 pulse
pairs (IPI: 100 ms; IEI: 10 ms).
Single pulses of 0.6 V, at 1 s
intervals.
Electrical burst quieting as in II.2,
but not suspended during
tetanization.
4; 20–23 div 8 2 h
a
In a 4th culture, burst suppression did not work sufficiently well. Those data were excluded from further analysis.
Journal of Negative Results in BioMedicine 2006, 5:16 />Page 14 of 19
(page number not for citation purposes)
and for S = (each of the control electrodes). We found that
in protocol III.4, responses to electrode S
1
were indeed
significantly potentiated by tetanization compared to
responses to control electrodes (p < 0.001, N = 167 elec-
trode pairs). At the same time, responses to electrode S
2
were depotentiated (also p < 0.001). Importantly, these
Results of Series III: Changes induced in specific responses by paired-pulse tetanizationFigure 6
Results of Series III: Changes induced in specific responses by paired-pulse tetanization. A Changes induced by
tetanization using protocols III.1 (left) and III.4 (right) in responses to electrodes S
1
, S
2
and the control electrodes, compared
to spontaneous drift. Plot symbols indicate stimulation electrode; key applies to both panels. Each point corresponds to one
recording electrode in one of 8 experiments. All responses are averaged over 120 presentations of the stimulus. In protocol
III.4 only, responses to electrodes S
1
, S
2
were significantly affected by tetanization. B Summary of all experiments. Shown are
mean and SEM across all electrode pairs in all experiments for a given protocol (N = 67, 67, 142, and 167 for protocols III.1,
III.2, III.3, and III.4). Large bars for spontaneous changes in the panel for protocol III.1 indicate ongoing drift. Asterisks above
bars for protocol III.4 mark significant differences between changes concomitant with tetanization and spontaneous changes: p
< 0.001 (***), paired t-test. Asterisks below bars indicate significant differences between changes in responses to tetanized
electrodes and control electrodes: p < 0.001 (***), unpaired t-test.
−2 0 2
Spontaneous change (spikes/trial)
−2
0
2
Change concomitant with tetanus (spikes/trial)
Stimulation electrodes:
S
1
S
2
Ctrl.
−2.5 0 2
.5
Spontaneous change (spikes/trial)
−2.5
0
2.5
Change concomitant with tetanus (spikes/trial)
−0.2
−0.1
0
0.1
0.2
Change (spikes/trial)
−0.02
−0.01
0
0.01
0.02
Change (spikes/trial)
−0.01
−0.005
0
0.005
0.01
Change (spikes/trial)
***
***
−0.3
−0.2
−0.1
0
0.1
0.2
0.3
Change (spikes/trial)
***
***
S
1
S
2
Ctrl.
Protocol III.1
(no burst quieting)
S
1
S
2
Ctrl.
Protocol III.2
(electrical burst
quieting, short tet.)
S
1
S
2
Ctrl.
Protocol III.3
(magnesium
burst quieting)
S
1
S
2
Ctrl.
Protocol III.4
(electrical burst
quieting, long tet.)
Spontaneous
Concomitant with tetanus
A
B
III.1 III.4
Journal of Negative Results in BioMedicine 2006, 5:16 />Page 15 of 19
(page number not for citation purposes)
changes were significantly greater than spontaneously
occurring changes, i.e. differences between control and
baseline periods (p < 0.001).
In protocol III.1, statistically significant differences were
also seen between tetanized and control electrodes (p <
0.05), but here the changes concomitant with tetanization
were not larger than spontaneous changes, so this was not
considered an important result. No significant effects were
seen in protocols III.2 and III.3.
Discussion
Out of all the protocols we tried, only one resulted in sta-
tistically significant experimentally induced plasticity.
This was surprising, since most of the protocols that did
not work were closely related to protocols reported to
cause plasticity in dissociated cultures.
One successful protocol with burst quieting in Series III
In our only successful protocol, III.4, stimulation con-
sisted of paired pulses to two electrodes S
1
and S
2
. In post-
tetanus probing, responses to electrode S
1
– which was
always stimulated 10 ms before S
2
during tetanization –
systematically increased, while responses to electrode S
2
systematically decreased. These changes were significantly
larger than spontaneous changes, and also than changes
in responses to control electrodes. It is attractive to
hypothesize that this effect can be understood to be a con-
sequence of spike timing dependent plasticity (STDP): if
S
1
and S
2
converge on a common target cell R, and S
2
caused R to spike during tetanization, the synapse from S
1
onto R would be strengthened, because it was repeatedly
activated shortly before the spike. Conversely, if S
1
caused
R to spike, the synapse from S
2
onto R would be weak-
ened, because it was repeatedly activated shortly after the
spike.
The fact that in this protocol distributed electrical stimu-
lation was used to quiet bursting supports our earlier
hypothesis [29] that spontaneous bursts interfere with
plasticity, and thus that controlling bursts is key to con-
trolling plasticity. Protocol III.2 used similar burst quiet-
ing, yet did not show plasticity greater than pre-tetanus
drift. The tetanic stimulation of III.4 was longer than that
of III.2. This suggests that detectable plasticity is evoked
only by controlling bursts and delivering a sufficiently
strong tetanus.
No successful protocols in Series I
None of the protocols in Series I produced significant
stimulus-induced plasticity, in spite of the fact that the
induction sequences evoked many culture-wide bursts –
whether an induction sequence evoked bursts was a deter-
mining factor for whether that sequence could induce
plasticity in the experiments of [24]. By elevating slightly
the concentration of Mg
2+
in the medium (from 0.8 mM
to 1.8 or 2.8 mM Mg
2+
), we could (transiently) reduce the
intensity of spontaneous bursting. Since bursts could still
be evoked by stimulation, we hoped that under these con-
ditions mild potentiation, normally masked by high burst
rates, might be revealed. This turned out not to be the
case. In summary, our induction sequences failed to have
an effect on subsequent spontaneous bursting, by the
metrics used here.
No successful protocols in Series II
In Series II, stimulation-site-specific differences between
pre- and posttetanic probing were observed in several pro-
tocols. Indeed, our Figure 4A bears a striking resemblance
to Figure 2 in [26]. However, our observed stimulation-
site-specific differences could not be attributed to the
tetanization, since stimulation-site-specific differences of
equal magnitude were seen between recording periods
without tetanization between them. Instead, we found
that the stochastic nature of the occurrence of evoked
bursts was responsible for these differences: the occur-
rence or non-occurrence of a single burst after any one
particular stimulus could give rise to differences in spike
counts sufficient to explain the apparent stimulation-site-
specific potentiation or depotentiation. Whether this non-
plastic stochastic effect played a role in the effects reported
in [26] can not be ascertained, since in that report the pre-
tetanic period was not broken up into a control and a
baseline period, and so no tests were performed to see
whether differences in maps could occur without tetaniza-
tion. Even so, it is, unlikely that it was solely responsible,
since in [26] the observed changes depended on the cor-
relation between the responses to test stimuli and the
responses to stimulation of the tetanized electrode, while
we saw no such dependence.
Conclusion
Why did our rigorously controlled experiments fail to
reveal previously reported plasticity effects (see Table 1)?
One possibility is that subtle differences in culturing con-
ditions (see Table 5) made our cultures less amenable to
inducing plasticity. Certainly, substantial differences
existed even between different plating batches created
within our lab [30]. However, our results are based on 112
experiments on 18 cultures from 4 dissections, so it is
unlikely that we simply had an unlucky pick. Another is
that previous experiments insufficiently controlled for
drift; in most protocols, we found that changes between
baseline recordings and post – induction sequence were
significantly larger than trial-to-trial variability (suggest-
ing that plasticity occurred), but comparison with control
intervals always revealed that changes of similar magni-
tude had also occurred spontaneously (i.e., between con-
trol and baseline periods, in the absence of induction
Journal of Negative Results in BioMedicine 2006, 5:16 />Page 16 of 19
(page number not for citation purposes)
sequences). Thus, the causation of changes could not be
attributed to the induction sequence.
We are left to conclude that inducing plasticity by extracel-
lular electrical stimulation in dense dissociated cortical
cultures is not as straightforward as it is in brain slices
[20]. There are several possible explanations why this
might be so. It could be that cultures burst too much,
causing plastic change to be reversed quickly [36]. Alter-
natively, it could be that synapses tend to be already satu-
rated in culture, perhaps as a result of the thousands of
bursts that the cultures had experienced before these
experiments took place [37]. A third possible explanation
is that neurons in culture lack critical neuromodulatory
input during development. We are presently pursuing the
possibility, suggested by the main positive result in this
paper, that burst quieting by distributed electrical stimu-
lation [29] may reveal plasticity effects that otherwise can-
not be observed – either because they are buried in drift,
or because they do not last long enough [38], or because
they do not occur at all.
We hope that this detailed presentation of (mostly) nega-
tive results will help make it easier to discuss in print how
difficult it is to induce plasticity in cultured networks
using extracellular electrodes. Such discussions may reveal
the crucial variables that reproducibly permit induction of
plasticity with MEAs. That will allow this accessible model
system to be more relevant to in vivo mechanisms of
learning and memory.
Methods
Cell culture
Cultures were prepared and maintained as before [30].
Briefly, cortical cells – neurons and glia in natural propor-
tions – were obtained from E18 rat embryos, and 50,000
cells in a 20
μ
L drop were plated over the center of MEAs
(MultiChannel Systems, Reutlingen, Germany). This
resulted in monolayer cultures of 5 mm diameter – three
times larger than the diameter of the electrode array – with
a density of about 2,500 cells/mm
2
after one day in vitro
(div). Cultures were sealed with Teflon membranes [6],
and maintained at 35°C, 5% CO
2
, and 9% O
2
, in a serum-
containing DMEM-based medium adapted from [26].
Experiments were performed after 10–32 div, in the same
incubator in which cultures were maintained.
Delivery of chemicals
To deliver chemicals (obtained from Sigma) to a culture,
we used a stock solution of at least 20× concentration in
DMEM (Irvine Scientific) and added drops of at most 50
μ
L directly to the 1 mL of culture medium present in the
MEA dish, to avoid any transients due to medium
exchange. To ensure equal distribution of the applied sub-
stance through the entire medium, 0.5 mL of medium was
taken out near the spot where the drop was added, and
gently returned on the opposite side of the dish. This tech-
nique was verified by applying a small drop of strong acid
to a culture dish with pH-indicator medium. After mixing
in the manner described, the color of the medium became
a uniform orange.
Electrical recording and stimulation
Multielectrode arrays with 59 electrodes were used for
both recording and stimulation. Recorded signals were
bandpass filtered (10 Hz–5 kHz), amplified, and digitized
using an MEA1060 preamplifier and MC_Card data acqui-
sition board (both from Multichannel Systems). Software
signal processing, including artifact suppression and spike
detection, was performed online using our open-source
Table 5: Overview of culturing and recording conditions used by other researchers. The following is a synopsis of conditions reported
in the Methods section of the papers listed in Table 1.
Ion concentrations (mM)
Ref. T (°C) Perfusion? pH Age at time of Expts. Culture
Medium
Ca
2+
Mg
2+
K
+
Osmolarity
(mOsm)
Plating Density
(/mm
2
)
Observed
Density (/mm
2
)
Type of
Stim.
[24] 20 Y 7.2 1–6 w DMEM-5/5 1 0–2 2.8 330–334 10, 000 - V
[25] - - 7.2 1–5 w DMEM-5/5 1 1–10 2.8 336–354 - - V
[26] - - - 30–50 d DMEM-5/5 - - - - - 120 V
[27] - Y 7.2 40–50 d DMEM-5/5 2 1 2.8 334 - 175 V
[3] 37 - - 3 w MEM-5HS - - - - - 300 I
[5] 37 - - 3 w–3 m MEM-5FBS 1.8 0.8 5.4 330 8000 - V
This paper 35 N 7.2 10–32 d DMEM-
10HS
1.8 0.8 5.4 330 2700 2500 V
Notes: Parameters not explicitly mentioned in a paper are represented as '-' in the table. DMEM-5/5 refers to Dulbecco's Modified Eagle's Medium
with 5% Fetal Bovine Serum and 5% Horse Serum. MEM-5HS is probably Modified Eagle's Medium with 5% Horse Serum, but the abbreviation
'MEM' is not explained in [3]. MEM-5FBS is Modified Eagle's Medium with 5% Fetal Bovine Serum, and DMEM-10HS is Dulbecco's Modified Eagle's
Medium with 10% Horse Serum. "Plating Density" is the cell density at time of plating reported in the paper, while "Observed Density" is the density
we counted in photographs in the paper or a reference in its Methods section to an earlier paper by the same authors. "Type of Stim." indicated
whether the stimuli used were defined in terms of voltage (V) or of current (I).
Journal of Negative Results in BioMedicine 2006, 5:16 />Page 17 of 19
(page number not for citation purposes)
software MeaBench [39]. Further analysis was performed
using custom Matlab code (MathWorks, Natick, MA,
USA).
Voltage-controlled stimuli were delivered using our cus-
tom multi-site stimulator [40]. All pulses were biphasic,
400
μ
s per phase, positive first, as optimized in [33]. Care
was taken to limit voltages to less than 1 V, to avoid elec-
trochemically damaging cells or electrodes. All 59 elec-
trodes in the array could be used for stimulation, but due
to a broken wire in one pre-amplifier channel, only 58
could be used for recording. Stimulation artifacts were
commonly observed on several electrodes, but could be
adequately suppressed in software using SALPA [41], and
spike detection was possible on all but the stimulated
electrode within 2 ms post-stimulus. (The stimulated elec-
trode could again be used for recording 50 ms later.)
Electrical burst quieting
In several protocols, culture-wide spontaneous bursting
was suppressed using distributed electrical stimulation
[29]. Twenty to forty electrodes that evoked responses in
pre-experimental probing were arbitrarily selected, and
stimuli were delivered to each of them in cyclic order, with
an inter-stimulus interval of 20 ms, so each electrode was
stimulated 1.25–2.5 times per second. This resulted in a
complete but reversible cessation of spontaneous burst-
ing.
Choice of electrodes
Effective stimulation requires good contact between the
stimulated electrode and the culture: if a pulse cannot
elicit a response, it is unlikely that it will induce plasticity.
Therefore, all experiments began with probing each elec-
trode in the array with pulses of several voltages: each elec-
trode was stimulated 27 times at 100–900 mV; the
sequence was fully randomized; inter-stimulus intervals
were 0.3 s. Electrodes with strong contact with the culture
should elicit a graded response: with increasing voltage,
more and more cells should be recruited [33]. For induc-
tion of plasticity, electrodes were chosen that (1) clearly
showed this effect, and (2) which could be used to
increase the array-wide spike detection rate (ASDR) to at
least twice the baseline level, using pulses no larger than
900 mV. In all cultures, many electrodes fulfilled these
requirements (10–50). When multiple experiments were
performed on a single culture, we selected electrodes from
different regions of the array for each new experiment, to
maximize independence between experiments.
Reducing probe pulse amplitudes in order to attempt to
avoid evoking bursts
In protocol II.4 we attempted to reduce the likelihood
that probe pulses evoked bursts, as follows. Before each
experiment, each electrode in the array was probed at 19
voltages between 40 and 580 mV. Stimuli were presented
in random order at 3 s intervals. For each electrode, the
lowest voltage that ever evoked a burst was determined,
and the amplitude of test pulses used in the main experi-
ment was set to two thirds of this voltage. Unfortunately,
it transpired that in the absence of stronger stimuli many
of these relatively weak stimuli could still evoke bursts.
This rendered the reduction of stimulation voltages futile
(though harmless). Importantly, it does not imply that
plasticity was induced. Instead, it can likely be understood
as follows. If stimuli are presented at a rate faster than the
spontaneous burst rate of the culture, only some of the
stimuli will trigger bursts, due to burst refractoriness. If
the stimulation is a mixture of strong and weak pulses,
most bursts will be entrained to the strong pulses, because
a strong pulse will more easily evoke a burst during the
relative refractory period following a previous burst. Thus,
weak pulses never have a chance to evoke bursts. When
there are no strong pulses, the network is never made
refractory to the weaker pulses, which may thus get their
chance to evoke bursts. This mechanism makes the
entrainment of bursts context-dependent, but does not
imply plasticity in the sense used by most researchers of
long-term synaptic plasticity.
Statistics
For all comparisons between spontaneous and putatively
induced changes, data were pooled from all experiments
in which a given protocol was used, and paired t-tests were
used to assess significance. In Series III, differences
between effects on responses to S
1
, S
2
, and the control
electrodes were tested using unpaired t-tests. Note that in
Figure 3A and 3B error bars were based on the assumption
that burst generation is approximately Poisson in nature.
In practice, bursting is likely more regular, so our error
bars are probably overestimated. Importantly, for the tests
in Figure 3C and 3D, the nature of the burst generation
process is not important, so whether or not it is Poisson
does not affect our final conclusions.
Abbreviations
ASDR = array-wide spike detection rate
base = baseline
ctrl = control
div = days in vitro
ind = induction
MEA = multielectrode array
rec = recording-site specific
Journal of Negative Results in BioMedicine 2006, 5:16 />Page 18 of 19
(page number not for citation purposes)
post = post-induction
SALPA = Suppression of Artifacts by Local Polynomial
Approximation[41]
spont = spontaneous
stim = stimulation-site specific
Competing interests
The author(s) declare that they have no competing inter-
ests.
Authors' contributions
DAW collected all data, performed the analysis, and pre-
pared text and figures for the manuscript. JP and SMP con-
tributed to the design of the study and to the preparation
of the manuscript.
Acknowledgements
We thank our lab technician, Sheri McKinney. This work was partially sup-
ported by NINDS grants NS38628 (to SMP) and NS44134 (to JP), by NIBIB
grant EB00786 (to SMP), by the Whitaker Foundation, and the Center for
Behavioral Neuroscience.
References
1. Martinoia S, Bove M, Carlini G, Ciccarelli C, Grattarola M, Storment
C, Kovacs G: A general-purpose system for long-term record-
ing from a microelectrode array coupled to excitable cells. J
Neurosci Methods 1993, 48:115-121.
2. Potter SM: Distributed processing in cultured neuronal net-
works. Progress in Brain Research, Elsevier Science 2001, 130:49-62.
3. Shahaf G, Marom S: Learning in networks of cortical neurons. J
Neurosci 2001, 21(22):8782-8788.
4. Morin FO, Takamura Y, Tamiya E: Investigating neuronal activity
with planar microelectrode arrays: achievements and new
perspectives. J Biosci Bioeng 2005, 100:131-143.
5. Ruaro ME, Bonifazi P, Torre V: Toward the neurocomputer:
Image processing and pattern recognition with neuronal cul-
tures. IEEE Trans Biomed Eng 2005, 52(3):371-383.
6. Potter SM, DeMarse TB: A new approach to neural cell culture
for long-term studies. J Neurosci Methods 2001, 110(l-2):17-24.
7. Van Pelt J, Corner MA, Wolters PS, Rutten WLC, Ramakers GJA:
Long-term stability and developmental changes in spontane-
ous network burst firing patterns in dissociated rat cerebral
cortex cell cultures on multielectrode arrays. Neurosci Lett
2004, 361(l-3):86-89.
8. Van Pelt J, Wolters PS, Corner MA, Rutten WLC, Ramakers GJA:
Long-term characterization of firing dynamics of spontane-
ous bursts in cultured neural networks. IEEE Trans Biomed Eng
2004, 51(11):2051-2062.
9. Potter SM: Two-photon microscopy for 4D imaging of living
neurons. In Imaging in Neuroscience and Development: A Laboratory
Manual Edited by: Yuste R, Konnerth A. Cold Spring Harbor Labora-
tory Press; 2005:59-70.
10. Trachtenberg JT, Chen BE, Knott GW, Feng GP, Sanes JR, Welker E,
Svoboda K: Long-term in vivo imaging of experience-depend-
ent synaptic plasticity in adult cortex. Nature 2002,
420(6917):788-794.
11. DeMarse TB, Wagenaar DA, Blau AW, Potter SM: The neurally
controlled animat: Biological brains acting with simulated
bodies. Auton Robot
2001, 11:305-310.
12. Bakkum DJ, Shkolnik AC, Ben-Ary G, Gamblen P, DeMarse TB, Pot-
ter SM: Removing some 'A' from AI: Embodied cultured net-
works. In Embodied Artificial Intelligence Edited by: Iida F, Steels L,
Pfeifer R. Springer-Verlag; 2004:130-145.
13. Potter SM, Wagenaar DA, DeMarse TB: Closing the Loop: Stim-
ulation Feedback Systems for Embodied MEA Cultures. In
Advances in network electrophysiology: Using multi-electrode arrays Edited
by: M Taketani MB. New York: Springer; 2006:215-242.
14. Buonomano DV, Merzenich MM: Cortical plasticity: From syn-
apses to maps. Annu Rev Neurosci 1998, 21:149-186.
15. Poirazi P, Mel BW: Impact of active dendrites and structural
plasticity on the memory capacity of neural tissue. Neuron
2001, 29(3):779-796.
16. Malinow R, Malenka RC: AMPA receptor trafficking and synap-
tic plasticity. Annu Rev Neurosci 2002, 25:103-126.
17. Bi GQ, Poo MM: Synaptic modifications in cultured hippocam-
pal neurons: Dependence on spike timing, synaptic strength,
and postsynaptic cell type. J Neurosci 1998, 18(24):10464-10472.
18. Bi GQ, Poo MM: Synaptic modification by correlated activity:
Hebb's postulate revisited. Annu Rev Neurosci 2001, 24:139-166.
19. Fu YX, Djupsund K, Gao HF, Hayden B, Shen K, Dan Y: Temporal
specificity in the cortical plasticity of visual space represen-
tation. Science 2002, 296(5575):1999-2003.
20. Dan Y, Poo MM: Spike timing-dependent plasticity: From syn-
apse to perception. Physiol Rev 2006, 86(3):1033-1048.
21. Bliss TVP, Lomo T: Long-lasting potentiation of synaptic trans-
mission in dentate area of anesthetized rabbit following
stimulation of perforant path. J Physiol-London 1973,
232(2):331-356.
22. Bramham CR, Srebro B: Induction of long-term depression and
potentiation by low- and high-frequency stimulation in the
dentate area of the anesthetized rat: Magnitude, time
course and EEG. Brain Res 1987, 405:100-107.
23. Siegelbaum SA, Kandel E: Learning-related synptic plasticity:
LTP and LTD.
Curr Opin Neurobiol 1991, 1:113-120.
24. Maeda E, Kuroda Y, Robinson HPC, Kawana A: Modification of
parallel activity elicited by propagating bursts in developing
networks of rat cortical neurones. Eur J Neurosci 1998,
10:488-496.
25. Jimbo Y, Robinson HPC, Kawana A: Strengthening of synchro-
nized activity by tetanic stimulation in cortical cultures:
Application of planar electrode arrays. IEEE Trans Biomed Eng
1998, 45(11):1297-1304.
26. Jimbo Y, Tateno T, Robinson HPC: Simultaneous induction of
pathway-specific potentiation and depression in networks of
cortical neurons. Biophys J 1999, 76(2):670-678.
27. Tateno T, Jimbo Y: Activity-dependent enhancement in the
reliability of correlated spike timings in cultured cortical
neurons. Biol Cybern 1999, 80:45-55.
28. Van Staveren GW, Buitenweg JR, Marani E, Rutten WLC: The effect
of training of cultured neuronal networks, can they learn?
Proc 2nd Intl IEEE EMBS Conf on Neural Eng 2005:328-331.
29. Wagenaar DA, Madhavan R, Pine J, Potter SM: Controlling burst-
ing in cortical cultures with closed-loop multi-electrode
stimulation. J Neurosci 2005, 25(3):680-688.
30. Wagenaar DA, Pine J, Potter SM: An extremely rich repertoire
of bursting patterns during the development of cortical cul-
tures. BMC Neurosci 2006, 7:11.
31. Maeda E, Robinson HPC, Kawana A: The mechanisms of genera-
tion and propagation of synchronized bursting in developing
networks of cortical neurons. J Neurosci 1995,
15(10):6834-6845.
32. Gross GW, Kowalski JM: Origins of activity patterns in self-
organizing neuronal networks in vitro. J Intell Mater Syst Struct
1999, 10(7):558-564.
33. Wagenaar DA, Pine J, Potter SM: Effective parameters for stim-
ulation of dissociated cultures using multi-electrode arrays.
J Neurosci Methods 2004, 138(1–2):27-37.
34. Eytan D, Brenner N, Marom S:
Selective adaptation in networks
of cortical neurons. J Neurosci 2003, 23(28):9349-9356.
35. Markram H, Lubke J, Frotscher M, Sakmann B: Regulation of syn-
aptic efficacy by coincidence of postsynaptic APs and EPSPs.
Science 1997, 275(5297):213-215.
36. Zhou Q, Poo MM: Reversal and consolidation of activity-
induced synaptic modifications. Trends Neurosci 2004,
27(7):378-383.
37. Corner MA, Van Pelt J, Wolters PS, Baker RE, Nuytinck RH: Physio-
logical effects of sustained blockade of excitatory synaptic
transmission on spontaneously active developing neuronal
networks – an inquiry into the reciprocal linkage between
Publish with BioMed Central and every
scientist can read your work free of charge
"BioMed Central will be the most significant development for
disseminating the results of biomedical research in our lifetime."
Sir Paul Nurse, Cancer Research UK
Your research papers will be:
available free of charge to the entire biomedical community
peer reviewed and published immediately upon acceptance
cited in PubMed and archived on PubMed Central
yours — you keep the copyright
Submit your manuscript here:
/>BioMedcentral
Journal of Negative Results in BioMedicine 2006, 5:16 />Page 19 of 19
(page number not for citation purposes)
intrinsic biorhythms and neuroplasticity in early ontogeny.
Neurosci Biobehav Rev 2002, 26(2):127-185.
38. Chao ZC, Bakkum DJ, Wagenaar DA, Potter SM: Effects of random
external background stimulation on network synaptic stabil-
ity after tetanization – A modeling study. Neuroinformatics
2005, 3(3):263-280.
39. Wagenaar DA, DeMarse TB, Potter SM: MEABench: A toolset for
multi-electrode data acquisition and on-line analysis. Proc 2nd
Intl IEEE EMBS Conf on Neural Eng 2005:518-521.
40. Wagenaar DA, Potter SM: A versatile all-channel stimulator for
electrode arrays, with real-time control. J Neural Eng 2004,
1:39-44.
41. Wagenaar DA, Potter SM: Real-time multi-channel stimulus
artifact suppression by local curve fitting. J Neurosci Methods
2002, 120(2):113-120.