Báo cáo khoa hoc:" Fall risk in an active elderly population – can it be assessed?" potx
Bạn đang xem bản rút gọn của tài liệu. Xem và tải ngay bản đầy đủ của tài liệu tại đây (320.4 KB, 11 trang )
BioMed Central
Page 1 of 11
(page number not for citation purposes)
Journal of Negative Results in
BioMedicine
Open Access
Research
Fall risk in an active elderly population – can it be assessed?
Uffe Laessoe*
1
, HansCHoeck
†2
, Ole Simonsen
†3
, Thomas Sinkjaer
†1
and
Michael Voigt
†1
Address:
1
Center for Sensory-Motor Interaction (SMI), Aalborg University, Fredrik Bajers vej, Aalborg, Denmark,
2
Center for Clinical and Basic
Research, Hobrovej, Aalborg, Denmark and
3
Northern Orthopedic Division Aalborg Hospital, part of Aarhus University Hospital, Hobrovej,
Aalborg, Denmark
Email: Uffe Laessoe* - ; Hans C Hoeck - ; Ole Simonsen - ; Thomas Sinkjaer - ;
Michael Voigt -
* Corresponding author †Equal contributors
Abstract
Background: Falls amongst elderly people are often associated with fractures. Training of balance and
physical performance can reduce fall risk; however, it remains a challenge to identify individuals at increased
risk of falling to whom this training should be offered. It is believed that fall risk can be assessed by testing
balance performance. In this study a test battery of physiological parameters related to balance and falls was
designed to address fall risk in a community dwelling elderly population.
Results: Ninety-four elderly males and females between 70 and 80 years of age were included in a one
year follow-up study. A fall incidence of 15% was reported. The test battery scores were not different
between the fallers and non-fallers. Test scores were, however, related to self-reported health. In spite of
inclusion of dynamic tests, the test battery had low fall prediction rates, with a sensitivity and specificity of
50% and 43% respectively.
Conclusion: Individuals with poor balance were identified but falls were not predicted by this test battery.
Physiological balance characteristics can apparently not be used in isolation as adequate indicators of fall
risk in this population of community dwelling elderly. Falling is a complex phenomenon of multifactorial
origin. The crucial factor in relation to fall risk is the redundancy of balance capacity against the balance
demands of the individuals levels of fall-risky lifestyle and behavior. This calls for an approach to fall risk
assessment in which the physiological performance is evaluated in relation to the activity profile of the
individual.
Background
Amongst elderly people bone fractures in relation to falls
are a frequent phenomenon. These accidents are often
associated with physical decline, negative impact on qual-
ity of life and reduced survival [1]. Fall risk has been
related to a number of factors such as history of falls, mus-
cle weakness, gait deficit, balance deficit, use of assistive
device, visual impairment, mobility impairment, fear of
falling, cognitive impairment, depression, sedentary
behavior, age, number of medications, psychotropic/car-
diovascular medications, nutritional deficits, urinary
incontinence, arthritis, home hazards and footwear [2,3].
The natural ageing process combined with inactivity can
gradually lead to decreased physical performance with the
result that many elderly are at increased risk of falling [4].
Several studies have found that interventions can reduce
the fall rate in an elderly population [5]. Different inter-
Published: 26 January 2007
Journal of Negative Results in BioMedicine 2007, 6:2 doi:10.1186/1477-5751-6-2
Received: 11 May 2006
Accepted: 26 January 2007
This article is available from: />© 2007 Laessoe et al; licensee BioMed Central Ltd.
This is an Open Access article distributed under the terms of the Creative Commons Attribution License ( />),
which permits unrestricted use, distribution, and reproduction in any medium, provided the original work is properly cited.
Journal of Negative Results in BioMedicine 2007, 6:2 />Page 2 of 11
(page number not for citation purposes)
ventions have been suggested ranging from initiatives to
ensure a safer environment to specific methods of training
of the individual [6-9]. Part of the deterioration in physi-
ological capacity seems to be due to a lack of stimulation
and training and this can be addressed by exercise. Exer-
cises comprising balance training and strength training
have proven the most effective in relation to reduction in
fall incidence [8].
The very old and fragile elderly have an increased risk of
falling and it has been suggested that all people over 80
years of age should be offered exercise training regardless
of risk factor status [10]. In line with this it is relevant to
focus on the group of elderly under 80 years of age to
identify the individuals in this group who would need
balance training. In the current study it was decided to
include community-dwelling elderly aged 70 to 80 years.
The identification of individuals at risk of falling is not a
trivial matter. Many different physiological performance
tests are believed to be sensitive to fall risk. Several
research groups have investigated combinations of tests to
produce test batteries addressing fall risk in the elderly
[11-13]. The reported prediction rates vary a great deal
according to the characteristics of the elderly populations
included in the different studies.
The present study covers a generally active population of
elderly. Within this group it is believed that fall risk assess-
ment should include dynamic and attention demanding
balance tests [14,15]. It has been shown that increased
gait variability relates to fall risk [16]. If gait is solely exe-
cuted in relation to sensory feed-back, each step will
include a great deal of balance adjustment and this will
lead to an uneven gait pattern. Stable gait calls for motor
planning in order to allow a feed-forward strategy that
adjusts the next step in an appropriate way [17]. This
means that stable gait requires a proactive dynamic pos-
tural control and orientation in space. An assessment of
gait is therefore relevant in this context. The vision provid-
ing the information for postural planning must naturally
also be tested [18]. A dual task testing approach, has been
proposed to reveal early signs of insufficient postural con-
trol [19]. In a dual task situation the subject must perform
a cognitive task in parallel to a motor task. This occurs fre-
quently in daily life situations and poor dual task per-
formance seems to be related to fall risk [20]. A test battery
evaluating fall risk in a population of active elderly should
therefore include these aspects in the tests. Muscle
strength is a strong predictor of fall and a test of muscle
strength must be relevant in such a test battery along with
some sort of test of general physical function [2,21].
Assessments of the ability to maintain a standing position
by equilibrium reactions and the ability to make base of
support reactions are relevant as indicators of basic bal-
ance aspects [22-24]. Nine specific tests, including
dynamic tests, were selected for the test battery in order to
cover these different aspects of physical performance
which could be related to fall risk.
The purpose of the current study was to develop a tool to
identify community dwelling elderly individuals in risk of
falling. The study should evaluate the capability of a new
test battery to predict fall incidence in an active elderly
population between 70 and 80 years of age.
Results
The study population of elderly had a mean age of 73.7
years (sd. 2.9) and the proportion of males was 26%. Fif-
teen percent of this population experienced at least one
fall during the one-year follow-up period. The groups of
fallers and non-fallers were not significantly different
regarding age and measures of self estimated health, phys-
ical activity level and balance confidence (table 1). There
were relatively more males in the non-fallers group (14%
versus 27%) and more individuals reported non-balance-
related illness and balance-related illness in the fallers
group (43% versus 29% and 55% versus 20%). None of
these differences were statistically significant.
The test raw scores for fallers and non-fallers are presented
in table 2. In only one of these individual tests of the test
battery, a statistically significant difference was found
between fallers and non-fallers. This regarded test no.1 on
"balance in standing position", (p < 0.05).
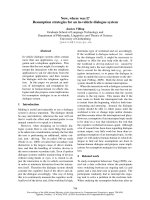
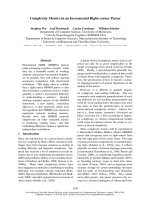
To evaluate the common product of the tests as a test bat-
tery, the scores were converted into 0–10 scales with
higher values indicating better performance. The con-
verted scores of the tests are seen in figure 1. It can be seen,
Table 1: Group characteristics of fallers and non-fallers
Fallers (n = 14) Non-fallers (n = 80)
Age 73.0 (2.9) 73.8 (2.9)
BMI
a
26.8 (3.2) 27.3 (4.7)
Health
b
4.4 (0.7) 4.3 (0.5)
PASE
c
125 (55) 126 (48)
ABC
d
91 (8) 90 (13)
a
Body Mass Index;
b
Self estimated health on a scale from 1–5, with 1 being very bad and 5 being very good;
c
Physical Activity-based Scale for the
Elderly;
d
Activity-specific Balance Confidence Scale. Values are mean and standard deviation ().
Journal of Negative Results in BioMedicine 2007, 6:2 />Page 3 of 11
(page number not for citation purposes)
Table 2: Test scores for fallers and non-fallers
Test focus Outcome Fallers Non-fallers
1 Standing balance Performance scale (0–6)
a
4.5 (3–5) 5.0 (2–5.5)
2 Stepping ability Time required (s) 9.8 (1.3) 9.8 (3.2)
3 General function Time required (s) 8.8 (2.2) 8.8 (1.9)
4 Reaction time Averaged time to step (s) 0.82 (0.14) 0.89 (0.21)
5 General leg strength Time required (s) 23.9 (7.6) 24.5 (9.1)
6 Dual task Speed reduction (%) 35 (30) 30 (27)
7 Gait variability Autocorrelation (no unit) 0.85 (0.05) 0.84 (0.06)
8 Gait cadence Steps per second 1.7 (0.1) 1.7 (0.1)
9 Vision Acuity/contrast/field (0–7)
a
5 (4–7) 6 (2–7)
Test scores of the nine tests of the test battery presented by mean and standard deviation () or
a
median and range ().
Test scores from the nine tests in the test batteryFigure 1
Test scores from the nine tests in the test battery. Mean scores and standard deviations are presented in normalized
units on a 0–10 scale with higher values indicating better performance. Test numbers are referring to: 1) Standing balance, 2)
Stepping ability, 3) General physical function, 4) Reaction timer, 5) Leg strength, 6) Dual task, 7) Gait variability, 8) Gait
cadence, 9) Vision.
Test number
123456789
Test score (normalized units) (sd)
0
4
5
6
7
8
9
10
non fallers
fallers
Journal of Negative Results in BioMedicine 2007, 6:2 />Page 4 of 11
(page number not for citation purposes)
that the group of fallers actually had a higher mean score
than the non-fallers in some of the tests.
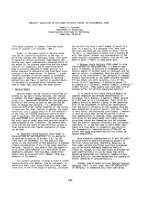
For each subject the test scores were averaged into a test
battery score. No statistically significant difference
between fallers and non-fallers was seen. The score was
6.8 (0.6) for the fallers and 6.8 (0.7) for the non-fallers
(figure 2).
When choosing 0.5 (5%) to be the least clinical relevant
difference in the test battery score, the power of the study
was 85.4%. At a power of 80% the equivalent least statis-
tically significant difference in test battery score was 0.46.
In a logistic regression the tests showed no predictive
capability in relation to fall incidence. Neither did the
combination of the tests as a test battery predict who fell
in the one-year follow-up period (OR = 0.98; p = 0.97).
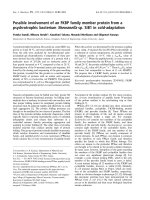
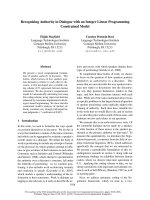
No clear cut-off point could be suggested for the test bat-
tery score in relation to falls (figure 3). An optimal fall pre-
diction was obtained by a cut-off value of 6.9 producing a
sensitivity of 50% and a specificity of 43%. The corre-
sponding positive and negative prediction rates were 13%
and 83% respectively.
Alternative measures
Test battery scores correlated significantly, with low corre-
lation values, to the scores in questionnaires on self esti-
mated health, activity level and balance confidence. The
Spearman's correlation values were 0.33, 0.44 and 0.37
respectively (p < 0.001).
Self reported illness was grouped into three categories
according to the influence on balance and gait: no illness
(n = 24), illness which was not regarded to be balance
related (n = 50) and balance related illness (n = 20). The
distribution of reported balance-related illness was not
significantly different between fallers and non-fallers (p =
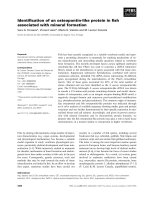
0.67). When the elderly population was divided into three
groups according to balance-related illness statistically
significant differences were found in test battery scores
between the "balance-related illness" group and the two
other groups, but not between the "no illness" and the
"no balance-related illness" groups (figure 4).
Discussion
The population included in this study had a fall incidence
of 15%, which must be regarded as a low percentage for
this age group. It has previously been reported, that the
proportion of community-dwelling elderly sustaining at
least one fall over a one-year period varies from 28 – 35%
in the +65-year age group to 32 – 42% in the +75-year age
group [25]. Four subjects reported recurrent falls. Recur-
rent falls are even more indicative of balance related fall
risk, but this incidence was too small to be evaluated. The
subjects were contacted at half year intervals and this
Test battery scores for fallers and non-fallersFigure 2
Test battery scores for fallers and non-fallers. Mean
test battery scores with 95% confidence intervals are given in
normalized units on a 0–10 scale with higher values indicating
better performance. No significant difference was found
between faller and non-faller group.
Test score (normalized units) (95% CI)
0.00
6.50
6.75
7.00
Non-faller Faller
Receiver operating curveFigure 3
Receiver operating curve. A ROC curve is a plot of the
true positive rate against the false positive rate for the differ-
ent possible cutoff points of the test battery. In this way the
trade off between sensitivity and specificity is illustrated and
an optimal cut-off value can be suggested. An ideal curve
reflecting high sensitivity and high specificity would be posi-
tioned towards the left and the upper border with an area
under the curve approaching 100%. The presented curve
shows no tendency to perform this way.
1.00.80.60.40.20.0
1 - Specificity
1.0
0.8
0.6
0.4
0.2
0.0
Sensitivity
ROC Curve
Journal of Negative Results in BioMedicine 2007, 6:2 />Page 5 of 11
(page number not for citation purposes)
might have introduced a recall bias. If the subject failed to
recall a fall event in the preceding six month an underre-
porting of fall incidence would occur. During the inter-
views however we experienced no indications of recall
problems. These elderly were cognitively well functioning
and a fall accident seemed to be an event which was easily
remembered. The low fall incidence is likely to be a natu-
ral consequence of the selection of the study population.
The community-dwelling elderly attending activities at
elderly centres might belong to a relatively healthier group
of elderly. The fall risk prediction is probably more chal-
lenging but not less relevant in this population.
In spite of the low fall incidence the power of the study
was strong and would have revealed a clinically relevant
difference of 0.5 in test battery score between the two
groups. It is, however, always an open choice to decide
when a difference is clinical relevant. In this population
the test score had a standard deviation of 0.7. A difference
of 0.5 (equivalent to 5% on the 0–10 scale) was therefore
regarded as a relevant but also very demanding limit of
clinical relevance. In respect to this level of difference the
study produced a power of 85%. For a conventional
choice of a power of 80% a significant decrease in score
for the fallers should have been 0.46 on the 0–10 scale.
In relation to the testing session the participants were also
interviewed about health problems. This was mainly done
for an in- or exclusion purpose, but it also provided the
possibility to group the included participants into three
categories in relation to health. It was seen that balance-
related illness did not relate to fall incidence, but it did
relate significantly to the test battery score (figure 4). This
indicated the test battery did in fact reflect the physiolog-
ical status of the participants.
When comparing the group of fallers with non-fallers, no
statistically significant difference was seen in fall related
physiological performance and balance as scored by the
test battery. This naturally implicated a poor capability of
the test battery to predict falls. Despite the fact that the
individual tests in the test battery all addressed physiolog-
ical parameters, which had previously been shown to
relate to fall risk, these tests performed poorly as fall pre-
dictors in this population of elderly.
In a case control evaluation on a subset of this study pop-
ulation the same test battery produced better discrimina-
tion rates [26]. Two age-matched subgroups of 35 women
with and 36 women without a history of falling within the
previous two years were compared. Significant differences
could be found when comparing test battery scores
between these groups. The fallers had an average score of
6.5 (SD 0.9) on the normalized 0 – 10 scale whereas the
non-faller group scored 7.0 (SD 0.4). The difference of 0.5
was statistically significant (CI: 0.2 – 0.8) (p < 0.01). In
this analysis the test battery discriminated between fallers
and non-fallers with a sensitivity of 71% and a specificity
of 58%. When validating a test in a case-control study, the
inclusion of selected fallers as "cases" often produces
good discrimination rates. Unfortunately, this is not nec-
essarily the case when the same test is included in a cohort
study on community-dwelling elderly. This tendency has
also been seen in other studies on fall risk [11,27]. The
necessity for prospective studies must be underlined in
the evaluation of tests meant for prediction. In prospec-
tive studies however another risk of bias occurs. The eld-
erly will become aware of potential deficits in their
balance performance during the testing session, and this
information might influence their behaviour during the
follow-up period.
Fall risk factors
A major problem, when predicting fall risk, is the multi-
factorial mechanisms of falls. The influence of environ-
mental factors and the difficulty in daily tasks performed
have to be considered as well as the individual physiolog-
ical factors [28]. To be able to cope well in daily-life situ-
ations the balance demands in the environment and in
the tasks performed must be matched by the balance
capacity of the elderly. These reflections are illustrated in
figure 5. This figure shows the interaction between the
individual balance capacity and the challenges offered by
balance task and context. The interaction between these
Test scores related to self reported illnessFigure 4
Test scores related to self reported illness. Mean test
battery scores with 95% confidence intervals are given in
normalized units on a 0–10 scale with higher values indicating
better performance. The groups reporting illness had lower
scores in the test battery. Significant differences were found
between the "balance-related illness" group and the two
other groups. * (p < 0.01)
Test score (normalized units) (95% CI)
0.00
6.00
6.25
6.50
6.75
7.00
7.25
No illness No balance-related
illness
Balance-related
illness
*
Journal of Negative Results in BioMedicine 2007, 6:2 />Page 6 of 11
(page number not for citation purposes)
factors is related to a balance performance which is
reflected as an outcome on the performance scale. As an
example, when walking on an icy surface the increased
"weight" on the balance demand side will be reflected on
a "gait speed scale". Likewise it will be reflected in the per-
formance when illness or age decrease the "weight" on the
balance capacity side and this is outbalanced by the
demand of standing on one leg with eyes closed.
Very fragile persons or individuals with a poor postural
control might be very well aware of their balance lacking
status. They will probably try not to challenge themselves
beyond their limits and therefore, in spite of their low
physical capacity, they might not be in high risk of falling.
Other individuals, who are healthy, fit and displaying
good balance capacities, could live very active lives (out-
door walking in all kinds of weather, dancing and attend-
ing sporting activities etc.). From time to time these
persons might challenge themselves beyond their limits
and thereby be at increased risk of falling.
In telephone contacts during the follow-up period of this
study these factors were recognized. Non-fallers would
often explain that they were concerned about their per-
formance. For example, they would avoid challenging
their balance capacity by limiting gait speed or avoiding
inclement weather and subsequent fall risks. In contrast to
this, many of the fallers indicated that the fall had
occurred during fall risky conditions. This could be falls
playing soccer with the grandchildren, walking down an
icy path in the forest or when influenced by alcohol.
In this study, the test battery assessed fall risk by evaluat-
ing solely the physical capabilities of the individual but in
relation to fall risk the critical factor is, whether the bal-
ance capacity of the individual matches the individual
balance demands. In fact, Gregg et al. (1998) described a
U-shaped relationship between physical activity level and
fall incidence (i.e. colles fractures) amongst elderly (+65
years of age). This implied that both sedentary and very
active elderly were more at risk than average [29]. A redun-
dancy of balance capacity is necessary to face challenges at
the individual's relevant activity level. This redundancy
was apparently lacking amongst the sedentary elderly due
to poor performance and amongst the very active elderly
due to excessive challenges.
The test battery score correlated against self-estimated
health score, physical activity score and balance confi-
dence score. Although these findings were significant, it
should be noted that the correlations were not very high.
A low physical capacity is not necessarily reflected in low
physical activity level, low balance confidence or low
health estimation. In fact, the neglect of poor physical per-
formance level could lead to a relatively risky behaviour
which again might lead to a higher fall risk. In such a case,
it would be relevant to lead the individual to an awareness
of the lacking balance capacity. A problem with this
approach is, however, that it could also lead to anxiety
and inappropriate restrictions in the physical activity.
To avoid falling it is necessary to have the physiological
capacity to negotiate the threatening balance demands of
a given task and context. For natural reasons the physio-
logical capacity deteriorates gradually with age [30,31].
This makes it even more relevant to keep this capacity at
its peak in accordance with the age-related expected per-
formance. A classic way of illustrating this approach is
given in figure 6. It shows that the deterioration will lead
to a point, where the level of the physical requirements for
normal daily activity is crossed but it also shows that the
age corresponding to this crossing point is very much
influenced by the individual starting point and mainte-
nance of physical performance [32]. The figure also illus-
trates that the individual physical performance
requirements for daily activities not necessarily are set at a
fixed level.
Perspectives
In this study it was not possible to identify individuals at
increased fall risk amongst the active elderly between 70
and 80 years of age. In relation to fall prevention in this
group of elderly subjects, we believe that it is not relevant
Balance performance modelFigure 5
Balance performance model. This is a model to illustrate
the interaction between balance capacity and balance
demands. The interaction is reflected in an outcome which is
measured on a given scale. A redundancy of balance capacity
in relation to balance demands will ensure a good balance
performance. On the contrary can increased balance
demands or loss of balance capacity result in insufficient per-
formance
Insuffcient
Optimal
Individual
balance
capacity
Balance
demands
Performance scale
Journal of Negative Results in BioMedicine 2007, 6:2 />Page 7 of 11
(page number not for citation purposes)
to use general fall risk screening in order to target the bal-
ance training at selected individuals. This leads to the
pragmatic approach that all elderly should be offered
physical exercise to keep or restore the best possible
redundancy in balance capacity.
General programs maintaining/improving gait perform-
ance and balance would appear to be worthwhile. Exercise
must be regarded as a natural part of the daily life for the
elderly. This is seen in some Asian societies where "Tai
Chi" often is practiced as a daily routine also for the eld-
erly. In some countries "Nordic walking" (where special
sticks are used for walking) has become a popular way of
outdoor exercise amongst the elderly. Both the individual
and the society must take actions to facilitate physical
exercise but also manufacturers of exercise tools should
accept the challenge of developing equipment designed
especially for the elderly.
Elderly people experiencing the first signs of balance dete-
rioration might furthermore benefit from a clinical con-
sultation on possible needs for specific exercises and
adjustments of risky lifestyle to increase the balance
redundancy.
Future studies on fall risk face the challenge of addressing
both sides of the model illustrated in figure 5. The balance
demand as well as the balance capacity has to be evaluated
in order to estimate the balance redundancy. A less frag-
mented or dualistic approach which includes psychoso-
cial factors and interactions with the environment might
lead to new measuring scales for evaluating this redun-
dancy.
Conclusion
The physiological balance capacity can be addressed by
tests related to balance and fall risk. However, falling is a
complex phenomenon of a multi-factorial nature with
associations to a fall-risky lifestyle. In any given situation
redundancy in physiological capacity is crucial in order to
negotiate balance threatening demands.
The results from this study support the view that fall risk
cannot be predicted in a healthy and active elderly popu-
lation by solely assessing physical performance. This calls
for an approach to fall risk assessment in which the phys-
iological performance is evaluated in relation to the activ-
ity profile of the individual.
Methods
Population
The study was designed as a cohort study with a one year
follow-up period. It was conducted in a population of
community dwelling healthy elderly from 70 to 80 years
of age. The elderly were invited to participate in the study
by announcements at senior community centers and by
verbal contacts. A population of 101 elderly people was
tested with the test battery. Five of these elderly were
excluded due to the exclusion criteria. Two out of the 96
included participants were lost to follow-up because of
severe illness or death.
The elderly were excluded if they reported any of the fol-
lowing: a) major musculoskeletal disorder; b) significant
pain that limited daily functions; c) dependence on gait
auxiliaries; d) ear infection within two weeks prior to the
test; e) fall within one month prior to the test; f) depend-
ence on special care to stay in community; g) known
uncorrected visual or vestibular problems or h) cognitive
impairment (Mini Mental State Examination (MMSE) <
23) [33].
Informed consent was obtained from all participants prior
to inclusion in the study. The protocol was approved by
the Ethics Committee of Viborg and Nordjyllands Coun-
ties.
Procedures
The elderly were tested at local senior citizens community
centres. The participants were introduced to each test in
the test-battery by a demonstration following which they
were allowed to do a pre-trial test. The participants were
interviewed about age, height, weight, fall history and
health problems. In spite of the exclusion criteria seventy
of the elderly did suffer from diseases which were of
Illustration of physical capacity and ageFigure 6
Illustration of physical capacity and age. An illustration
of the normal deterioration of physical performance related
to age. A well trained individual (thick green line) might dete-
riorate in parallel with the untrained individual (dashed red
line) but they would cross the level at which they cannot face
the challenges of daily life at a very different time in their life.
Small arrows indicate that this level is individual.
Age
Physical
performance
Trained individuals
Untrained individuals
Requirement
level for daily
activities
Journal of Negative Results in BioMedicine 2007, 6:2 />Page 8 of 11
(page number not for citation purposes)
minor importance to their daily living or were well regu-
lated. These conditions were grouped into three categories
according to the influence on balance and gait: no illness,
illness which was not regarded to be balance related, and
balance related illness. A balance related illness would
include painful osteoarthritis in leg or lower back, foot
deformities, dizziness, smaller sequelae after stroke,
minor vascular disturbances in lower extremities, etc.
Endocrine diseases, asthma, diabetes, well regulated
hypertension and problems in the upper extremities were
not regarded as balance related illnesses.
Self estimated health was scored on a 1–5 scale, with 1
being "very bad" and 5 being "very good". Balance confi-
dence and fear of falling was scored using the Activity-spe-
cific Balance Confidence scale (ABC) [34]. The physical
activity level of the participants was assessed by using the
Physical Activity Scale for the Elderly (PASE) [35,36].
To record fall incidence, the subjects were given a fall diary
which they were encouraged to keep. They were contacted
and interviewed by phone after six and after twelve
months. In this context a fall was defined as: "an event
which results in a person coming to rest unintentionally
on the ground or other lower level, not as a result of a
major intrinsic event (such as stroke) or overwhelming
hazard"[37]
Test battery
Nine tests were selected for a test-battery to cover different
aspects of physical performance related to fall risk. The
tests ranged from specific tests of muscle strength to gen-
eral tests on performance in combined tasks (table 3). In
order to make the test-battery practical in a clinical setting,
the following criteria were set: each test should be clini-
cally applicable; total testing time should not exceed half
an hour; conduction of the tests should not require a sta-
tionary setting. The selected tests had all been described
and evaluated in scientific journals. In the following
description the specific purpose and the test procedures
are described for each of the nine individual tests.
1. Standing balance
A test procedure was chosen which was used in the FIC-
SIT-studies [24]. This procedure included the principles
from the "Guralnik test", which is commonly used in the
clinic [38]. This test addresses the participant's ability to
adjust balance in response to the feedback from proprio-
ceptors, vision and vestibular organs. Reducing the sup-
port area adds to the challenge of the test. The original
procedure was expanded to avoid a ceiling effect by add-
ing the task: "standing on one leg with eyes closed". The
participant was asked to stand for 10 seconds with the feet
in parallel, semi-tandem, and tandem position as well as
to stand on one leg with eyes open and with eyes closed.
Scores were given according to the ability to perform the
tasks: Parallel refused ≈ 0.0; Parallel < 10 s ≈ 0.5; Semi-tan-
dem < 10 s ≈ 1.5; Semi-tandem > 10 s and failed tandem
≈ 2.0; Tandem < 10 s ≈ 3.0; Tandem > 10 s, one leg < 10 s
≈ 4.0; One leg > 10 s ≈ 5.0; One leg eyes closed < 10 s ≈
5.5; One leg eyes close > 10 s ≈ 6.0. The 0–6 score was con-
verted into a 0–10 scale.
2. Stepping ability
A test procedure called "Four Square Step Test" (FSST) was
used for evaluating stepping ability [22]. During risky,
balance challenging situations, the base of support must
be altered by moving the feet to new positions. The ability
to make these quick balance reactions by stepping forth,
back and sideward is revealed by this test. Two sticks
(height 2.5 cm and length 80 cm) were placed on the floor
forming a cross. This cross indicated four squares (1, 2, 3,
4). The participants were asked to step as quickly as possi-
ble from one square to another in the order 1-2-3-4-3-2-1.
They were asked to touch the ground with both feet in
each square while facing in the same direction at all times.
After a pre-trial, the faster of two trials was used for evalu-
ation. A 0–30 s. score was used inversely for normaliza-
tion.
Table 3: Test battery
Test focus Method Form
1 Standing balance "FICSIT-4 scale" + one leg eyes closed [24] modified
2 Stepping ability "Four Square Step Test" (FSST) [22] original
3 General function "Timed Up and Go" (TUG) [21,39] original
4 Reaction time Step reaction on visual cue [23] modified
5 General leg strength "Timed Stand Test" (TST) [40] original
6 Dual task Gait speed decrease in a "dual task" [42] modified
7 Gait variability Trunk acceleration autocorrelation [43] modified
8 Gait cadence Step cadence at gait speed 1.1 m/s [43] modified
9 Vision Visual acuity, contrast and field [47] original
A listing of the nine tests selected for the test battery. The last column indicates whether the test was used in an original or a modified form.
Detailed descriptions of the test procedures are provided in the method section.
Journal of Negative Results in BioMedicine 2007, 6:2 />Page 9 of 11
(page number not for citation purposes)
3. General physical function
"Timed Up and Go" test (TUG) is a widely used and a val-
idated test for general physical performance in the elderly
[21,39]. In this test the participant sat on a chair (height ≈
46 cm.). A line was drawn on the floor three meters in
front of the chair. The participants were asked to rise from
chair, walk the three meters to cross the line, turn around,
walk back, and sit down on the chair again. The time for
this procedure was recorded by a stopwatch. The inte-
grated factor of muscle strength and the ability to walk
and turn around are evaluated by this test. A 0–20 s. score
was used inversely for normalization.
4. Reaction time
The step reaction time to a visual cue has been shown to
be related to fall risk [23]. In a near-fall situation it is nec-
essary to respond quickly to regain the balance and reac-
tion time will give an insight of this ability. In our set-up,
the participant was asked to stand in front of a wall at a
distance of half a meter. A red and a green light were
mounted on the wall at eye height and a red and a green
footplate were placed 30 cm in front of the participant's
feet 30 cm apart. The lights were alighted manually in a
random order five times each, and the participant was
asked to step onto the footplate of matching colour to the
light as quickly as possible. The whole procedure was
repeated with the foot plates placed at each side of the par-
ticipant at a distance of 30 cm.
A step on the footplates triggered a pressure sensitive con-
tact. This signal and the trigger time from the lights were
recorded and the signal times were subtracted to find the
reaction time. A mean reaction time from all trials was
given. An inverse 0–2 s. score was used for normalization.
5. General leg strength
Muscle strength is known to be related to falls risk [2]. A
widely known clinical test for leg muscle strength called
"Timed Stand Test" (TST) was used [40]. The time needed
to rise from a chair ten times was recorded. The height of
the chair was adjusted to the participant's leg length to
maintain a knee angle at 90 degrees when sitting with the
feet supported on the ground. The participant was
instructed to rise and sit as fast as possible, and time taken
for this was recorded using a stopwatch. A 0–60 s. score
was used inversely for normalization.
6. Dual task – gait automation
Walking should be an automated function which should
not require much attention and it should be possible to
perform a cognitive task while walking. However, it can be
challenging to perform two tasks at the same time (dual
task) if attention is needed in both tasks. Elderly fallers
probably have a less automated gait and this explains why
they seem to walk slower when performing a dual task
[41]. To evaluate the dual task capacity of the participants
a modified "Walking and Counting test" was used [42].
The participant was asked to walk a ten meter distance as
quickly as possible. Then the same task was performed
while now counting backwards in a 3-step sequence from
80. The walking time was recorded by a stopwatch, and
the decrease in speed was given in percent. A 0–200 %
score was used inversely for normalization.
7. Gait variability
Walking is a challenging task, in which successful motor
planning and fine tuned postural control are required to
produce a smooth gait pattern. To reveal inadequacy in
these matters, different gait measures can be used. During
walking, the reaction forces from the floor are reflected in
the trunk. An accelerometer placed at the lower back
would move up and down, from side to side, and forward
at alternating accelerations according to these forces. The
recording of these alterations in acceleration offers a
means of quantifying the gait. Measures on temporal
stride-to-stride variability in the gait has proven to be pre-
dictors of fall risk [16]. By using accelerometry, even more
information on the gait pattern is recorded, and a variabil-
ity in the acceleration pattern between strides will be an
indicator of the gait characteristics [43].
In this study the gait characteristics were measured by a
tri-axial accelerometer placed at the participant's lower
back at the L3 segment. Data from the accelerometer were
stored in a portable data-logger carried behind the partic-
ipant by the investigator. The participant was asked to
walk a 14 meter distance on a flat floor. A trigger signal
was manually activated when passing two markers on the
floor. These markers were ten meters apart, and the partic-
ipant would start and stop walking two meters before and
after the respective markers. In this way a steady state gait
for ten meters could be evaluated. The walking sequence
was repeated six times at different speeds, – twice at indi-
vidual preferred speed, twice at fast speed, and twice at
slow speed. The raw data from the accelerometer were
low-pass filtered at 50 Hz once in the forward and once in
the reverse direction. The data were re-oriented to a verti-
cal-horizontal plane for each gait speed as proposed by
Moe-Nilssen [44]. Furthermore, an unbiased autocorrela-
tion of the anterior-posterior accelerations was performed
for each gait sequence which represented approximately
eight strides [45]. The autocorrelation for a cyclic signal
will produce peaks equivalent to the periodicity of the sig-
nal. The amplitude of the peak representing two phase
shifts will relate to the variability between the strides. An
autocorrelation coefficient of 1.0 would indicate that
there is no variability between the gait strides at all,
whereas a smaller coefficient would reflect a larger varia-
bility. The autocorrelation coefficients were averaged for
Journal of Negative Results in BioMedicine 2007, 6:2 />Page 10 of 11
(page number not for citation purposes)
the six different gait sequences. An autocorrelation score
between 0.5 and 1.0 was used for normalization.
8. Gait cadence
Gait speed has been seen as an indicator of fall risk [46].
Gait speed is a product of step length and cadence, and
more detailed information might be gathered from
recordings of the cadence. Step time was estimated from
the interval between autocorrelation peaks given by the
accelerometer measures, and this step time was inverted
into a cadence given for each gait speed. As cadence
increases with increasing gait speed the cadence was nor-
malized to 1.1 m/s [45]. The cadence was furthermore
normalized (to a body height of 1.65 m) by the square
root of the height, as cadence is inversely proportional to
the square root of body size [43]. A 1–3 steps/s. score was
used inversely for normalization.
9. Vision
Impaired vision is an important and independent risk fac-
tor for falls [18]. It is necessary to be able to see changes
in the ground surface or obstructions in the walking path
in order to plan and adjust the postural control in a feed-
forward manner. Three tests were chosen to assess the
vision as a feed-forward means for planning the gait: a.
Visual acuity was assessed by using poster constructed for
this purpose (Landolt "C" Translucent chart for 3-meter
testing cat.no.2206, Precision Vision
®
, IL, USA). It was
placed at a three meter distance in a light condition at
approximately 400 lux. The participant was tested binoc-
ularly wearing normal glasses for walking. The test log-
scores were converted into a rank scale: = 0.0 ≈ Normal
vision (3 points); 0.1 – 0.4 ≈ Subnormal (2 points); 0.5 –
0.9 ≈ Weak sight (1 point); > 1.0 ≈ Very weak sight (0
points). b. A contrast sensitivity test was used to assess the
participant's ability to detect contrasts (Pelli-Robson Con-
trast Chart 4 K, Clement Clark Int. Ltd., Essex, UK). The
log contrast sensitivity scores were converted into a rank
scale: ≥ 1.8 ≈ Normal (2 points); 1.36 – 1.8 ≈ Subnormal
(1 point); ≤ 1.35 ≈ Weak (0 points). c. The visual field was
tested using a confrontation test a.m. Donders [47]. The
test was carried out for one eye at a time in the horizontal,
the 135°, and the vertical plane. The performance was
scored in ranks of 0 – 2 for each direction: > 60° ≈ Normal
(2 points); 30 – 60° ≈ Reduced (1 point); < 30° ≈ Very
reduced (0 points). A sum of these score ranged from 0 to
12, which again was ranked in three categories: 12 ≈ Nor-
mal (2 points); 7 – 11 ≈ Reduced (1 point); ≤ 6 ≈ Very
reduced (0 points). Data from these three tests on vision
were added and presented as a common 0–7 score, which
was normalized into a 0–10 scale.
Data Analysis
Signal processing of the accelerometer signals and the trig-
ger signals on reaction time was performed in MatLab
(ver. 6.1, MathWorks Inc.). Data organization was done in
Excel (2002, Microsoft Corp.) and the statistics were con-
ducted in SPSS (ver. 12.0, SPSS Inc.). Power calculation
was done in an online calculation from the Department of
Statistics, UCLA [48].
To compare group characteristics and test scores in the
fallers and non-fallers group, Student's t-tests (for nomi-
nal data) and Mann-Whitney U tests (for ordinal data)
were used. Binary and backward stepwise logistic regres-
sion was used to evaluate the predictive capability of the
test battery and the contribution to the prediction of indi-
vidual tests. To be able to evaluate a common score of the
test battery score in relation to fall risk the original scores
from the individual tests were converted into 0–10 scales.
A conversion was chosen for each test which allowed for
the minimum and maximum scores. In order to let higher
values present better performance, some test scores had to
be reversed. The normalized test scores were averaged into
a common test battery score. The predictive rates of the
test battery in relation to the variable "faller" and "non-
faller" was evaluated at a selected optimal cut-off value (so
called crude discrimination rates).
The one-sided power of the study was estimated in rela-
tion to a relevant mean difference in test battery score of
0.5 equal to a 5% difference. Furthermore the least critical
difference was estimated for a power of 80%.
Chi-square test and one-way ANOVA with post-hoc tests
were used when the data was evaluated according to bal-
ance-related illness.
Competing interests
The author(s) declare that they have no competing inter-
ests.
Authors' contributions
All authors participated in the design of the study. TS was
involved in the overall organisation and coordination. OS
supervised and contributed in clinical aspects of the study.
HCH was involved in recruitment of participants and
supervised the contacts. MV supervised the technical
methodology and was involved in the data analysis and
drafting of the manuscript. UL designed the study, carried
out the testing and data analysis and was main author of
the manuscript.
Acknowledgements
The study was financially supported by Center for Clinical and Basic
Research A/S (CCBR), The National Danish Research Foundation, Depart-
ment of Health Science and Technology, Aalborg University, and the Uni-
versity College of Health, Aalborg.
Statistical assistance was provided by Lundbye-Christensen and Struijk, Aal-
borg University.
Journal of Negative Results in BioMedicine 2007, 6:2 />Page 11 of 11
(page number not for citation purposes)
References
1. Bloem BR, Steijns JA, Smits-Engelsman BC: An update on falls. Curr
Opin Neurol 2003, 16:15-26.
2. Prevention AGSPF: Guideline for the prevention of falls in older
persons. American Geriatrics Society, British Geriatrics
Society, and American Academy of Orthopaedic Surgeons
Panel on Falls Prevention. J Am Geriatr Soc 2001, 49:664-672.
3. Network HE: What are the main risk factors for falls amongst
older people and what are the most effective interventions
to prevent these falls? 2004 [ />theses/Fallsrisk/20040318_1].
4. Shumway-Cook A, Woollacott MH: Motor Control: Theory and Practical
Applications Philadelphia, Williams and Wilkins; 2001.
5. Gillespie LD, Gillespie WJ, Robertson MC, Lamb SE, Cumming RG,
Rowe BH: Interventions for preventing falls in elderly people.
Cochrane Database Syst Rev 2001:CD000340.
6. Close J, Ellis M, Hooper R, Glucksman E, Jackson S, Swift C: Preven-
tion of falls in the elderly trial (PROFET): a randomised con-
trolled trial. Lancet 1999, 353:93-97.
7. Day L, Fildes B, Gordon I, Fitzharris M, Flamer H, Lord S: Ran-
domised factorial trial of falls prevention among older peo-
ple living in their own homes. BMJ 2002, 325:128.
8. Robertson MC, Campbell AJ, Gardner MM, Devlin N: Preventing
injuries in older people by preventing falls: a meta-analysis of
individual-level data. J Am Geriatr Soc 2002, 50:905-911.
9. Wolf SL, Barnhart HX, Kutner NG, McNeely E, Coogler C, Xu T:
Reducing frailty and falls in older persons: an investigation of
Tai Chi and computerized balance training. Atlanta FICSIT
Group. Frailty and Injuries: Cooperative Studies of Interven-
tion Techniques. J Am Geriatr Soc 1996, 44:489-497.
10. Moreland J, Richardson J, Chan DH, O'Neill J, Bellissimo A, Grum RM,
Shanks L: Evidence-based guidelines for the secondary pre-
vention of falls in older adults. Gerontology 2003, 49:93-116.
11. Boulgarides LK, McGinty SM, Willett JA, Barnes CW: Use of clinical
and impairment-based tests to predict falls by community-
dwelling older adults. Phys Ther 2003, 83:328-339.
12. Chiu AY, Au-Yeung SS, Lo SK: A comparison of four functional
tests in discriminating fallers from non-fallers in older peo-
ple. Disabil Rehabil 2003, 25:45-50.
13. Lord SR, Menz HB, Tiedemann A: A physiological profile
approach to falls risk assessment and prevention. Phys Ther
2003, 83:237-252.
14. Shimada H, Obuchi S, Kamide N, Shiba Y, Okamoto M, Kakurai S:
Relationship with dynamic balance function during standing
and walking. Am J Phys Med Rehabil 2003, 82:511-516.
15. Woollacott M, Shumway-Cook A: Attention and the control of
posture and gait: a review of an emerging area of research.
Gait & Posture 2002, 16:1-14.
16. Hausdorff JM, Rios DA, Edelberg HK: Gait variability and fall risk
in community-living older adults: a 1-year prospective study.
Arch Phys Med Rehabil 2001, 82:1050-1056.
17. Woollacott MH, Tang PF: Balance control during walking in the
older adult: Research and its implications. Physical Therapy
1997, 77:646-660.
18. Lord SR, Dayhew J: Visual risk factors for falls in older people.
J Am Geriatr Soc 2001, 49:508-515.
19. Mulder T, Zijlstra W, Geurts A: Assessment of motor recovery
and decline. Gait & Posture 2002, 16:198-210.
20. Springer S, Giladi N, Peretz C, Yogev G, Simon ES, Hausdorff JM:
Dual-tasking effects on gait variability: The role of aging,
falls, and executive function. Mov Disord 2006.
21. Shumway-Cook A, Brauer S, Woollacott M: Predicting the proba-
bility for falls in community-dwelling older adults using the
Timed Up & Go Test. Phys Ther 2000, 80:896-903.
22. Dite W, Temple VA: A clinical test of stepping and change of
direction to identify multiple falling older adults. Arch Phys
Med Rehabil 2002, 83:1566-1571.
23. Lord SR, Fitzpatrick RC: Choice stepping reaction time: a com-
posite measure of falls risk in older people. J Gerontol A Biol Sci
Med Sci 2001, 56:M627-M632.
24. Rossiter-Fornoff JE, Wolf SL, Wolfson LI, Buchner DM: A cross-sec-
tional validation study of the FICSIT common data base
static balance measures. Frailty and Injuries: Cooperative
Studies of Intervention Techniques. J Gerontol A Biol Sci Med Sci
1995, 50:M291-M297.
25. Masud T, Morris RO: Epidemiology of falls. Age Ageing 2001, 30
Suppl 4:3-7.
26. Laessoe U, Voigt M, Simonsen O, Hoeck HC, Sinkjaer T: Screening
for Balance and Gait Characteristics in Relation to Falls in a
Healthy Elderly Population. Gait & Posture 2005, 21 Suppl
1:116-116.
27. Shumway-Cook A, Baldwin M, Polissar NL, Gruber W: Predicting
the probability for falls in community-dwelling older adults.
Phys Ther 1997, 77:812-819.
28. Brauer SG, Burns YR, Galley P: A prospective study of laboratory
and clinical measures of postural stability to predict commu-
nity-dwelling fallers. J Gerontol A Biol Sci Med Sci 2000,
55:M469-M476.
29. Gregg EW, Cauley JA, Seeley DG, Ensrud KE, Bauer DC: Physical
activity and osteoporotic fracture risk in older women.
Study of Osteoporotic Fractures Research Group. Ann Intern
Med 1998, 129:81-88.
30. Kandel ER, Schwartz JH, Jessell TM: Principles of Neural Science 4th.
edition. New York, McGraw-Hill; 2000.
31. Porter MM, Vandervoort AA, Lexell J: Aging of human muscle:
structure, function and adaptability. Scand J Med Sci Sports 1995,
5:129-142.
32. Lord SR, Sherrington C, Menz HB: Falls in older people. Risk factors and
strategies for prevention. 1st edition. Cambridge, Cambridge University
Press; 2001.
33. Foreman MD, Fletcher K, Mion LC, Simon L: Assessing cognitive
function. Geriatr Nurs 1996, 17:228-232.
34. Powell LE, Myers AM: The Activities-specific Balance Confi-
dence (ABC) Scale. J Gerontol A Biol Sci Med Sci 1995,
50A:M28-M34.
35. Loland NW: Reliability of the Physical Activity Scale for the
Elderly. Eur J Sport Science 2002, 2:.
36. Washburn RA, Smith KW, Jette AM, Janney CA: The Physical
Activity Scale for the Elderly (PASE): development and eval-
uation. J Clin Epidemiol 1993, 46:153-162.
37. Tinetti ME, Speechley M, Ginter SF: Risk factors for falls among
elderly persons living in the community. N Engl J Med 1988,
319:1701-1707.
38. Guralnik JM, Simonsick EM, Ferrucci L, Glynn RJ, Berkman LF, Blazer
DG, Scherr PA, Wallace RB: A short physical performance bat-
tery assessing lower extremity function: association with
self-reported disability and prediction of mortality and nurs-
ing home admission. J Gerontol 1994, 49:M85-M94.
39. Podsiadlo D, Richardson S: The timed "Up & Go": a test of basic
functional mobility for frail elderly persons. J Am Geriatr Soc
1991, 39:142-148.
40. Csuka M, Mccarty DJ: Simple Method for Measurement of
Lower-Extremity Muscle Strength. American Journal of Medicine
1985, 78:77-81.
41. Verghese J, Buschke H, Viola L, Katz M, Hall C, Kuslansky G, Lipton
R: Validity of divided attention tasks in predicting falls in
older individuals: a preliminary study. J Am Geriatr Soc 2002,
50:1572-1576.
42. Gulich M, Zeitler HP: [The walking-counting test. A simple test
for assessing the risk of falling]. Dtsch Med Wochenschr 2000,
125:245-248.
43. Moe-Nilssen R, Helbostad JL: Interstride trunk acceleration var-
iability but not step width variability can differentiate
between fit and frail older adults. Gait Posture 2005, 21:164-170.
44. Moe-Nilssen R: A new method for evaluating motor control in
gait under real-life environmental conditions. Part 2: Gait
analysis. Clin Biomech (Bristol , Avon ) 1998, 13:328-335.
45. Moe-Nilssen R, Helbostad JL: Estimation of gait cycle character-
istics by trunk accelerometry. J Biomech 2004, 37:121-126.
46. Dargent-Molina P, Favier F, Grandjean H, Baudoin C, Schott AM,
Hausherr E, Meunier PJ, Breart G: Fall-related factors and risk of
hip fracture: the EPIDOS prospective study. Lancet 1996,
348:145-149.
47. Donders FC: Beitrages zur pathologishen Anatomi des Auges.
Graefes Arch Ophtalmology 1855, 1:106.
48. Power Calculator. Department of Statistics, University of
California, Los Angeles 2006 [ />].