Báo cáo khoa hoc:"Multi-subject/daily-life activity EMG-based control of mechanical hands" ppsx
Bạn đang xem bản rút gọn của tài liệu. Xem và tải ngay bản đầy đủ của tài liệu tại đây (901.26 KB, 11 trang )
BioMed Central
Page 1 of 11
(page number not for citation purposes)
Journal of NeuroEngineering and
Rehabilitation
Open Access
Research
Multi-subject/daily-life activity EMG-based control of mechanical
hands
Claudio Castellini*
1
, Angelo Emanuele Fiorilla
1,2
and Giulio Sandini
2
Address:
1
DIST, University of Genova, viale F Causa 13, 16145 Genova, Italy and
2
Italian Institute of Technology, via Morego 30, 16163 Genova,
Italy
Email: Claudio Castellini* - ; Angelo Emanuele Fiorilla - ;
Giulio Sandini -
* Corresponding author
Abstract
Background: Forearm surface electromyography (EMG) has been in use since the Sixties to feed-
forward control active hand prostheses in a more and more refined way. Recent research shows
that it can be used to control even a dexterous polyarticulate hand prosthesis such as Touch
Bionics's i-LIMB, as well as a multifingered, multi-degree-of-freedom mechanical hand such as the
DLR II. In this paper we extend previous work and investigate the robustness of such fine control
possibilities, in two ways: firstly, we conduct an analysis on data obtained from 10 healthy subjects,
trying to assess the general applicability of the technique; secondly, we compare the baseline
controlled condition (arm relaxed and still on a table) with a "Daily-Life Activity" (DLA) condition
in which subjects walk, raise their hands and arms, sit down and stand up, etc., as an experimental
proxy of what a patient is supposed to do in real life. We also propose a cross-subject model
analysis, i.e., training a model on a subject and testing it on another one. The use of pre-trained
models could be useful in shortening the time required by the subject/patient to become proficient
in using the hand.
Results: A standard machine learning technique was able to achieve a real-time grip posture
classification rate of about 97% in the baseline condition and 95% in the DLA condition; and an
average correlation to the target of about 0.93 (0.90) while reconstructing the required force.
Cross-subject analysis is encouraging although not definitive in its present state.
Conclusion: Performance figures obtained here are in the same order of magnitude of those
obtained in previous work about healthy subjects in controlled conditions and/or amputees, which
lets us claim that this technique can be used by reasonably any subject, and in DLA situations. Use
of previously trained models is not fully assessed here, but more recent work indicates it is a
promising way ahead.
Background
Electromyography (EMG from now on) is a well-known
diagnostic tool for detecting muscle disorders from motor
unit activation potentials [1,2]. In its non-invasive (sur-
face) version it has also been used since the Sixties [3-5] to
enable amputees control one or two degrees-of-freedom
(DOFs) of active upper limb prostheses. Its commercial/
clinical applications include, e.g., Otto Bock's Sen-
Published: 17 November 2009
Journal of NeuroEngineering and Rehabilitation 2009, 6:41 doi:10.1186/1743-0003-6-41
Received: 10 December 2008
Accepted: 17 November 2009
This article is available from: />© 2009 Castellini et al; licensee BioMed Central Ltd.
This is an Open Access article distributed under the terms of the Creative Commons Attribution License ( />),
which permits unrestricted use, distribution, and reproduction in any medium, provided the original work is properly cited.
Journal of NeuroEngineering and Rehabilitation 2009, 6:41 />Page 2 of 11
(page number not for citation purposes)
sorHand Speed [6], the Motion Control Hand and the
Utah Arm [7], and more recently, Touch Bionics's i-LIMB
[8], with 5 active and one passive DOF. In some of these
cases, force/torque are also controlled.
The popularity of surface EMG stems from its cheapness,
simplicity of use and non-invasiveness.
Nevertheless, research on more and more dexterous
mechanical hands is ongoing (e.g., the DLR-II hand [9]
and the Cyberhand [10,11]) and soon a finer control will
be required. To this end, at least since 2002 [12-15] it is
known that a few surface EMG electrodes suffice to recog-
nise up to nine isometric/isotonic hand postures. This
potentiality has so far been exploited clinically in the i-
LIMB only, and to a very limited extent so far, as far as we
know. In previous work it has also been shown that a dex-
terous hand prosthesis can be feed-forward force-control-
led while detecting grasping postures [15,16] in real time.
So it appears that plain, old EMG still has to be exploited
in full.
The work presented in this paper fits in this line of
research, extending previous results along two "orthogo-
nal" directions: first, we analyse data collected from 10
healthy subjects and thus try and assess the general appli-
cability of the technique; second, we compare a baseline
controlled condition with a "Daily-Life Activity" (DLA)
one, in which subjects walk, raise their hands and arms, sit
down and stand up, etc., while performing the same
actions of the baseline. The DLA condition is an experi-
mental proxy of what a patient is supposed to do in real
life. Lastly, we propose a cross-subject model analysis, i.e.,
training a model on a subject and testing it on another
one. The use of pre-trained models could be useful in
shortening the time required by the subject/patient to
become proficient in using the prosthesis.
Materials and methods
Subjects
Ten healthy subjects joined the experiment after having
given their informed consent. The subjects were two
women and eight men, nine right-handed and one left-
handed, average age 30.9 ± 8.45 years, standard Caucasian
weight and height. They were given no knowledge of what
the experiment was about.
Experimental procedure
The experiment consisted of two phases. During phase 1,
after a "rest" condition was sampled to define the baseline
EMG activity, the subject would keep her/his arm still and
relaxed on a table, and was asked to grasp a force sensor
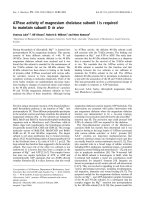
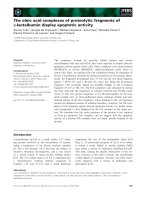
using, in turn, three different ways of grasping it (Figure
1): index precision grip, other fingers precision grip and
power grasp. While gathering data, a label {1, 2, 3, 4}
denoting the grasp (or rest) was attached to each sample,
in order to build the ground truth values.
The subject freely repeated each grasping action for 100",
resting for 30" in between grasps. The whole procedure
was repeated twice for numerical robustness purposes.
This "baseline" phase will be referred to from now on as
the Still-Arm phase (SA).
Phase 2, which started soon after phase 1 for each subject,
consisted in repeating phase 1 while the subject was left
free to move, walk around, lift and pronate/supinate the
arm and forearm, sit down and stand up from a chair. This
second phase is intended as a laboratory-controlled proxy
of the main movements a patient is expected to do during
DLAs. This phase will be called Free-Arm phase (FA).
Each subject's experiment resulted in something more
than 1200" of data. Data were sampled at 2 KHz, resulting
in about 2.4 × 10
6
samples for each subject, equally dis-
tributed in each phase.
The three different grips employed in the experiment: (left) index precision grip; (center) other fingers precision grip; (right) power graspFigure 1
The three different grips employed in the experiment: (left) index precision grip; (center) other fingers preci-
sion grip; (right) power grasp.
Journal of NeuroEngineering and Rehabilitation 2009, 6:41 />Page 3 of 11
(page number not for citation purposes)
Equipment and electrode placement
We employed Aurion ZeroWire wireless surface EMG elec-
trodes [17], in order to ease the FA phase, which required
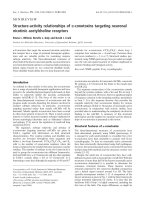
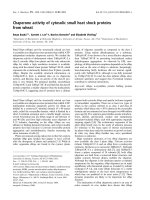
free movement in the laboratory. A FUTEK LMD500 Hand
Gripper force sensor [18] was used to detect the force
applied while grasping. (See Figure 2.) A standard digital
acquisition board (National Instruments NI-USB6211)
was used to record the signals, connected to the receiver of
the EMG wireless device and to an amplifier, in turn con-
nected to the force sensor. The sampling rate was set at 2
KHz in order to correctly sample both signals (the EMG
signal relevant bandwidth lies between 15 and 500 Hz).
The board was connected via a USB port to an entry-level
laptop. We used a custom National Instruments' LabView
VI block to acquire the signals.
Seven electrodes were glued on each subject's dominant
forearm, according to this anatomic guideline:
• on the forearm ventral side: near the wrist, above the
flexor pollicis longus; centrally, above the flexor digitorum
superficialis; near the elbow, above the flexor digitorum
profundus; and near the wrist, above the flexor digitorum
superficialis again;
• on the forearm dorsal side: near the wrist, above the
extensor pollicis brevis/abductor pollicis longus; centrally,
above the extensor digitorum communis and extensor dig-
iti minimi.
These positions were chosen, according to the medical
[19] and bioengineering [20] literature, to detect the activ-
ity of the flexor and extensor muscles of the forearm
which are most relevant during grasping. Figure 2 (right-
most panel) shows the typical electrode positioning.
Notice that there may be remarkable inter-arm differences
depending on the subjects' age, gender and physical fit-
ness. Moreover, some of the aforementioned muscles are
deep into the forearm, so that muscle cross-talk cannot be
avoided. This is a well-known problem in the EMG litera-
ture [1,13].
Data analysis
The root-mean-square (RMS) of the EMG was evaluated
using a time window T
RMS
. The optimal value of T
RMS
was
evaluated independently for classification of the grasping
posture and force detection, via grid search, in a prelimi-
nary phase of the experiment, and set to 500 ms for classi-
fication and 100 ms for regression. The choice of the RMS,
as opposed to the simpler rectification and filtering, is
motivated by its well-known relationship to the force
exerted by the related muscle [1,2,13]. Rectification plus
filtering would likely work as well, and it is indeed
employed in some commercial myoelectrodes such as
Otto Bock's MyoBock ones [21].
Notice that the right choice of T
RMS
can be, in general, cru-
cial: a small value will make the system more responsive
(i.e., implies a smaller delay) but a higher value will be
more informative and improve the performance (espe-
cially in the case of classification, as we verified). On the
other hand, it is known that the EMG signal anticipates
the muscle movements by a few hundreds milliseconds;
therefore, in a practical application derived from this
experiment, a wider lag would be more acceptable than
one would expect. The electromechanical delay (EMD) of
a muscle is defined as the interval between the onset of the
electrical activity of the muscle (EMG) indicating its acti-
vation by the neural system and the onset of the resulting
change in the mechanical variable observed. The delays
reported range from 25 to 100 ms for different muscles
and tasks [22].
Part of the experimental setup: (left) an EMG wireless electrode; (center) the force sensor; (right) typical placement of the EMG electrodes on a subject's forearm (ventral side)Figure 2
Part of the experimental setup: (left) an EMG wireless electrode; (center) the force sensor; (right) typical place-
ment of the EMG electrodes on a subject's forearm (ventral side).
Journal of NeuroEngineering and Rehabilitation 2009, 6:41 />Page 4 of 11
(page number not for citation purposes)
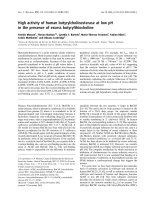
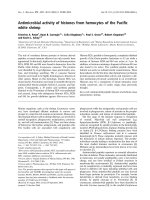
Figure 3 (left) shows the typical EMG signal (red) and
force (blue) recorded by the force sensor. Clearly the
amplitude of the envelope of the EMG is related to the
force, as is indicated in literature. The right panel of the
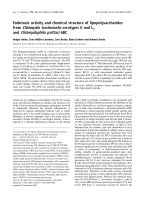
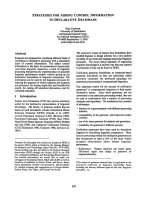
Figure shows the bandwidth of the EMG. Figure 4 shows
the effect of the RMS on the frequency components of the
EMG, for three different values of T
RMS
. In all cases, the
RMS signal bandwidth is upper-bounded by about 25 Hz
(left panel, for T
RMS
= 20 ms) to 10 Hz (right panel, for
T
RMS
= 0.5s), as expected (larger values of T
RMS
correspond
to a better filtering but also to a larger delay). According to
these figures, we subsampled the RMS of the EMG signals
at 25 Hz by taking one sample in 80 of the original
sequence, resulting in about 30.000 samples for each sub-
ject.
Lastly, samples for which the applied force was lower than
a specific threshold were removed. After verifying several
choices both numerically and visually, the threshold was
uniformly set at 20% of the mean force value obtained for
each subject and phase.
Statistical analysis
According to previous literature (e.g., [14,16]), the statis-
tical analysis was carried on using Support Vector
Machine (SVM). For a comprehensive tutorial on SVMs
refer to [23,24]. SVMs are a statistical learning method
able to build an approximated map between an input
space and a label (classification) or a real value (regres-
sion). Classification is here used to classify the type of
grasp according to the EMG signal, whereas regression is
used to understand how much force the subject is exert-
ing, independently from the grasp type. The input space is
ޒ
7
, one coordinate for each EMG electrode. We used the
ground truth values as labels and the force value given by
the force sensor for the regression. Notice that SVMs work
here in real-time, associating a grasp type and a force value
to an EMG value at each instant of time. Grasp type and
forces are then predicted almost at the onset of the grasp-
ing movement, differently from what happens in other
approaches (e.g., [14,25]) in which all values of the input
signal over a further time-window are employed as the
input space.
In order to ease the computational burden we employed
uniformisation [16] to reduce the size of the training sets.
The samples in a training set are considered one by one in
chronological order, as it would happen in an on-line set-
ting, and each new sample is added to the training set if
and only if its Euclidean distance from all training sam-
ples retained so far is larger than a predefined value d. Val-
ues of d were set to 0.02 for the SA phase and 0.032 for the
FA phase. These values were chosen in order to get not
more than one thousand training samples for subject 1.
The choice is arbitrary, but notice that (see [16] again) the
performance of such systems changes linearly as d
changes, whereas the training set size varies polynomially;
thus, it is always possible to find a polynomially smaller
training set, if needed, which will degrade the perform-
ance only linearly. This really means that the initial choice
of d is not crucial. Also, notice that testing sets have not
been uniformised, in order to give a more realistic result.
SVM analysis was performed for each subject and for each
phase, to check how the performance depends upon sub-
jects and conditions. For classification, the performance
index is, as is customary, the percentage of overall cor-
rectly guessed labels. For regression, the performance
(left) Typical raw EMG (red) and force (blue) signals, as read from the electrodes and force sensor; (right) frequency diagram of the EMG signalFigure 3
(left) Typical raw EMG (red) and force (blue) signals, as read from the electrodes and force sensor; (right) fre-
quency diagram of the EMG signal.
Journal of NeuroEngineering and Rehabilitation 2009, 6:41 />Page 5 of 11
(page number not for citation purposes)
index is the correlation coefficient evaluated between the
predicted force signal and the real one. The choice of the
correlation coefficient is suggested by this consideration:
when driving a prosthesis we are not interested in the
absolute force values desired by the user/subject, since
mechanical hands usually cannot apply as much force as
human hands do, for obvious safety reasons (or, e.g., in
teleoperation scenarios, they could be able to apply much
more force than a human hand can). Rather, we are con-
cerned about getting a signal which is strongly correlated
with the user/subject's will. Anyway, we also report about
the normalised root mean-square error (NRMSE), in order
to give a broader view of the results. Normalisation is
done against the signals' ranges (notice, though, that cor-
relation is the criterion used to find the optimal parame-
ters during grid search). We employed a well-known freely
available SVM package, libsvm v2.83 [26], in the Matlab
wrapped flavour; the Gaussian kernel was chosen, since it
is a standard choice in previous literature. EMG data were
normalised along each dimension, as is customary, by
subtracting the mean value and dividing by the standard
deviation. 5-fold cross-validation was used to assess the
generalisation error for each training set; this measure was
then used for grid-searching the typical Gaussian kernel
hyperparameters of a SVM, called
γ
and C. Once these
parameters were found, the overall performance was eval-
uated as the mean and standard deviation of the perform-
ances obtained on each fold.
Results
Per-subject analysis
Figure 5 shows the main results. Classification accuracy
(top panel) for the SA phase ranges from 99.58% ± 0.17%
(subject 5) to 91.37% ± 0.89% (subject 8); for the FA
phase, it ranges from 98.40% ± 0.08% (subject 2) to
82.43% ± 1.24% (subject 8 again). On average over all
subjects, the classification accuracy is 97.14% ± 2.90% for
SA and 95.24% ± 4.77% for FA. Notice that the perform-
ance is consistent by subject and by phase, meaning that
(a) hard subjects in the SA phase are hard as well in the FA
phase and viceversa, and (b) the FA phase is always harder
than the SA phase.
Regression figures (middle and bottom panels) show that
for the SA phase the correlation to true signal ranges from
0.9784 ± 0.0017 (subject 5) to 0.8959 ± 0.0033 (subject
8), whereas for the FA phase it ranges from 0.9657 ±
0.0022 (subject 5) to 0.8161 ± 0.0078 (subject 8). On
average, the correlation is 0.93 ± 0.04 for the SA phase and
0.90 ± 0.05 for the FA phase. Again, consistency by subject
and by phase appears. Remarkably, not all subjects which
are slightly harder for regression (namely, 1, 2, 3, 6, 8)
happen to be hard for classification; in particular, only
subject 8 is definitely hard both for classification and
regression, while, e.g., subject 6 is hard for regression but
(left to right) Effects of the RMS on the bandwidth of the EMG signals, for T
RMS
= 20, 100, 500 msFigure 4
(left to right) Effects of the RMS on the bandwidth of
the EMG signals, for T
RMS
= 20, 100, 500 ms.
Classification (top) and regression (middle, correlation to tar-get; bottom, NRMSE) results obtained by the system, on both phases of the experiment (FA and SA) and for each subjectFigure 5
Classification (top) and regression (middle, correla-
tion to target; bottom, NRMSE) results obtained by
the system, on both phases of the experiment (FA
and SA) and for each subject.
Journal of NeuroEngineering and Rehabilitation 2009, 6:41 />Page 6 of 11
(page number not for citation purposes)
not that hard for classification. The bottom panel shows
that an analogous situation appears if we consider the
NRMSE. (Recall that the NRMSE is an error measure while
the correlation to target is a positive performance index.)
Figure 6 shows the real and guessed force values for a typ-
ical subject, namely number 6, FA phase. Strong correla-
tion between the guessed and true values is visually
apparent, in agreement with the performance values out-
lined before. On the other hand, Figure 7 shows the (aver-
age) confusion matrices for the SA and FA phases. Clearly,
most of the classification errors, for both phases, regard
the "power grasp" being mistaken for the "other fingers
precision grip". This is intuitively sensible, since gripping
with middle, ring and pinkie finger involves co-contract-
ing the index finger too, to some extent. This makes the
former grip quite similar to the latter, from a muscular
point of view.
As far as hyperparameters grid search is concerned, Table
1 shows the average values of (the logarithms of)
γ
and C
for the optimal models obtained via cross-validation. The
grid search ranges were [0, 3] for log
10
(C) and [-1.85, 0.16]
for log
10
(
γ
) (these are standard values in literature, given
the dimensionality of the input space). The average value
of log
10
(C) is around 1.5, but its standard deviation is
rather wide with respect to the range, at least in the case of
classification. The standard deviation is smaller for regres-
sion than for classification in both cases, which seems to
indicate that regression is more stable a problem with
respect to the hyperparameters.
In order to check whether the FA phase is really indicative
of what a patient might do in her/his DLAs, we have
trained a machine on the data gathered during the FA
phase and then tested it on the data gathered during the
SA phase. Figure 8 shows the results of testing FA-models
on SA data, and viceversa.
FA-models tested on SA data obtain an average accuracy of
75.11% ± 12.34% for classification and 0.8056 ± 0.1151
for regression; whereas testing SA-models on FA data gives
70.17% ± 11.99% in classification and 0.7530 ± 0.1153 in
regression. The advantage of FA models over SA models is
apparent, uniform and consistent. Notice that here we
show no error bars, since, for each subject and phase,
there is just one training set and one testing set.
Lastly, let us consider the worst result of the per-subject
analysis subject 8 in the FA phase, as far as classification
is concerned. One of the possible causes of this compara-
tively low performance (82.43% ± 1.24) is that too many
samples are missing from the original training set (d too
high). In order to test this hypothesis, we let d linearly
range around the pre-set value of 0.032 and check (a) the
size of the resulting training set and (b) the performance
obtained by the system. Figure 9 shows the result of this
test.
The Figure confirms that the training set size has a decreas-
ing polynomial trend, while the performance changes lin-
early [16]. In particular, for d = 0.032 the previously
shown performance appears, whereas if a larger perform-
ance is required, one can increase the number of samples
in the training set, or, which is equivalent, reduce the mag-
nitude of d. For instance, to get an accuracy of about 90%
d must be set at 0.2 ending up in a training set with some
1600 samples.
Comparing true (black continuous line) and guessed (red dotted line) force values for regression of a typical subject (number 6, FA phase)Figure 6
Comparing true (black continuous line) and guessed (red dotted line) force values for regression of a typical
subject (number 6, FA phase).
Journal of NeuroEngineering and Rehabilitation 2009, 6:41 />Page 7 of 11
(page number not for citation purposes)
Cross-subject analysis
Recall that in this experiment, for all subjects, the EMG
electrodes were carefully positioned on the forearm
according to an anatomical guideline, meaning that noise
due to inter-arm differences should be to some extent
avoided. We can therefore check how well each model
performs on each subject by building a cross-subject per-
formance matrix A, for both classification and regression,
and for both phases, in which A
ij
is the performance index
attained by a model trained on data gathered from subject
i while predicting data gathered from subject j. Figure 10
shows the matrices.
The overall results indicate that a large amount of the
models overlap, or at least that there is a certain cross-sub-
ject capacity of prediction. Consider the numbers below
the matrices in the Figure: in classification, the perform-
ances are 51.69% and 54.04%, with the remarkable par-
ticular that the FA-models are slightly, but consistently,
better in cross-subject analysis (higher mean values and
lower standard deviations) than the SA-models. As far as
regression is concerned, the average cross-subject correla-
tion is around 0.60. Notice that models trained on sub-
jects 6 (for the SA phase) and 8 (FA phase) appear to be
particularly bad in predicting other subjects' data (the
related rows of the bottom left and right matrices, in turn,
are rather darker than the average).
In previous work it was shown that a significant (inverse)
correlation appears between the cross-subject perform-
ance matrices and the cross-distance matrices D, obtained
by evaluating a mean distance D
ij
between two sample sets
S
i
and S
j
like this:
Confusion matrices for the SA (left) and FA phase (right)Figure 7
Confusion matrices for the SA (left) and FA phase (right). Each matrix is the average over the confusion matrices of the
10 subjects. A confusion matrix C is such that its (i, j)th element is the fraction of i labels mistaken for j labels, over the total
mistaken labels.
Table 1: Mean values and standard deviations of the
hyperparameters
γ
and C.
Phase, problem Log
10
(
γ
) log
10
(C)
SA, class. -0.35 ± 0.58 1.6 ± 0.84
FA, class. -0.65 ± 0.54 1.55 ± 0.83
SA, regr. -0.50 ± 0.24 1.45 ± 0.44
FA, regr. -0.60 ± 0.26 1.45 ± 0.37
Classification (top) and regression (bottom, correlation to tar-get) results obtained testing on SA-data models trained on FA, and vice-versaFigure 8
Classification (top) and regression (bottom, correla-
tion to target) results obtained testing on SA-data
models trained on FA, and vice-versa.
1 2 3 4 5 6 7 8 9 10
40
60
80
100
subject #
% of correct labels
1 2 3 4 5 6 7 8 9 10
0.5
0.6
0.7
0.8
0.9
subject #
correlation to target
FA on SA
SA on FA
Journal of NeuroEngineering and Rehabilitation 2009, 6:41 />Page 8 of 11
(page number not for citation purposes)
This analysis for each pair (i, j) of subjects and for the two
phases and problems shows that inverse correlation is
absent in the case of the FA phase in classification; it is
mild (-0.32) for SA in classification; and that it is strong in
the case of regression (-0.63 for the SA phase and -0.65 for
the FA phase). It is likely that the correlation in regression
is connected to the actual smoothness of the function the
system is trying to approximate. It is unclear why the clas-
sification problems show a weak correlation or none at
all.
Discussion and conclusion
Since 2002 at least, it is known that that machine learning
methods, applied to EMG-based hand/wrist configuration
recognition, can solve the problem quite thoroughly (an
incomplete list includes [11,16,27-29]). The research is all
the more interesting since very recent work on amputees,
both from the neuroscientific [30,31] and the engineer's
[32-34] point of view, clearly shows that it is applicable to
the disabled. Within this stream of research, this work
aims at answering two questions:
1. can this technique be applied to any (healthy) sub-
ject?
2. will it work in Daily-Life Activities?
The results presented above point at a positive answer to
both questions.
The first question is answered by noting that a uniformly
good performance is obtained for each subject, in each
phase. The figures obtained by on the SA phase are com-
parable to those found in other, related work such as
D
S
j
ss
ij
sS
ji
sS
ii
jj
=−
∈
∈
∑
1
2
||
min || ||
Size of the training set (red dotted line) and classification performance (blue continuous line), of subject 8 in the FA phase, as d changesFigure 9
Size of the training set (red dotted line) and classification performance (blue continuous line), of subject 8 in
the FA phase, as d changes.
0.02 0.025 0.03 0.035 0.04
76
78
80
82
84
86
88
90
classification performance
0.02 0.025 0.03 0.035 0.04
200
400
600
800
1000
1200
1400
1600
1800
training set size
d
Journal of NeuroEngineering and Rehabilitation 2009, 6:41 />Page 9 of 11
(page number not for citation purposes)
[11,34] or [16] where the predicted signals were actually
used to control the DLR-II hand in real-time. This indi-
cates that the approach will reasonably work on any
healthy subject. Combining this result with the more
recent results obtained on amputees listed above, one can
conclude that the approach is viable for a wide range of
patients, too. Notice that SVMs are by no means the only
approach to solve this problem; linear regression, neural
networks, LWPR [35] and Hidden Markov Models [27],
among others, have been employed too, with similarly
good results; probably, even simpler approaches would
get an acceptable level of performance, which further
raises the hopes for a real system based upon these results.
From the point of view of machine learning, interpreting
surface EMG is an easy task, a feeling corroborated, at least
in the case of regression, by the uniformity of the optimal
hyperparamters found by grid search
The second question is here equivalent to asking whether
the performance is comparable between the SA and FA
phases, provided that the FA phase is a reasonable experi-
mental proxy of DLAs of the standard patient. The results
obtained in the FA phase are actually in the same order of
performance as those in the SA phase. A deeper analysis
reveals that FA models are in a sense "wider" than SA ones,
since they test better on SA data than the reverse.
As an aside result, it turns out that uniformisation pro-
duces small training sets (about 30 times smaller than the
original, subsampled sets) which are used to generate
models with excellent accuracy. The phenomenon
described in [16] is here confirmed: as the minimum dis-
tance d is linearly increased, performance degrades line-
arly while the training sets become polynomially smaller.
This opens up the possibility of using it to build asymp-
Cross-subject performance matrices, for classification (top row) and regression (bottom row), in the SA (left column) and FA phase (right column); the numbers refer to all element of the matrices, excluding the diagonalsFigure 10
Cross-subject performance matrices, for classification (top row) and regression (bottom row), in the SA (left
column) and FA phase (right column); the numbers refer to all element of the matrices, excluding the diagonals.
Journal of NeuroEngineering and Rehabilitation 2009, 6:41 />Page 10 of 11
(page number not for citation purposes)
totically bound training sets, which is paramount in an
on-line setting, where the data flow is potentially endless.
Notice that, in this work, the training sets are, in absolute
terms, small, since each subject could not be tested for
more than 20 minutes; this means that the models pre-
sented here might suffer from noise introduced by
medium-to-long term factors such as, e.g., muscle fatigue,
sweat and/or electrode re-positioning. In [16] it is shown
that these problems could be overcome by a sufficiently
long training time, and we see no reason to believe that
this is not the case here.
Also notice that, in general, predicting the grip force from
the EMG signal is nothing new the EMG-to-force is well-
known and has been modelled, among other methods,
via linear regression [36]. Our regression model is novel
in that it predicts the force to a similar degree of precision
independently of the grasp type employed. So it can be
used in parallel with the classifier, as it has indeed been
done in [16]. As far as cross-subject analysis is confirmed,
the figures presented here cannot be used in practice,
although they are better than chance; but notice that in
[37] a more refined approach has been employed success-
fully, indicating that pre-trained models can be effectively
used to improve classification and regression perform-
ance, with respect to tabula rasa learning.
Competing interests
The authors declare that they have no competing interests.
Authors' contributions
CC has collected some data, performed the data analysis
and written most of the paper. AEF has taken care of the
setup, collected most of the data and written some of the
paper. GS has helped design the experiment, proof-read
the paper and given useful advice throughout the realisa-
tion of the work. All authors have read and approved the
manuscript.
Acknowledgements
This work has been partially supported by the EU project NEURObotics,
FP6-IST-001917.
References
1. De Luca CJ: The use of surface electromyography in biome-
chanics. Journal of Applied Biomechanics 1997, 13(2):135-163.
2. De Luca CJ: Surface Electromyography: Detection and
Recording. 2002. [Copyright 2002 by DelSys, Inc.]
3. Bottomley AH: Myoelectric control of powered prostheses. J
Bone Joint Surg 1965, B47:411-415.
4. Childress DA: A myoelectric three-state controller using rate
sensitivity. Proceedings 8th ICMBE, Chicago, IL 1969:4-5.
5. Sears HH, Shaperman J: Proportional myoelectric hand control:
an evaluation. Am J Phys Med Rehabil 1991, 70:20-28.
6. Otto Bock SensorHand Hand Prosthesis 2008 [http://
www.ottobockus.com].
7. Motion Control Hand Prosthesis 2008 [
].
8. The i-Limb system 2007 [
].
9. Huang H, Jiang L, Zhao D, Zhao J, Cai H, Liu H, Meusel P, Willberg B,
Hirzinger G: The Development on a New Biomechatronic
Prosthetic Hand Based on Under-actuated Mechanism. Pro-
ceedings of the 2006 IEEE/RSJ International Conference on Intelligent
Robots and Systems 2006:3791-3796.
10. Carrozza M, Cappiello G, Micera S, Edin BB, Beccai L, Cipriani C:
Design of a cybernetic hand for perception and action. Biolog-
ical Cybernetics 2006, 95(6):629-644.
11. Cipriani C, Zaccone F, Micera S, Carrozza MC: On the Shared
Control of an EMG-Controlled Prosthetic Hand: Analysis of
User Prosthesis Interaction. IEEE Transactions on Robotics 2008,
24:170-184.
12. Ferguson S, Dunlop GR: Grasp Recognition from Myoelectric
Signals. Proceedings of the Australasian Conference on Robotics and
Automation, Auckland, New Zealand 2002.
13. Zecca M, Micera S, Carrozza MC, Dario P: Control of Multifunc-
tional Prosthetic Hands by Processing the Electromyo-
graphic Signal. Critical Reviews in Biomedical Engineering 2002, 30(4-
6):459-485.
14. Bitzer S, Smagt P van der: Learning EMG control of a robotic
hand: Towards Active Prostheses. Proceedings of ICRA, Interna-
tional Conference on Robotics and Automation, Orlando, Florida, USA
2006:2819-2823.
15. Castellini C, Smagt P van der, Sandini G, Hirzinger G: Surface EMG
for Force Control of Mechanical Hands. Proceedings of ICRA-08
- International Conference on Robotics and Automation 2008:725-730.
16. Castellini C, Smagt P van der: Surface EMG in Advanced Hand
Prosthetics. Biological Cybernetics 2008, 100:35-47.
17. Aurion ZeroWire EMG electrodes 2008 [
].
18. Futek LMD500 Medical Load Cell (Hand) 2008 [http://
www.futek.com/product.aspx?stock=FSH00125&acc2=acc].
19. Kendall FP, McCreary EK, Provance PG, Rodgers MM, Romani W:
Muscles: Testing and Function, with Posture and Pain 530 Walnut St. Phil-
adelphia, PA 19106-3621: Lippincott Williams & Wilkins; 2005.
20. Kampas P: The optimal use of myoelectrodes. Medizinisch-
Orthopädische Technik 2001, 121:21-27. [English translation from the
German of "Myoelektroden - optimal eingesetzt"].
21. Otto Bock MYOBOCK 13E200 = 50 Electrodes 2008 [http://
www.ottobockus.com].
22. Wolf W, Staude C, Appel U: Enhanced onset detection accuracy
"reduces" the electromechanical delay of distal muscles.
Proc. 16th Annual International Conference of the IEEE Engineering
Advances: New Opportunities for Biomedical Engineers Engineering in Med-
icine and Biology Society 1994:392-393.
23. Burges CJC: A Tutorial on Support Vector Machines for Pat-
tern Recognition. Knowledge Discovery and Data Mining 1998, 2(2):.
24. Smola AJ, Schölkopf B: A tutorial on support vector regression.
Statistics and Computing 2004, 14(3):199-222.
25. Sebelius FCP, Rosén BN, Lundborg GN: Refined myoelectric con-
trol in below-elbow amputees using artificial neural net-
works and a data glove. J Hand Surg [Am] 2005, 30(4):780-789.
26. Chang CC, Lin CJ: LIBSVM: a library for Support Vector Machines 2001
[ />].
27. Chan A, Englehart K: Continuous myoelectric control for pow-
ered prostheses using hidden Markov models. Biomedical Engi-
neering, IEEE Transactions on 2005, 52:121-124.
28. Tsukamoto M, Kondo T, Ito K: A Prosthetic Hand Control
Based on Nonstationary EMG at the Start of Movement.
Journal of Robotics and Mechatronics 2007, 19(4):381-387.
29. Jiang N, Englehart K, Parker P: Extracting Simultaneous and Pro-
portional Neural Control Information for Multiple Degree of
Freedom Prostheses From the Surface Electromyographic
Signal. IEEE Transactions on Biomedical Engineering 2009,
56(4):1070-1080.
30. Mercier C, Reilly KT, Vargas CD, Aballea A, Sirigu A: Mapping
phantom movement representations in the motor cortex of
amputees. Brain 2006, 129:2202-2210.
31. Reilly KT, Mercier C, Schieber MH, Sirigu A: Persistent hand
motor commands in the amputees' brain. Brain 2006,
129:2211-2223.
32. Sebelius FCP, Rosén BN, Lundborg GN: Refined Myoelectric Con-
trol in Below-Elbow Amputees Using Artificial Neural Net-
works and a Data Glove. Journal of Hand Surgery 2005,
30A(4):780-789.
Publish with BioMed Central and every
scientist can read your work free of charge
"BioMed Central will be the most significant development for
disseminating the results of biomedical research in our lifetime."
Sir Paul Nurse, Cancer Research UK
Your research papers will be:
available free of charge to the entire biomedical community
peer reviewed and published immediately upon acceptance
cited in PubMed and archived on PubMed Central
yours — you keep the copyright
Submit your manuscript here:
/>BioMedcentral
Journal of NeuroEngineering and Rehabilitation 2009, 6:41 />Page 11 of 11
(page number not for citation purposes)
33. Castellini C, Gruppioni E, Davalli A, Sandini G: Fine detection of
grasp force and posture by amputees via surface electromy-
ography. Journal of Physiology (Paris) 2009, 103(3-5):255-262.
34. Tenore F, Ramos A, Fahmy A, Acharya S, Etienne-Cummings R, Tha-
kor NV: Decoding of individuated finger movements using
surface Electromyography. IEEE transactions on bio-medical engi-
neering 2009, 56(5):1427-1434.
35. Vijayakumar S, D'Souza A, Schaal S: Incremental Online Learning
in High Dimensions. Neural Computation 2005, 17:2602-2634.
36. Hoozemans MJM, van Dieën JH: Prediction of handgrip forces
using surface EMG of forearm muscles. Journal of Electromyogra-
phy and Kinesiology 2005, 15(4):358-366.
37. Orabona F, Castellini C, Caputo B, Fiorilla E, Sandini G: Model
Adaptation with Least-Squares SVM for Hand Prosthetics.
Proceedings of ICRA-09 - International Conference on Robotics and Auto-
mation 2009:2897-2903.