Statistics for Environmental Science and Management - Chapter 3 potx
Bạn đang xem bản rút gọn của tài liệu. Xem và tải ngay bản đầy đủ của tài liệu tại đây (1.53 MB, 39 trang )
CHAPTER 3
Models for Data
3.1 Statistical Models
Many statistical analyses are based on a specific model for a set of
data, where this consists of one or more equations that describe the
observations in terms of parameters of distributions and random
variables. For example, a simple model for the measurement X made
by an instrument might be
X = 2 + ,,
where 2 is the true value of what is being measured, and , is a
measurement error that is equally likely to be anywhere in the range
from -0.05 to +0.05.
In situations where a model is used, an important task for the data
analyst is to select a plausible model and to check, as far as possible,
that the data are in agreement with this model. This includes both
examining the form of the equation assumed, and the distribution or
distributions that are assumed for the random variables.
To aid in this type of modelling process there are many standard
distributions available, the most important of which are considered in
the following two sections of this chapter. In addition, there are some
standard types of model that are useful for many sets of data. These
are considered in the later sections of this chapter.
3.2 Discrete Statistical Distributions
A discrete distribution is one for which the random variable being
considered can only take on certain specific values, rather than any
value within some range (Appendix Section A2). By far the most
common situation in this respect is where the random variable is a
count and the possible values are 0, 1, 2, 3, and so on.
It is conventional to denote a random variable by a capital X and a
particular observed value by a lower case x. A discrete distribution is
then defined by a list of the possible values x
1
, x
2
, x
3
, , for X, and the
probabilities P(x
1
), P(x
2
), P(x
3
), for these values. Of necessity,
© 2001 by Chapman & Hall/CRC
P(x
1
) + P(x
2
) + P(x
3
) + = 1,
i.e., the probabilities must add to 1. Also of necessity, P(x
i
) $ 0 for all
i, with P(x
i
) = 0 meaning that the value x
i
can never occur. Often there
is a specific equation for the probabilities defined by a probability
function
P(x) = Prob(X = x),
where P(x) is some function of x.
The mean of a random variable is sometimes called the expected
value, and is usually denoted either by µ or E(X). It is the sample
mean that would be obtained for a very large sample from the
distribution, and it is possible to show that this is equal to
E(X) = 3 x
i
P(x
i
) = x
1
P(x
1
) + x
2
P(x
2
) + x
3
P(x
3
) + (3.1)
The variance of a discrete distribution is equal to the sample variance
that would be obtained for a very large sample from the distribution.
It is often denoted by F
2
, and it is possible to show that this is equal to
F
2
= 3 (x
i
- µ)
2
P(x
i
)
= (x
1
- µ)
2
P(x
1
) + (x
2
- µ)
2
P(x
2
) + (x
3
- µ)
2
P(x
3
) + (3.2)
The square root of the variance, F, is the standard deviation of the
distribution.
The following discrete distributions are the ones which occur most
often in environmental and other applications of statistics. Johnson
and Kotz (1969) provide comprehensive details on these and many
other discrete distributions.
The Hypergeometric Distribution
The hypergeometric distribution arises when a random sample of size
n is taken from a population of N units. If the population contains R
units with a certain characteristic, then the probability that the sample
will contain exactly x units with the characteristic is
P(x) =
R
C
x
N-R
C
n-x
/
N
C
n
, for x = 0, 1, , Min(n,R), (3.3)
where
a
C
b
denotes the number of combinations of a objects taken b
at at time. The proof of this result will be found in many elementary
© 2001 by Chapman & Hall/CRC
statistics texts. A random variable with the probabilities of different
values given by equation (3.3) is said to have a hypergeometric
distribution. The mean and variance are
µ = nR/N, (3.4)
and
F
2
= R(N - R)n/N
2
. (3.5)
As an example of a situation where this distribution applies,
suppose that a grid is set up over a study area and the intersection of
the horizontal and vertical grid lines defines N possible sample
locations. Let R of these locations have values in excess of a
constant C. If a simple random sample of n of the N locations is
taken, then equation (3.1) gives the probability that exactly x out of the
n sampled locations will have a value exceeding C.
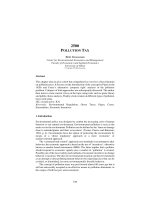
Figure 3.1(a) shows examples of probabilities calculated for some
particular hypergeometric distributions.
The Binomial Distribution
Suppose that it is possible to carry out a certain type of trial and when
this is done the probability of observing a positive result is always p for
each trial, irrespective of the outcome of any other trial. Then if n trials
are carried out the probability of observing exactly x positive is given
by the binomial distribution
P(x) =
n
C
x
p
x
(1 - p)
n-x
, for x = 0, 1, 2, , n, (3.6)
which is a result also provided in Section A2 of Appendix A. The
mean and variance of this distribution are
µ = np, (3.7)
and
F
2
= np(1 - p), (3.8)
respectively.
© 2001 by Chapman & Hall/CRC
(a) Hypergeometric Distributions
(b) Binomial Distributions
(c) Poisson Distributions
Figure 3.1 Examples of hypergeometric, binomial and Poisson discrete
probability distributions.
An example of this distribution occurs with the situation described
in Example 1.3, which was concerned with the use of mark-recapture
methods to estimate survival rates of salmon in the Snake and
Columbia Rivers in the Pacific Northwest of the United States. In that
setting, if n fish are tagged and released into a river and there is a
probability p of being recorded while passing a detection station
downstream for each of the fish, then the probability of recording a
total of exactly p fish downstream is given by equation (3.6).
Figure 3.1(b) shows some examples of probabilities calculated for
some particular binomial distributions.
© 2001 by Chapman & Hall/CRC
The Poisson Distribution
One derivation of the Poisson distribution is as the limiting form of the
binomial distribution as n tends to infinity and p tends to zero, with the
mean µ = np remaining constant. More generally, however, it is
possible to derive it as the distribution of the number of events in a
given interval of time or a given area of space when the events occur
at random, independently of each other at a constant mean rate. The
probability function is
P(x) = exp(-µ) µ
x
/ x!, for x = 0, 1, 2, (3.9)
The mean and variance are both equal to µ.
In terms of events occurring in time, the type of situation where a
Poisson distribution might occur is for counts of the number of
occurrences of minor oil leakages in a region per month, or the
number of cases per year of a rare disease in the same region. For
events occurring in space a Poisson distribution might occur for the
number of rare plants found in randomly selected metre square
quadrats taken from a large area. In reality, though, counts of these
types often display more variation than is expected for the Poisson
distribution because of some clustering of the events. Indeed, the
ratio of the variance of sample counts to the mean of the same counts,
which should be close to one for a Poisson distribution, is sometimes
used as an index of the extent to which events do not occur
independently of each other.
Figure 3.1(c) shows some examples of probabilities calculated for
some particular Poisson distributions.
3.3 Continuous Statistical Distributions
Continuous distributions are often defined in terms of a probability
density function, f(x), which is a function such that the area under the
plotted curve between two limits a and b gives the probability of an
observation within this range, as shown in Figure 3.2. This area is
also the integral between a and b, so that in the usual notation of
calculus
b
Prob( a < X < b) = I f(x) dx. (3.10)
a
© 2001 by Chapman & Hall/CRC
The total area under the curve must be exactly one, and f(x) must be
greater than or equal to zero over the range of possible values of x for
the distribution to make sense.
The mean and variance of a continuous distribution are the sample
mean and variance that would be obtained for a very large random
sample from the distribution. In calculus notation the mean is
µ = I x f(x) dx,
where the range of integration is the possible values for the x. This is
also sometimes called the expected value of the random variable X,
and denoted E(X). Similarly, the variance is
F
2
= I (x - µ)
2
f(x) dx, (3.11)
where again the integration is over the possible values of x.
Figure 3.2 The probability density function f(x) for a continuous distribution.
The probability of a value between a and b is the area under the curve
between these values, i.e., the area between the two vertical lines at x = a
and x = b.
The continuous distributions that are described here are ones that
often occur in environmental and other applications of statistics. See
Johnson and Kotz (1970a, 1970b) for details about many more
continuous distributions.
© 2001 by Chapman & Hall/CRC
The Exponential Distribution
The probability density function for the exponential distribution with
mean µ is
f(x) = (1/µ)exp(-x/µ), for x $ 0, (3.12)
which has the form shown in Figure 3.3. For this distribution the
standard deviation is always equal to the mean µ.
The main application is as a model for the time until a certain event
occurs, such as the failure time of an item being tested, the time
between the reporting of cases of a rare disease, etc.
Figure 3.3 Examples of probability density functions for exponential
distributions.
The Normal or Gaussian Distribution
The normal or Gaussian distribution with a mean of µ and a standard
deviation of F has the probability density function
f(x) = {1/%(2BF
2
)} exp{-(x - µ)
2
/(2F
2
)}, for -4 < x < +4. (3.13)
This distribution is discussed in Section A2 of Appendix A, and the
form of the probability density function is illustrated in Figure A1.
The normal distribution is the 'default' that is often assumed for a
distribution that is known to have a symmetric bell-shaped form, at
© 2001 by Chapman & Hall/CRC
least roughly. It is often observed for biological measurements such
as the height of humans, and it can be shown theoretically (through
something called the central limit theorem) that the normal distribution
will tend to result whenever the variable being considered consists of
a sum of contributions from a number of other distributions. In
particular, mean values, totals, and proportions from simple random
samples will often be approximately normally distributed, which is the
basis for the approximate confidence intervals for population
parameters that have been described in Chapter 2.
The Lognormal Distribution
It is a characteristic of the distribution of many environmental variables
that they are not symmetric like the normal distribution. Instead, there
are many fairly small values and occasional extremely large values.
This can be seen, for example, in the measurements of PCB
concentrations that are shown in Table 2.3.
With many measurements only positive values can occur, and it
turns out that the logarithm of the measurements has a normal
distribution, at least approximately. In that case the distribution of the
original measurements can be assumed to be a lognormal distribution,
with probability density function
f(x) = [1/{x%(2BF
2
)}]exp[-{log
e
(x) - µ}
2
/{2F
2
}], for x > 0. (3.14)
Here µ and F are the mean and standard deviation of the natural
logarithm of the original measurement. The mean and variance of the
original measurement itself are
E(X) = exp(µ + ½F
2
) (3.15)
and
Var(X) = exp(2µ + F
2
){exp(F
2
) - 1}. (3.16)
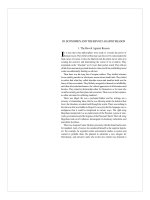
Figure 3.4 shows some examples of probability density functions for
three lognormal distributions.
© 2001 by Chapman & Hall/CRC
Figure 3.4 Examples of lognormal distributions with a mean of 1.0. The
standard deviations are 0.5, 1.0 and 2.0.
3.4 The Linear Regression Model
Linear regression is one of the most frequently used statistical tools.
Its purpose is to relate the values of a single variable Y to one or more
other variables X
1
, X
2
, , X
p
, in an attempt to account for the variation
in Y in terms of variation in the other variables. With only one other
variable this is often referred to as simple linear regression.
The usual situation is that the data available consist of n
observations y
1
, y
2
, , y
n
for the dependent variable Y, with
corresponding values for the X variables. The model is assumed is
y = ß
0
+ ß
1
x
1
+ ß
2
x
2
+ + ß
p
x
p
+ ,, (3.17)
where , is a random error with a mean of zero and a constant
standard deviation F. The model is estimated by finding the
coefficients of the X values that make the error sum of squares as
small as possible. In other words, if the estimated equation is
í = b
0
+ b
1
x
1
+ b
2
x
2
+ + b
p
x
p
, (3.18)
then the b values are chosen so as to minimise
SSE = E(y
i
- í
i
)², (3.19)
where the í
i
is the value given by the fitted equation that corresponds
to the data value y
i
, and the sum is over the n data values. Statistical
packages or spreadsheets are readily available to do these
calculations.
© 2001 by Chapman & Hall/CRC
There are various ways that the usefulness of a fitted regression
equation can be assessed. One involves partitioning the variation
observed in the Y values into parts that can be accounted for by the
X values, and a part (SSE, above) which cannot be accounted for. To
this end, the total variation in the Y values is measured by the total
sum of squares
SST = E(y
i
- y)
2
. (3.20)
This is partitioned into the sum of squares for error (SSE), and the
sum of squares accounted for by the regression (SSR), so that
SST = SSR + SSE.
The proportion of the variation in Y accounted for by the regression
equation is then the coefficient of multiple determination,
R
2
= SSR/SST = 1 - SSE/SST, (3.21)
which is a good indication of the effectiveness of the regression.
There are a variety of inference procedures that can be applied in
the multiple regression situation when the regression errors , are
assumed to be independent random variables from a normal
distribution with a mean of zero and constant variance F
2
. A test for
whether the fitted equation accounts for a significant proportion of the
total variation in Y can be based on Table 3.1, which is a variety of
what is called an 'analysis of variance table' because it compares the
observed variation in Y accounted for by the fitted equation with the
variation due to random errors. From this table, the F-ratio,
F = MSR/MSE = [SSR/p]/[SSE/(n - p - 1)] (3.22)
can be tested against the F-distribution with p and n - p - 1 degrees of
freedom to see if it is significantly large. If this is the case, then there
is evidence that Y is related to at least one of the X variables.
© 2001 by Chapman & Hall/CRC
Table 3.1 Analysis of variance table for a multiple regression analysis
Source of
variation
Sum of
squares
Degrees of
freedom
Mean
square
F-ratio
Regression SSR p MSR MSR/MSE
Error SSE n - p - 1 MSE
Total SST n - 1
The estimated regression coefficients can also be tested
individually to see whether they are significantly different from zero.
If this is not the case for one of these coefficients, then there is no
evidence that Y is related to the X variable concerned. The test for
whether ß
j
is significantly different from zero involves calculating the
statistic b
j
/SÊ(b
j
), where SÊ(b
j
) is the estimated standard error of b
j
,
which should be output by the computer program used to fit the
regression equation. This statistic can then be compared with the
percentage points of the t-distribution with n - p - 1 degrees of
freedom. If b
j
/SÊ(b
j
) is significantly different from zero, then there is
evidence that ß
j
is not equal to zero. In addition, if the accuracy of the
estimate b
j
is to be assessed, then this can be done by calculating a
95% confidence interval for ß
j
as b
j
± t
5%,n-p-1
b
j
/SÊ(b
j
), where t
5%,n-p-1
is
the absolute value that is exceeded with probability 0.05 for the t-
distribution with n - p - 1 degrees of freedom.
There is sometimes value in considering the variation in Y that is
accounted for by a variable X
j
when this is included in the regression
after some of the other variables are already in. Thus if the variables
X
1
to X
p
are in the order of their importance, then it is useful to
successively fit regressions relating Y to X
1
, Y to X
1
and X
2
, and so on
up to Y related to all the X variables. The variation in Y accounted for
by X
j
after allowing for the effects of the variables X
1
to X
j-1
is then
given by the extra sum of squares accounted for by adding X
j
to the
model.
To be more precise, let SSR(X
1
,X
2
, ,X
j
) denote the regression sum
of squares with variables X
1
to X
j
in the equation. Then the extra sum
of squares accounted for by X
j
on top of X
1
to X
j-1
is
SSR(X
j
X
1
,X
2
, ,X
j-1
) = SSR(X
1
,X
2
, ,X
j
) - SSR(X
1
,X
2
, ,X
j-1
).(3.23)
© 2001 by Chapman & Hall/CRC
On this basis, the sequential sums of squares shown in Table 3.2 can
be calculated. In this table the mean squares are the sums of squares
divided by their degrees of freedom, and the F-ratios are the mean
squares divided by the error mean square. A test for the variable X
j
being significantly related to Y, after allowing for the effects of the
variables X
1
to X
j-1
, involves seeing whether the corresponding F-ratio
is significantly large in comparison to the F-distribution with 1 and n -
p - 1 degrees of freedom.
Table 3.2 Analysis of variance table for the extra sums of squares
accounted for by variables as they are added into a multiple regression
model one by one
Source of
variation
Sum of squares Degrees of
freedom
Mean square F-ratio
X
1
SSR(X
1
) 1 MSR(X
1
) F(X
1
)
X
2
|X
1
SSR(X
2
|X
1
) 1 MSR(X
2
|X
1
) F(X
2
|X
1
)
. . .
. . .
X
p
|X
1
, X
p-1
SSR(X
p
|X
1
, X
p-1
) 1 MSR(X
p
|X
1
, X
p-1
) F(X
p
|X
1
, X
p-1
)
Error SSE n - p - 1 MSE
Total SST n - 1
If the X variables are uncorrelated, then the F ratios indicated in
Table 3.2 will be the same irrespective of what order the variables are
entered into the regression. However, usually the X variables are
correlated and the order may be of crucial importance. This merely
reflects the fact that with correlated X variables it is generally only
possible to talk about the relationship between Y and X
j
in terms of
which of the other X variables are controlled for.
This has been a very brief introduction to the uses of multiple
regression. It is a tool that is used for a number of applications later
in this book. For a more detailed discussion see Manly (1992,
Chapter 4), or one of the many books devoted to this topic (e.g., Neter
et al., 1983 or Younger, 1985). Some further aspects of the use of
this method are also considered in the following example.
© 2001 by Chapman & Hall/CRC
Example 3.1 Chlorophyll-a in Lakes
The data for this example are part of a larger data set originally
published by Smith and Shapiro (1981), and also discussed by
Dominici et al. (1997). The original data set contains 74 cases, where
each case consists of observations on the concentration of
chlorophyll-a, phosphorus, and (in most cases) nitrogen at a lake at
a certain time. For the present example, 25 of the cases were
randomly selected from those where measurements on all three
variables are present. This resulted in the values shown in Table 3.3.
Chlorophyll-a is a widely used indicator of lake water quality. It is
a measure of the density of algal cells, and reflects the clarity of the
water in a lake. High concentrations of chlorophyll-a are associated
with high algal densities and poor water quality, a condition known as
eutrophication. Phosphorus and nitrogen stimulate algal growth and
high values for these chemicals are therefore expected to be
associated with high chlorophyll-a. The purpose of this example is to
illustrate the use of multiple regression to obtain an equation relating
chlorophyll-a to the other two variables.
The regression equation
CH = $
0
+ $
1
PH + $
2
NT + , (3.24)
was fitted to the data in Table 3.3, where CH denotes chlorophyll-a,
PH denotes phosphorus, and NT denotes nitrogen. This gave
CH = -9.386 + 0.333PH + 1.200NT, (3.25)
with an R
2
value from equation (3.21) of 0.774. The equation was fitted
using the regression option in a spreadsheet, which also provided
estimated standard errors for the coefficients of SÊ(b
1
) = 0.046 and
SÊ(b
2
) = 1.172.
© 2001 by Chapman & Hall/CRC
Table 3.3 Values of chlorophyll-a, phosphorus and
nitrogen taken from various lakes at various times
Case Chlorophyll-a Phosphorus Nitrogen
1 95.0 329.0 8
2 39.0 211.0 6
3 27.0 108.0 11
4 12.9 20.7 16
5 34.8 60.2 9
6 14.9 26.3 17
7 157.0 596.0 4
8 5.1 39.0 13
9 10.6 42.0 11
10 96.0 99.0 16
11 7.2 13.1 25
12 130.0 267.0 17
13 4.7 14.9 18
14 138.0 217.0 11
15 24.8 49.3 12
16 50.0 138.0 10
17 12.7 21.1 22
18 7.4 25.0 16
19 8.6 42.0 10
20 94.0 207.0 11
21 3.9 10.5 25
22 5.0 25.0 22
23 129.0 373.0 8
24 86.0 220.0 12
25 64.0 67.0 19
To test for the significance of the estimated coefficients, the ratios
b
1
/SÊ(b
1
) = 0.333/0.046 = 7.21,
and
b
2
/SÊ(b
2
) = 1.200/1.172 = 1.02
must be compared with the t-distribution with n - p - 1 = 25 - 2 - 1 = 22
degrees of freedom. The probability of obtaining a value as far from
zero as 7.21 is 0.000 to three decimal places, so that there is very
strong evidence that chlorophyll-a is related to phosphorus. However,
© 2001 by Chapman & Hall/CRC
the probability of obtaining a value as far from zero as 1.02 is 0.317,
which is quite large. Therefore there seems to be little evidence that
chlorophyll-a is related to nitrogen.
This analysis seems straightforward but there are in fact some
problems with it. These problems are indicated by plots of the
regression residuals, which are the differences between the observed
concentrations of chlorophyll-a and the amounts that are predicted by
the fitted equation (3.25). To show this it is convenient to use
standardized residuals, which are the differences between the
observed CH values and the values predicted from the regression
equation, divided by the estimated standard deviation of the
regression errors.
For a well-fitting model these standardized residuals will appear to
be completely random, and should be mostly within the range from -2
to +2. No patterns should be apparent when they are plotted against
the values predicted by the regression equation, or the variables being
used to predict the dependent variable. This is because the
standardized residuals should approximately equal the error term , in
the regression model but scaled to have a standard deviation of one.
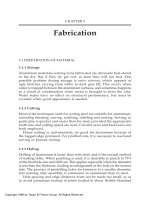
The standardized residuals are plotted on the left-hand side of
Figure 3.5 for the regression equation (3.25). There is some
suggestion that (i) the variation in the residuals increases with the
fitted value, or, at any rate, is relatively low for the smallest fitted
values, (ii) all the residuals are less than zero for lakes with very low
phosphorus concentrations, and (iii) the residuals are low, then tend
to be high, and then tend to be low again as the nitrogen
concentration increases.
The problem here seems to be the particular form assumed for the
relationship between chlorophyll-a and the other two variables. It is
more usual to assume a linear relationship in terms of logarithms, i.e.,
log(CH) = $
0
+ $
1
log(PH) + $
2
log(NT) + ,, (3.26)
for the variables being considered (Dominici et al., 1997). Using
logarithms to base ten, fitting this equation by multiple regression
gives
log(CH) = -1.860 + 1.238log(PH) + 0.907log(NT). (3.27)
The R
2
value from equation (3.21) is 0.878, which is substantially
higher than the value of 0.774 found from fitting equation (3.25). The
estimated standard errors for the estimated coefficients of log(PH) and
log(NT) are 0.124 and 0.326, which means that there is strong
evidence that log(CH) is related to both of these variables (t =
© 2001 by Chapman & Hall/CRC
1.238/0.124 = 9.99 for log(CH), giving p = 0.000 for the t-test with 22
degrees of freedom; t = 0.970/0.326 = 2.78 for log(NT), giving p =
0.011 for the t-test). Finally, the plots of standardized residuals for
equation (3.27) that are shown on the right-hand side of Figure 3.5
give little cause for concern.
(a) (b)
Figure 3.5 (a) Standardized residuals for chlorophyll-a plotted against the
fitted value predicted from the regression equation (3.25) and against the
phosphorus and nitrogen concentrations for lakes, and (b) standardized
residuals for log(chlorophyll-a) plotted against the fitted value,
log(phosphorus), and log(nitrogen) for the regression equation (3.27).
An analysis of variance is provided for equation (3.27) in Table 3.4.
This shows that the equation with log(PH) included accounts for a very
highly significant part of the variation in log(CH). Adding in log(NT) to
the equation then gives a highly significant improvement.
© 2001 by Chapman & Hall/CRC
Table 3.4 Analysis of variance for equation (3.27) showing the
sums of squares accounted for by log(PH), and log(NT) added into
the equation after log(PH)
Source
Sum of
Squares
Degrees
of
Freedom
Mean
Square F p-value
Phosphorus 5.924 1 5.924 150.98 0.0000
Nitrogen 0.303 1 0.303 7.72 0.0110
Error 0.863 22 0.039
Total 7.090 24 0.295
In summary, a simple linear regression of chlorophyll-a against
phosphorus and nitrogen does not seem to fit the data altogether
properly, although it accounts for about 77% of the variation in
chlorophyll-a. However, by taking logarithms of all the variables a fit
with better properties is obtained, which accounts for about 88% of the
variation in log(chlorophyll-a).
3.5 Factorial Analysis of Variance
The analysis of variance that can be carried out with linear regression
is very often used in other situations as well, particularly with what are
called factorial experiments. An important distinction in this
connection is between variables and factors. A variable is something
like the phosphorus concentration or nitrogen concentration in lakes,
as in the example just considered. A factor, on the other hand, has a
number of levels and in terms of a regression model it may be thought
plausible that the response variable being considered has a mean
level that changes with these levels.
Thus if an experiment is carried out to assess the effect on the
survival time of fish of a toxic chemical, then the survival time might be
related by a regression model to the dose of the chemical, perhaps at
four concentrations, which would then be treated as a variable. If the
experiment was carried out on fish from three sources, or on three
different species of fish, then the type of fish would be a factor, which
could not just be entered as a variable. The fish types would be
labelled 1 to 5 and what would be required in the regression equation
is that the mean survival time varied with the type of fish.
© 2001 by Chapman & Hall/CRC
The type of regression model that could then be considered would
be
Y = $
1
X
1
+ $
2
X
2
+ $
3
X
3
+ $
4
X
4
+ ,, (3.28)
where Y is the survival time of a fish, X
i
for i = 1 to 3 are dummy
indicator variables such that X
i
= 1 if the fish is of type i, or is otherwise
0, and X
4
is the concentration of the chemical. The effect of this
formulation is that for a fish of type 1 the expected survival time with
a concentration of X
4
is $
1
+ $
4
X
4
, for a fish of type 2 the expected
survival time with this concentration is $
2
+ $
4
X
4
, and for a fish of type
3 the expected survival time with this concentration is $
3
+ $
4
X
4
.
Hence in this situation the fish type factor at three levels can be
allowed for by introducing three 0-1 variables into the regression
equation and omitting the constant term $
0
.
Equation (3.28) allows for a factor effect, but only on the expected
survival time. If the effect of the concentration of the toxic chemical
may also vary with the type of fish, then the model can be extended
to allow for this, by adding products of the 0-1 variables for the fish
type with the concentration variable to give
Y = $
1
X
1
+ $
2
X
2
+ $
3
X
3
+ $
4
X
1
X
4
+ $
5
X
2
X
4
+ $
6
X
3
X
4
+ ,. (3.29)
For fish of types 1 to 3 the expected survival times are then $
1
+ $
4
X
4
,
$
2
+ $
5
X
4
, and $
3
+ $
6
X
4
, respectively. The effect is then a linear
relationship between the survival time and the concentration of the
chemical which differs for the three types of fish.
When there is only one factor to be considered in a model it can be
handled reasonably easily by using dummy indicator variables as just
described. However, with more than one factor this gets cumbersome
and it is more usual to approach modelling from the point of view of a
factorial analysis of variance. This is based on a number of standard
models and the theory can get quite complicated. Nevertheless, the
use of analysis of variance in practice can be quite straightforward if
a statistical package is available to do the calculations. An
introduction to experimental designs and their corresponding analyses
of variance is given by Manly (1992, Chapter 7), and a more detailed
account by Mead et al. (1993). Here only three simple situations will
be considered.
© 2001 by Chapman & Hall/CRC
One factor Analysis of Variance
With a single factor the analysis of variance model is just a model for
comparing the means of I samples, where I is two or more. This
model can be written as
x
ij
= µ + a
i
+ ,
ij
, (3.30)
where x
ij
is the jth observed value of the variable of interest at the ith
factor level (i.e., in the ith sample), µ is an overall mean level, a
i
is the
deviation from µ for the ith factor level with a
1
+ a
2
+ a
I
= 0, and ,
ij
is the random component of xij, which is assumed to be independent
of all other terms in the model, with a mean of zero and a constant
variance.
To test for an effect of the factor an analysis of variance table is set
up, which takes the form shown in Table 3.5. Here the sum of
squares for the factor is just the sum of squares accounted for by
allowing the mean level to change with the factor level in a regression
model, although it is usually computed somewhat differently. The F-
test requires the assumption that the random components ,
ij
in the
model (3.30) have a normal distribution.
Table 3.5 Form of the analysis of variance table for a one factor model,
with I levels of the factor and n observations in total
Source of
variation Sum of Squares
1
Degrees
of
freedom Mean square
2
F
3
Factor SSF I - 1 MSF = SSB/(I - 1) MSF/MSE
Error SSE n - I MSE = SSE/(n - I)
Total SST = 33(x
ij
- x)
2
n - 1
1
SSF = sum of squares between factor levels, SSE = sum of squares for error
(variation within factor levels), and SST = total sum of squares for which the
summation is over all observations at all factor levels.
2
MSF= mean square between factor levels, and MSE = mean square error.
3
The F-value is tested for significance by comparison with critical values for the F-
distribution with I - 1 and n - I degrees of freedom.
© 2001 by Chapman & Hall/CRC
Two Factor Analysis of Variance
With a two factor situation there are I levels for one factor (A) and J
levels for the other factor (B). It is simplest if m observations are taken
for each combination of levels, which is what will be assumed here.
The model can be written
x
ijk
= µ + a
i
+ b
j
+ (ab)
ij
+ ,
ijk
, (3.31)
where x
ijk
denotes the kth observation at the ith level for factor A and
the jth level for factor B, µ denotes an overall mean level, a
i
denotes
an effect associated with the ith level of factor A, b
j
denotes an effect
associated with the jth level of factor B, (ab)
ij
denotes an interaction
effect so that the mean level at a factor combination does not have to
be just the sum of the effects of the two individual factors, and ,
ijk
is
the random part of the observation x
ijk
, which is assumed to be
independent of all other terms in the model, with a mean of zero and
a constant variance.
Moving from one to two factors introduces the complication of
deciding whether the factors have what are called fixed or random
effects, because this can affect the conclusions reached. With a fixed
effects factor the levels of the factor for which data are collected are
regarded as all the levels of interest. The effects associated with that
factor are then defined to add to zero. Thus if A has fixed effects, then
a
1
+ a
2
+ + a
I
= 0 and (ab)
1j
+ (ab)
2j
+ + (ab)
Ij
= 0, for all j. If, on
the contrary, A has random effects, then the values a
1
to a
I
are
assumed to be random values from a distribution with mean zero and
variance F
2
A
, while (ab)
1j
to (ab)
Ij
are assumed to be random values
from a distribution with mean zero and variance F
2
AB
.
An example of a fixed effect is when an experiment is run with low,
medium and high levels for the amount of a chemical because in such
a case the levels can hardly be thought of as a random choice from a
population of possible levels. An example of a random effect is when
one of the factors in an experiment is the brood of animals tested,
where these broods are randomly chosen from a large population of
possible broods. In this case the brood effects observed in the data
will be random values from the distribution of brood effects that are
possible.
The distinction between fixed and random effects is important
because the way that the significance of factor effects is determined
depends on what is assumed about these effects. Some statistical
packages allow the user to choose which effects are fixed and which
are random, and carries out tests based on this choice. The 'default'
© 2001 by Chapman & Hall/CRC
is usually fixed effects for all factors, in which case the analysis of
variance table is as shown in Table 3.6.
If there is only m = 1 observation for each factor combination, then
the error sum of squares shown in Table 3.6 cannot be calculated. In
that case it is usual to assume that there is no interaction between the
two factors, in which case the interaction sum of squares becomes an
error sum of squares, and the factor effects are tested using F-ratios
that are the factor mean squares divided by this error sum of squares.
Table 3.6 Form of the analysis of variance table for a two factor model
with fixed effects, and with I levels for factor A, J levels for factor B, m
observations for each combination of factor levels, and n = IJm
observations in total
Source of
variation Sum of Squares
1
Degrees of
freedom Mean square F
2
Factor A SSA I - 1 MSA = SSA/(I - 1) MSA/MSE
Factor B SSB J - 1 MSB = SSB/(J - 1) MSB/MSE
Interaction SSAB (I - 1)(J - 1) MSAB =
SSAB/{(I - 1)(J - 1)}
MSAB/MSE
Error SSE IJ(m - 1) MSE =
SSE/{IJ(m - 1)}
Total SST = 333(x
ijk
- x)
2
n - 1
1
The sum for SST is over all levels for i, j and k, i.e., over all n observations.
2
The F-ratios for the factors are for fixed effects only.
Three Factor Analysis of Variance
With three factors with levels I, J, and K, and m observations for each
factor combination, the analysis of variance model becomes
x
ijku
= a
i
+ b
j
+ c
k
+ (ab)
ij
+ (ac)
ik
+ (bc)
jk
+ (abc)
ijk
+ ,
ijku
, (3.32)
where x
ijku
is the uth observation for level i of factor A, level j of factor
B, and level k of factor C, a
i
, b
j
and c
k
are the main effects of the three
factors, (ab)
ij
, (ac)
ik
and (bc)
jk
are terms that allow for first order
interactions between pairs of factors, (abc)
ijk
allows for a three factor
interaction (where the mean for a factor combination is not just the
sum of the factor and first order interaction effects), and ,
ijku
is a
© 2001 by Chapman & Hall/CRC
random component of the observation, independent of all other terms
in the model with a mean of zero and a constant variance.
The analysis of variance table generalises in an obvious way in
moving from two to three factors. There are now sums of squares,
mean squares and F-ratios for each of the factors, the two factor
interactions, the three factor interaction, and the error term, as shown
in Table 3.7. This table is for all effects fixed. With one or more
random effects some of the F-ratios must be computed differently.
Example 3.2 Survival of Trout in a Metals Mixture
This example concerns part of the results from a series of experiments
conducted by Marr et al. (1995) to compare the survival of naive and
metals-acclimated juvenile brown trout (Salmo trutta) and rainbow
trout (Oncorhynchus mykiss) when exposed to a metals mixture with
the maximum concentrations found in the Clark Fork River, Montana,
USA.
In the trials called challenge 1 there were three groups of fish
(hatchery brown trout, hatchery rainbow trout, and Clark Fork River
brown trout). Approximately half of each group (randomly selected)
were controls that were kept in clean water for three weeks before
being transferred to the metals mixture. The other fish in each group
were acclimated for three weeks in a weak solution of metals before
being transferred to the stronger mixture. All fish survived the initial
three week period, and an outcome variable of interest was the
survival time of the fish in the stronger mixture. The results from the
trials are shown in Table 3.8.
The results from this experiment can be analysed using the two
factor analysis of variance model. The first factor is the type of fish,
which is at three levels (two types of brown trout and one type of
rainbow trout). This is a fixed effects factor because no other types of
fish are being considered. The second factor is the treatment, which
is at two levels (control and acclimated). Again this is a fixed effects
factor because no other treatments are being considered. A slight
complication is the unequal numbers of fish at the different factor
combinations. However, many statistical packages can allow for this
reasonably easily. The analysis presented here was carried out with
the general linear model option in MINITAB (Minitab Inc., 1994).
© 2001 by Chapman & Hall/CRC
Table 3.7 Form of the analysis of variance table for a three factor model with fixed effects, and with I levels for
factor A, J levels for factor B, K levels for factor C, m observations for each combination of factor levels, and n =
IJMm observations in total
Source of variation Sum of Squares
1
Degrees of freedom Mean square F
2
Factor A SSA I - 1 MSA = SSA/(I - 1) MSA/MSE
Factor B SSB J - 1 MSB = SSB/(J - 1) MSB/MSE
Factor C SSC K - 1 MSC = SSC/(K - 1) MSC/MSE
AB Interaction SSAB (I - 1)(J - 1) MSAB = SSAB/{(I - 1)((J - 1)} MSAB/MSE
AC Interaction SSAC (I - 1)(K - 1) MSAC = SSAC/{(I - 1)(K - 1)} MSAC/MSE
BC Interaction SSBC (J - 1)(K - 1) MSBC = SSBC/{(J - 1)(K - 1)} MSBC/MSE
ABC Interaction SSABC (I - 1)(J - 1)(K - 1) MSABC = SSABC/{(I - 1)(J - 1)(K - 1)} MSABC/MSE
Error SSE IJK(m - 1) MSE = SSE/{IJK(m - 1)}
Total SST = 3333(x
ijk
- x)
2
n - 1
1
The sum for SST is over all levels for i, j , k and m, i.e., over all n observations.
2
The F-ratios for the factors and two factor interactions are for fixed effects only.
© 2001 by Chapman & Hall/CRC
© 2001 by Chapman & Hall/CRC
Table 3.8 Results from Marr et al.'s (1995) challenge 1 experiment
where the effect of an acclimatization treatment on survival was
examined for three types of fish. The tabulated values are survival
times in hours
Hatchery Brown
Trout
Hatchery Rainbow
Trout
Clark Fork Brown
Trout
Control Treated Control Treated Control Treated
8 10 24 54 30 36
18 60 24 48 30 30
24 60 24 48 30 30
24 60 24 54 36 30
24 54 24 54 30 36
24 72 24 36 36 30
18 54 24 30 36 42
18 30 24 18 24 54
24 36 24 48 36 30
18 48 24 36 36 48
10 48 24 24 36 24
24 42 18 24 30 54
24 54 18 48 18 54
24 10 24 48 30 36
10 66 30 36 24 30
18 42 30 42 30 90
24 36 30 36 24 60
24 42 30 36 30 66
24 36 36 42 42 108
24 36 30 36 42 114
24 36 30 36 24 108
24 36 30 36 10 114
24 36 30 36 24 120
24 36 30 42 24 90
24 30 36 42 24 96
24 30 36 36 36 30
24 36 36 36 24 108
24 30 36 36 30 108
24 36 36 36 18 108
24 36 36 24 102
102
120
n 30 30 30 29 30 32
Mean 21.53 41.27 28.20 39.10 28.93 69.00
Std Dev. 4.72 14.33 5.49 8.87 7.23 35.25
A second complication is the increase in the variation in the
survival time as the mean increases. It can be seen, for example, that
the lowest mean survival time shown in Table 3.8 (21.53 hours) is for
control hatchery brown trout. This group also has the lowest standard
© 2001 by Chapman & Hall/CRC
deviation (4.72 hours). This can be compared with the highest mean
survival time (69.00 hours) for acclimated Clark Fork River brown
trout, which also has the highest standard deviation (35.25 hours). It
seems, therefore, that the assumption of a constant variance for the
random component in the model (3.31) is questionable. This problem
can be overcome for this example by analysing the logarithm of the
survival time rather than the survival time itself. This largely removes
the apparent relationship between means and variances.
The analysis of variance is shown in Table 3.9 for logarithms to
base 10. Starting from a model with no effects, adding the species
factor gives a very highly significant improvement in the fit of the
model (F = 17.20, p = 0.000). Adding the main effect of treatment
leads to another very highly significant improvement in fit (F = 108.39,
p = 0.000). Finally, adding in the interaction gives a highly significant
improvement in the fit of the model (F = 5.72, p = 0.004). It can
therefore be concluded that the mean value of the logarithm of the
survival time varies with the species, and with the acclimation
treatment. Also, because of the interaction that seems to be present,
the effect of the acclimation treatment is not the same for all three
types of fish.
Table 3.9 Analysis of variance on logarithms to base 10 of the daily
survival times shown in Table 3.8
Source of
Variation
Sum of
Squares
1
Degrees
of
Freedom
Mean
Square F
p-
Value
Species 0.863 2 0.431 17.20 0.000
Treatment 2.719 1 2.719 108.39 0.000
Interaction 0.287 2 0.143 5.72 0.004
Error 4.389 175 0.025
Total 8.257 180
1
The sums of squares shown here depend on the order in which effects are
added into the model, which is species, then the treatment, and finally the
interaction between these two factors.
On a logarithmic scale, a treatment has no interaction when the
proportional change that it causes is constant. For the challenge 1
© 2001 by Chapman & Hall/CRC