LANDSCAPE ECOLOGY in AGROECOSYSTEMS MANAGEMENT - CHAPTER 4 potx
Bạn đang xem bản rút gọn của tài liệu. Xem và tải ngay bản đầy đủ của tài liệu tại đây (1.24 MB, 54 trang )
CHAPTER
4
Water Balance in Agricultural
Landscape and Options
for Its Management by Change
in Plant Cover Structure of Landscape
Andrzej K dziora and Janusz Olejnik
CONTENTS
Introduction
General Water Balance
Water Balance of Agricultural Landscape
Structure of Water Balance
Precipitation
Evapotranspiration
Runoff
Factors Determining Water Balance
General Weather and Climatic Conditions
Soil Conditions
Plant Cover and Land Use
Water Management in the Landscape
Water Deficit in the Landscape
Improving Water Retention
Controlling Water Balance by Plant Cover Structure
Impact of Climate Change on Water Balance
References
˛e
0919 ch04 frame Page 57 Tuesday, November 20, 2001 6:26 PM
© 2002 by CRC Press LLC
INTRODUCTION
Owing to unusually strong hydrogen bonds between molecules, water is one of
the most amazing substances in nature. Many of its properties are qualitatively
different from those of other substances participating in processes important for
biosphere functioning — for example, water has anomalous high temperature at
melting and boiling points, one of the highest specific heat and latent heat of
evaporation, the highest dielectric constant, and very high dipole momentum.
By determining the process of solar energy transformation into organic matter
and thereby the conditions of plant growth and development, water determines the
level of agricultural production. Thanks to its enormous thermal properties, water
controls the thermal status of plants and allows the plant body to store a large amount
of thermal energy, which buffers the plant against rapid changes in environmental
temperature. Continuous sufficient flux of water flowing through the soil-plant-
atmosphere system is indispensable for utilizing the potential for the ecosystem to
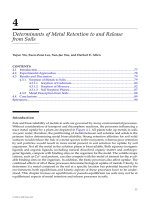
achieve plant growth and high yields. Three scales of water cycle can be distin-
guished (Figure 4.1):
• Global hydrologic cycle (Figure 4.1C), which consists of water exchanged between
oceans and continents through atmospheric circulation and river water flow
• Local hydrologic cycle (Figure 4.1B, marked by a dashed line), including water
exchanged between the land and the atmosphere
• Micro-water cycle (Figure 4.1A) which occurs as water circulates between top
soil layers and near-surface layers of the atmosphere within plant communities
The last cycle is very rarely considered, but its role in creating microclimatological
conditions of agricultural landscapes is very important. In the presence of a dense
Figure 4.1
Water circulation. A — micro cycle, B — local cycle, C — global cycle.
Root absorption
.
.
.
.
.
.
.
.
.
.
.
.
.
.
.
.
.
.
.
.
.
.
.
.
.
.
.
.
C
A
B
Atmospheric flow
Percolation
Evaporation
and
precipitation
Transpiration
Surface
runoff
Ocean
Subsurface runoff
Evaporation
Precipitation
Infiltration
gwl
Root absorption
Distillation
0919 ch04 frame Page 58 Tuesday, November 20, 2001 6:26 PM
© 2002 by CRC Press LLC
plant cover (for example, meadow or rapeseed field) water evaporating from the soil
surface does not pass to the atmosphere but instead condenses on the bottoms of
leaves, remaining within the plant cover, which explains why even during dry
weather a very humid microclimate can exist inside plant cover.
One of the insufficiently recognized problems of formation of water balance is
how the structure of plant cover in agricultural landscapes impacts the structure of
water balance (Ryszkowski and K dziora 1995, K dziora 1999, K dziora and Rysz-
kowski 1999, Valentini et al. 1999, Mills 2000). There are many studies on the impact
of individual elements and characteristics of landscape on individual components
of water balance. But, at the level of landscape, many interactions between processes
in the landscape as well as between individual components of the landscape are
observed. These phenomena are very poorly recognized because their final effects
are not the simple sum of their individual effects (Caswell et al. 1972). The exact
recognition of terrestrial hydrologic processes is very important for global circulation
models (GCM) because the value of these models strongly depends on parameter-
ization of surface processes of water transport and exchange between Earth and
atmosphere (Thomas and Henderson-Sellers 1992, Viterbo and Illari 1994). Studies
thus far show that the more developed a landscape structure is, the higher its
resistance to many threats occurring in the environment. The evolution of nature
brought about very high stability of the Earth’s system, lasting until human civili-
zation started.
The water cycling that stabilized during the long geological evolution has been
disturbed by recent human action (Zektser and Loaiciga 1993). The environment is
subject to very deep drought on the one hand and to flood on the other hand. These
climatic disasters are becoming more frequent and less predictable. The global
distribution of water resources is irregular. Very rarely is there enough precipitation
to ensure soil water moisture favorable for plants during the whole growing season.
In Poland and in most countries in Europe, water demands of plants in the growing
season very often exceed available water supplies — the precipitation and water
retained in the soil. During the summer months, evapotranspiration is higher than
precipitation, leading to decreased soil moisture and lowering of the ground water
table. Central Europe is rather poor in water resources and increased water demands
from the human population and possible climate change brings new challenges in
water management to support sustainable development of agriculture. The great
challenge that faces humankind is to increase water supplies in the agricultural
landscape. The average water deficit in the Wielkopolska region in Poland is equal
to about 100 mm (100 l/m
2
), that is, about 3 km
3
for the entire Wielkopolska region
(total area of the Wielkopolska region is about 30,000 km
2
). It is impossible to collect
such a huge amount of water in artificial reservoirs. Thus, the technical efforts must
be supported by the use of natural processes and mechanisms as well as by proper
management of the landscape. Increasing soil and surface water retention, conser-
vation of water by reducing crop evapotranspiration and surface runoff, and increas-
ing water use efficiency are the tools for improving water management in the
landscape. The development of alternative strategies of water management in the
agricultural landscape is necessary for the future of agriculture in central Europe.
˛e ˛e ˛e
0919 ch04 frame Page 59 Tuesday, November 20, 2001 6:26 PM
© 2002 by CRC Press LLC
GENERAL WATER BALANCE
The structure of water balance depends mainly on precipitation and temperature.
Total world water volume is nearly 1.4 billion km
3
, but 96.5% of it is gathered in
oceans (Table 4.1). Fresh water constitutes only about 2.5%, more than two thirds
of which is ice-bound. The most active part of the world’s water is in the atmosphere
and soil, constituting only 0.08% of fresh water and 0.002% of the total world water
(Baumgartner and Reichel 1975, UNESCO 1978, Lwowich 1979). During a year,
577 km
3
evaporates and falls as rain, which means that atmospheric water must
circulate more than 40 times during a year because its total volume is equal to about
14 km
3
. Consequently, atmospheric water plays an important role in energy and
mass transporting. The water balances of European countries vary considerably
(Table 4.2). The lowest precipitation occurs in Poland, the Czech Republic, and
Hungary (a little more than 600 mm). Because of its high evapotranspiration, Hun-
gary’s climatic water balance (precipitation minus evapotranspiration) is the lowest.
The ratio of evapotranspiration to precipitation is also highest in Hungary (0.90)
and very high in other central European countries (Figure 4.2). In Poland, especially
in the Wielkopolska and Kujawy regions, the ratio of evapotranspiration to precip-
itation is also very high (Figure 4.3). In other European countries, including Spain,
the ratio of evapotranspiration to precipitation (calculating for the whole country)
does not exceed 0.70. The water supplies can be well characterized by water
resources calculated per capita (Figure 4.4). This criterion shows that the most
strained water conditions occur in Hungary and the Netherlands. But, if we consider
transit water (water from a river that flows through a country but originates elsewhere,
such as the Danube in Hungary or Slovakia, or the Rhine in Germany and Nether-
lands), the worst situation exists in Poland. Poland has the least water supply per
capita (1.63 thousand m
3
). Runoff coefficient (runoff/precipitation) is the lowest in
Table 4.1
Water in the Hydrosphere
Water
Volume
(thousands km
3
)
Percent of
Total Volume
Percent of
Fresh Water
Oceans 1,338,000.00 96.5
Glaciers and snow cover 24,364.10 1.725 69.6
Ground water 23,400.00 1.69 30.1
Fresh water 10,530.00 0.76
Salt water 12,870.00 0.93
Lakes 176.40 0.013 0.26
Fresh water 91.00 0.007
Salt water 85.40 0.006
Soil water 16.50 0.0012 0.05
Atmospheric water 12.90 0.001 0.04
Wetlands 11.47 0.0008 0.03
Rivers 2.12 0.0002 0.006
Biological water 1.12 0.0001 0.003
Total 1,385,984.61 100.0 100.0
Fresh water 35,029.21 2.5
Source:
UNESCO 1978.
0919 ch04 frame Page 60 Tuesday, November 20, 2001 6:26 PM
© 2002 by CRC Press LLC
Hungary (Table 4.1). In Poland it is lower than 30%, but in some regions, especially
in the Wielkopolska, the runoff coefficient is lower than 15%. So, the Great Hun-
garian Plain and Great Poland Plain suffer from water deficits much more frequently
than any other region in Europe (Kleczkowski 1991). An especially high risk of
drought occurs in the central Wielkopolska and Kujawy regions (Figure 4.5). The
Table 4.2
Water Balance of Select Countries in Europe
Country
Precipitation
P
Evapotranspiration
E
Runoff
R = P — E
Runoff
per capita
(10
3
m
3
) E/P R/P
Europe 733 415 318 5.11 0.57 0.43
Poland 604 424 180 1.72 0.70 0.30
Germany 725 430 295 1.4 (1.91) 0.59 0.41
Hungary 610 519 90 0.81 (3.81) 0.85 0.15
Czech Republic
and Slovakia
735 442 293 1.9 (4.73) 0.60 0.40
Netherlands 676 427 249 0.78 (6.86) 0.63 0.37
Spain 636 380 255 3.88 0.60 0.40
France 965 541 424 4.57 0.56 0.44
Russia 620 410 210 6.23 0.66 0.34
Finland 549 234 315 22.5 0.43 0.57
Sweden 664 233 431 24.1 0.35 0.65
Norway 1343 182 1160 96.9 0.14 0.86
Figures in parentheses relate to the case when transit water is included, the Danube in Hungary,
the Czech Republic, and Slovakia, and the Rhine in Germany and the Netherlands.
Source:
Lwowicz 1979.
Figure 4.2
Ratio of real evapotranspiration to precipitation (E/P) for select countries in Europe.
H — Hungary, C — Czech Republic, P — Poland, S — Slovakia, N — the
Netherlands, Sp — Spain, G — Germany, F — France, Fi — Finland, I — Italy,
N — Norway.
0.00
0.10
0.20
0.30
0.40
0.50
0.60
0.70
0.80
0.90
1.00
PCSHFIN
Sp
FiGN
Country
Ratio E/P
0919 ch04 frame Page 61 Tuesday, November 20, 2001 6:26 PM
© 2002 by CRC Press LLC
increase of 10% in the area subject to drought will reduce the Warta River flow the
following year by 5.5 m
3
/s, that is, about 4% of the average flow in the years without
drought (Figure 4.6). Another unfavorable phenomenon for agriculture is the increas-
ing variation of precipitation from year to year. Normally, annual distribution of
precipitation is favorable for vegetation in Poland. Abundant precipitation occurs in
summer, but because of very high evapotranspiration it is not enough to cover water
needs of plants (Figure 4.7).
Figure 4.3
Ratio of real evapotranspiration to precipitation (E/P) in Poland.
Figure 4.4
Water resources per capita [10
3
·m
3
]. P — Poland, C — Czech Republic, H —
Hungary, G — Germany, I — Italy, Sp — Spain, F — France, N — the Netherlands,
F — Finland.
0
5
10
15
20
25
PCH
F
IN
Sp
FiG
Country
Without inflow
Including inflow
Water resources
[10
3
m
3
/per capita]
0919 ch04 frame Page 62 Tuesday, November 20, 2001 6:26 PM
© 2002 by CRC Press LLC
Figure 4.5
Map of drought risk in Wielkopolska. Class 1 — lowest risk, class 7 — highest risk.
Figure 4.6
Dependence of annual flow of Warta River on percentage of total area impacted
by drought during the previous year.
0 10 20 30 40 50 60 70 80 90 100
0
20
40
60
80
100
120
140
160
y = -0.5222x + 137.54
R = 0.5622
2
Percentage of total region area that suffered from drought during the previous year
Average annual flow of Warta River [m
s
]
3
-
1
0919 ch04 frame Page 63 Tuesday, November 20, 2001 6:26 PM
© 2002 by CRC Press LLC
All circumstances mentioned above show that water conditions in the agricultural
landscape of Poland, as well as in all of Central Europe, require very wise and
economical water management, which can be executed only when the factors deter-
mining components of water balance are well recognized, thus allowing scientists,
decision makers, local government officials, and farmers to construct a proper strat-
egy for sustainable development of rural areas.
WATER BALANCE OF AGRICULTURAL LANDSCAPE
Water serves three basic functions in nature:
• It is the building material of living organisms.
• It is the medium transporting materials in the environment (chemical substances
in soil and plants, dissolved and suspended material in waters, soil, and rock
materials in erosion processes).
• It facilitates energy transport (as sensible and latent heat) by oceanic and atmo-
spheric circulation.
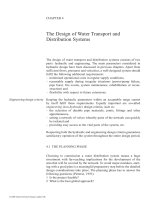
The energy needed to evaporate a 1-mm water layer from 1 m
2
of water, that is,
1 kg water, is enough to heat a 10-cm water layer by 6°C and a 33-m high atmospheric
layer by as much as 60°C (Figure 4.8). This example shows how important processes
of water phase transformation are for controlling thermal conditions of the landscape.
Water exists in three phases — solid, liquid, and vapor. Continuous transformation
of water from one phase to another is the main mechanism for accumulating or
releasing a large amount of solar energy by ecosystems at the landscape scale, and
for distribution of solar energy all over the Earth at the global scale.
Figure 4.7
Annual course of precipitation (P), potential evapotranspiration (ETP), and real
evapotranspiration (E), the Wielkopolska, 1951–1995.
0
20
40
60
80
100
120
JFMAMJJASOND
Month
Amount of water [mm]
P
E
ETP
0919 ch04 frame Page 64 Tuesday, November 20, 2001 6:26 PM
© 2002 by CRC Press LLC
The strong linkage between energy flow through the landscape and matter cycling
within environment exists. The energy flux is the “driving force” for matter cycling.
The maintenance of steady (within limits) flux of energy and matter is needed to
ensure the stability of a system. The most important task is to ensure proper water
conditions in the landscape because of the multifunctional role of water mentioned
above. Any processes, natural or caused by human activity, that disturb the process
of energy flow and water cycling could have substantial effects on landscape func-
tioning and could create serious threats for sustainable development of the agricul-
tural landscape.
The worsening of water conditions in rural areas has been observed for several
decades. Increasing water deficits, decreasing soil retention ability in the face of
growing water demands are the main threats to agricultural development in central
Europe. The following causes of this situation must be taken into consideration:
• Changes of natural climatic conditions
• Changes in land use and landscape structure leading to simplification of landscape
structure
• Human activity in water management incompatible with fundamental rules of
energy flow and water cycling
The broad studies carried out during the second half of the 20th century showed
that climatic conditions (precipitation and temperature) generally changed too little
to cause the worsening water conditions in Poland (Lambor 1953, Pas awski 1992,
K dziora 1999).
However, an unfavorable phenomenon has been observed recently — the increas-
ing amplitude of precipitation variation. The periods of high precipitation causing
erosion problems alternating with drought periods appear more frequently. In the
period 1961–1980 in the Kujawy region, there were 14 periods of drought lasting
from 30 to 60 days (Konopko 1985). Evapotranspiration, the outgoing component
Figure 4.8
Effect of applying the same amount of energy for evaporation, water heating, and
air heating.
1 m
1 m
1 m1 m
∆t = 6°C
33 m
10 cm
1 mm
∆t = 60°C
Latent heat of evaporation:
2 450 000 J kg
-1
l
˛e
0919 ch04 frame Page 65 Tuesday, November 20, 2001 6:26 PM
© 2002 by CRC Press LLC
of water balance, as well as wind speed and water saturation deficit, did not change
sufficiently to explain the worsening water condition (Gutry-Korycka 1978). Obser-
vations of ground water level show that hydrogeological conditions did not change
significantly either (Wójcik 1998). A deep variation in the depth of ground water
level occurred, but no trend has been observed in the agricultural landscape. Depletion
of ground water level is observed only in the places where very deep transformations
of land surface had occurred, for example, brown coal mines or gravel excavations.
The last millennium was a period of increasing transformation of the environment
in central Europe. At the beginning of the period in the Wielkopolska region, the
ground water level was about 1 m lower than it is today mainly because of high
evapotranspiration of forests, which covered three quarters of the area (Czubi ski
1947). Precipitation was the same as today (Kaniecki 1991). The rate of land trans-
formation increased in the 15th century as colonization increased. At the end of the
14th century, forests covered more than 50% of the total country area, while arable
land constituted only 18% of the total area. At the end of the 16th century, forested
area decreased to 41%, to 31% at the end of the 18th century, and to 21% just before
World War I (Miklaszewski 1928, B aszczyk 1974). Cleared areas were converted to
arable land. Also, pastures and meadows were very quickly converted to arable land.
In 1750, the area of grassland was equal to arable land area, in 1850 it dropped to
half that of arable land, and in 1950 the grassland area was five times smaller than
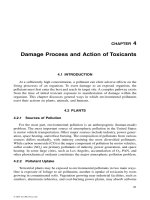
the area of arable land (Figure 4.9). Decreasing water retention in the environment,
accelerated runoff, and decreasing precipitation are the main negative results of land-
use changes, especially deforestation. Increasing forestation by 1% increases annual
precipitation by 2 to 18 mm (Bac 1968) and decreases runoff (Dubrowicz 1956).
After glacier regression, the area that is now Poland was full of many lakes,
ponds, and wetlands. Since the human economy started its intensive development
Figure 4.9
Change in ratio of meadows and pastures to arable lands in the Wielkopolska.
1750
1850
1950
0.2
0.4
0.6
0.8
1.0
Yea
r
´
n
l
0919 ch04 frame Page 66 Tuesday, November 20, 2001 6:26 PM
© 2002 by CRC Press LLC
in the Middle Ages, people have made many mistakes in water management. They
began to regulate riverbanks, to straighten streams, and to drain wetlands (Kow-
alewski 1988, Mathias and Moyle 1992). These activities led to increased river
current speed and cutting into the bed, as well as depleted water content in the
environment, especially in soils. Many of these activities were done well from the
engineering point of view but were completely wrong from the ecological point of
view. They provided new land for agriculture, but they increased the amount of water
quickly removed from the landscape, destroying many small ponds and degrading
soil (Dembi ski 1956, Kosturkiewicz and K dziora 1995, Ryszkowski and K dziora
1996a). Aridification of soil cover increases organic matter decomposition and
decreases the soil’s ability to retain water. The introduction of new agricultural
technology, especially mechanization, accelerates the disappearance of many post-
glacial midfield ponds, ditches, and other small meadow strips and wetlands. The
use of electric mills instead of water mills almost totally removed small millponds
(Go aski 1988). Of 1208 water mills located in the Wielkopolska region in an area
of 15,000 km
2
in 1790, only 70 remained in 1960 (Figure 4.10).
Thus, land-use changes and errors in water management must be regarded as
the main causes of the present water conditions, which are unfavorable for agricul-
ture. This unfortunate landscape management brought about simplified plant cover
structure and decreased the total amount of water in the landscape. This approach
was taken mainly because of human ignorance of the interaction among processes
of energy flow and water cycling coupled with the aim to increase agricultural
production and benefits irrespective of environmental costs.
Figure 4.10
Disappearance of water millponds in the south Wielkopolska region.
500
1000
Number of ponds
1800 1850 1900 1950 2000
1790 1830 1890 1930 1960
Yea
r
´
n
˛e
˛e
l
0919 ch04 frame Page 67 Tuesday, November 20, 2001 6:26 PM
© 2002 by CRC Press LLC
STRUCTURE OF WATER BALANCE
There are three water fluxes (solid, liquid and vapor) entering and leaving the
system under consideration. For estimation of water balance, the incoming fluxes
are denoted as positive while the outgoing ones are marked as negative. A set of all
these fluxes and water content changes in the system is called the water balance
equation. The importance of the individual fluxes depends on the time and space
scale in which the water balance is estimated. With a shorter period and smaller area,
more fluxes and water content changes must be taken into consideration (Gilvear
et al. 1993). Going from a field and daily scale to a global and long-term scale, one
can exclude more and more components of the water balance equation.
On the field scale and for a short period (one or a few days) the water balance
equation for soil layers is written as follows:
where P is precipitation (positive), E is evapotranspiration (negative) or condensation
(positive), H
S
is surface runoff (if surface inflow is higher than surface outflow, the
H
s
is positive; otherwise it is negative), H
g
is subsurface inflow or outflow (including
lateral flow), D is percolation to the ground water (negative) or capillary upward
flow (positive),
∆
R
S
is change of surface water retention,
∆
R
G
is change of soil water
retention, and
∆
R
I
is change of plant cover water retention (change of interception).
Lengthening the time scale to a month or longer, we can neglect the change of
plant cover retention,
∆
R
I
, and increasing the scale to a catchment, the water balance
equation can be expressed as follows:
Increasing the time scale to a decade or more (if neither turning to wetlands nor
desertification is observed), we can neglect the change of water retention and write
the equation of catchment water balance as follows:
Finally, for the earth surface the water balance equation is the following:
The structure of the catchment water balance depends mainly on:
• Variability and time distribution of precipitation, the parameter which is discrete
in time and space
• Physiographic characteristics of catchment (slope, relief, soil cover)
• Density and type of plant cover and its development stage
• Land use
PEH H D R R R
SG S G
++ + ++ + + =∆∆∆
1
0
PEH H R R
SG S G
++ + + + =∆∆ 0
PEH++=0
PE+=0
0919 ch04 frame Page 68 Tuesday, November 20, 2001 6:26 PM
© 2002 by CRC Press LLC
The size of catchment has significant impact on the accuracy of the water balance
estimation. In the case of small catchment, the incompatibility of topographic catch-
ment and hydrological catchment can introduce an essential error in estimating water
balance. If arrangement of the permeable and impermeable layers is such that a part
of subsurface water runoff can flow out of catchment (Figure 4.11) the evapotrans-
piration calculated as the difference between precipitation and outflow measured at
point A can be overestimated. As the part of catchment from which water flows
increases, the error increases. This problem disappeared at the landscape level.
At the landscape level, the following four components of water balance must be
taken into consideration: precipitation, evapotranspiration, runoff, and soil moisture
changes. The last component disappears when a long period is analyzed. One must
keep in mind that processes and fluxes important at a lower level of environmental
organization form the higher system and can become less important at the level of
this higher system, but they are also controlled by mechanisms occurring at this
higher level of environmental organization (Tansley 1935, Allen and Starr 1982,
O’Neill et al. 1986). For example, water vapor fluxes originating at the level of
individual ecosystems depended on microclimatic conditions of the active surface
to create the total water vapor flux outgoing from the landscape to the atmosphere.
But they are controlled by meteorological conditions of the landscape, which deter-
mine the intensity of energy and matter exchange in the atmospheric boundary layer.
Similarly, the process of heat advection is very important at the field or ecosystem
levels, much less important at the landscape level, and can be negligible at the
regional level.
Figure 4.11
Incompatibility of hydrological and topographic catchment and its impact on
ground water outflow.
Boundary of hydrological
catchment
Boundary of topographic
catchment
Impermeable layer
0919 ch04 frame Page 69 Tuesday, November 20, 2001 6:26 PM
© 2002 by CRC Press LLC
Precipitation
Precipitation is a vital water flux entering the landscape and largely determining
the water balance structure. Annual distribution and intensity of precipitation are
factors determining conditions of plant production and the quantity of annual runoff.
Precipitation is the only component of water balance not under human control at
the landscape level. All other components are subject to human activity. The average
annual precipitation of the Wielkopolska region ranges from about 580 mm to 650
mm (Table 4.3). The average value of annual precipitation for a period of 100 years
is 594 mm (Pas awski 1990). The average amount of rainfall in the growing season
(from the third 10-day period of March to the end of October) varies between 400
and 450 mm. In comparison with other regions of Poland, the Wielkopolska region
has one of the lowest amounts of precipitation. However, the distribution of precip-
itation over the entire year is favorable for agriculture. The amount of summer
precipitation (May to August) is 271 mm, or 46% of annual precipitation.
Both 24-h and monthly rainfall distribution fit a gamma distribution, as can be
seen in Figures 4.12 and 4.13. The density function of such a distribution, f(x), is
given by the following equation (K dziora 1996b):
where k and
λ
are parameters of gamma distribution and
Γ
(k) is the gamma function.
The specific equations for daily and monthly precipitation are presented in
Figures 4.12 and 4.13.
Table 4.3
Average Monthly Precipitation (mm) in Different Periods in Turew, Wielkopolska
Month
Period
1881–1930 1921–1970 1951–1970 1971–1985 1881–1995
January 3938404339
February 2836373332
March 36 33 37 38 35
April 43 42 44 46 43
May 5559684856
June 53 70 69 68 62
July 86 76 84 83 82
August 70 74 78 68 71
September 53 52 50 43 51
October 39 50 48 41 43
November 41 42 50 42 42
December 38 38 50 37 38
Growing season 410 434 453 410 410
Year 581 610 655 590 594
l
˛e
fx
k
xe
k
kkx
()
=
()
⋅⋅
−
λ
Γ
–1
0919 ch04 frame Page 70 Tuesday, November 20, 2001 6:26 PM
© 2002 by CRC Press LLC
The median 24-h rainfall distribution is 2.2 mm, and there is only a 10%
probability that the 24-h rainfall will exceed 9.6 mm or be less than 0.4 mm. The
median of the average monthly rainfall distribution is 35 mm. There is a 10%
probability that the monthly amount of rainfall will be less than 10 mm or more
than 85 mm. Comparing the latter amount with the average monthly potential evapo-
transpiration (Table 4.4) shows that irrigation is necessary in the summer months in
the Wielkopolska region. On average, for the growing seasons of 1978–1985, about
65% of the days were rainy days, while during the 1920–1970 period the average
number of rainy days per month ranged from 10 in September to 14 in January. The
mode of monthly rainfall distribution is 20 mm, and this means that in this region
the most frequent monthly rainfall reaches 20 mm. However, a higher amount of
rainfall occurs in the summer months, and a lower amount occurs in winter.
The structure of landscape has no direct impact on precipitation, but by influencing
surface processes it can modify the local water cycling, which can indirectly affect
precipitation. Even if landscape structure has no distinct impact on the amount of
precipitated water, it has significant impact on the amount of rainfall that reaches the
soil surface — the richer the plant cover, the greater the amount of rainfall intercepted
by it. This water does not reach the soil surface but primarily evaporates, and thus
diminishes the loss of soil water supplies (McCulloch and Robinson 1993).
Figure 4.12
Probability density function f(x) and cumulative distribution F(x) of 24-h precipi-
tation in the growing season (March 21–October 31) in the Wielkopolska region,
Poland. a — diagram of distribution.
0.1
0.2
0.3
0.1
0.2
0.3
0.4
0.5
0.6
0.7
0.8
0.9
48
12
16
20 24 28
density function f(x)
F(9.6) =0.9
F(2.2) = 0.5
F(0.4) = 0.1
24-h precipitation
a
f(x)
F(x)
f(x) = 0.2866 ⋅ x
-0.23
⋅ e
-0.25 ⋅ x
0919 ch04 frame Page 71 Tuesday, November 20, 2001 6:26 PM
© 2002 by CRC Press LLC
Evapotranspiration
Water evaporation depends on many environmental factors, but mainly on solar
energy flux and aerodynamic characteristics of the ground surface and boundary layer
of the atmosphere. Seasonal variation of energy flux and meteorological conditions,
Figure 4.13
Probability density function f(x) and cumulative distribution F(x) of monthly pre-
cipitation in the growing season (March 21–October 31) in the Wielkopolska
region, Poland. a — diagram of distribution.
Table 4.4 Average Monthly Potential and Real Evapotranspiration
in the Turew Landscape, Poland, 1951–1970
Month
Precipitation
Evapotranspiration [mm]
ETP/P E/P
P [mm] Potential ETP Real E
January 39 15 15 0.38 0.38
February 32 17 17 0.53 0.53
March 35 29 25 0.83 0.71
April 43 49 45 1.14 1.05
May 56 85 67 1.52 1.20
June 62 112 82 1.81 1.32
July 82 107 84 1.30 1.02
August 71 91 71 1.28 1.00
September 51 56 36 1.10 0.71
Oktober 43 30 22 0.70 0.51
November 42 18 17 0.43 0.40
December 38 14 14 0.37 0.37
JJA 215 310 237 1.44 1.10
Growing season 410 540 416 1.32 1.01
Year 594 623 495 1.05 0.83
0 20 40 60 80 100 120 140 160 180 200
0.5
1.0
0.01
0.02
0.2
0.1
F(x)
monthly precipitation [mm]
X
Density function
Diagram of distribution
a
f(x)
F(85) = 0.9
F(35) = 0.5
F(10) = 0.1
f(x) = 0.0026 ⋅ x
0.9
⋅ e
-0.043 ⋅ x
0919 ch04 frame Page 72 Tuesday, November 20, 2001 6:26 PM
© 2002 by CRC Press LLC
as well as variation of plant development stage, cause essential div ersity of evapo-
transpiration in space and in time (Penman 1948, K dziora 1999).
In the agricultural landscape of the Wielkopolska during three summer months
(June, July, and August) 237 mm of water can be evaporated, during the warm half-
year (April to September) 416 mm, and during the whole year 495 mm. The annual
precipitation in the Wielkopolska region amounts to about 600 mm (Table 4.4),
(K dziora 1996b). During the warm period, potential evapotranspiration exceeds
precipitation. Actual evapotranspiration exceeds precipitation considerably during
May and June, but during April and July it exceeds precipitation only slightly.
The 24-h amount of potential evapotranspiration shows a gamma distribution
(Figure 4.14). The average value for five growing seasons (1981 to 1985), from April
to September, was 2.66 mm; however, the mode of this distribution was 2.2 mm.
There is only a 10% probability that the 24-h potential evapotranspiration in the
agricultural landscape of the Wielkopolska region will exceed a value of 4.2 mm,
and a 10% probability that it will be lower than 1.2 mm.
During the monthly course of potential evapotranspiration, the maximum value
is observed at the end of June and beginning of July when it reaches 110 mm per
month, while the lowest value occurs in December or January and falls as low as
14 mm per month (Table 4.4).
Runoff
The amount of water outgoing from the catchment depends on many factors, of
which the most important are intensity and spatial distribution of precipitation,
density and structure of plant cover, and slope and hydropedological properties of
Figure 4.14
Probability density function f(x) and cumulative distribution F(x) of 24-h potential
evapotranspiration in the growing season (March 21–October 31), Turew, Wielko-
polska.
0.20.1
0.40.2
0.6
0.3
0.80.4
1.0
0246
f(x)
Frequency diagram
Probability density function
F(x)
F(4.2)=0.9
F(2.41)=0.5
F(1.23)=0.1
ETP [mm 24 hours
-1
]
f(x) = 0.987
•
x
3.99
•
e
-1.88x
˛e
˛e
0919 ch04 frame Page 73 Tuesday, November 20, 2001 6:26 PM
© 2002 by CRC Press LLC
the soil (Ben-Hur et al. 1995). One of the most important factors is the relation
between infiltration rate and intensity of rainfall. Thus, in the case of low infiltration
capacity, rainfall intensity exceeding the basic infiltration rate cannot infiltrate the
soil surface, and it becomes wholly or partly surface runoff (Figure 4.15). In the
case analyzed, the intensity of rainfall during a rainstorm lasting 10 h oscillated
between 3 and 6 mm/h. It was higher than the infiltration rate, which changed from
4 mm/h (at the beginning of the rain) to 2.4 mm/h at the end (basic infiltration rate).
As a result of such a relation, of the 42 mm of rainfall, only 31 mm of rain infiltrated
the soil, and 11 mm formed the surface runoff.
Land use and plant cover structure are the other important factors in formation
of runoff. The time lapse of landscape reaction on intensity of rainfall is greater in
the presence of rich plant cover, and the maximum runoff is reduced in comparison
with bare soil (Figure 4.16). On average in the Wielkopolska region, surface runoff
accounts for approximately 13 to 20% of rainfall, but sometimes it can reach as
much as 50 to 60% (Pas awski 1990). Such conditions are, of course, unfavorable
for agriculture because of soil erosion, especially on sloping, light bare soil surfaces.
That part of the rainwater not retained by the soil profile percolates through the soil,
and leaches and dislocates a material within the soil profile to the ground water.
Thus, water from precipitation that runs over the soil surface or percolates
through the soil profile plays a most important role in processes of transporting
matter and nutrients in agricultural landscapes. Enriching the landscape with any
elements by slowing down the surface runoff (shelterbelts, meadow strips, bushes,
and so on) is the best tool for counteracting soil erosion and waste of water during
rainstorms. In fact, such landscape elements can convert the unfavorable effects of
rainstorms into a favorable process of water accumulation within the landscape.
Figure 4.15
Formation of surface runoff.
1
2
3
4
5
5
10 15
Hour
Precipitation and infiltration intensity [mm h
-1
]
Precipitation, P = 45mm
Infiltration, I = 39mm
Runoff, Rs = 6mm
6
Rs
P
45
=
=
0.13
Instantaneous infiltration
Precipitation
Runoff
l
0919 ch04 frame Page 74 Tuesday, November 20, 2001 6:26 PM
© 2002 by CRC Press LLC
FACTORS DETERMINING WATER BALANCE
Many factors determine the values of individual water fluxes and water balance
components; they can be divided into three groups:
• General weather and climatic conditions
• Physical and hydraulic features of soil
• Plant covers characteristics
Many relations and much feedback exist among individual factors, factors and water
balance components, and components themselves. As a result of all these mecha-
nisms and interactions, water balance structure shows very high changeability, in
both time and space (Kosturkiewicz et al. 1991, K dziora 1994).
General Weather and Climatic Conditions
The total amount of water coming into the landscape as well as potential and
real evapotranspiration mainly depends on climatic conditions, but temporal and
spatial variability of these phenomena depend on weather conditions, in addition to
plant cover (K dziora et al. 1987a,b). The broad experimental investigations carried
out by the Agrometeorology Department in different climatic zones allow us to
understand how interaction between weather conditions and plant cover affect the
Figure 4.16
Intensity, timing, and time lapse (Ts) of surface runoff from arable land and from
a forest.
Intensity of runoff
Time
arable land
forest
Ts
Ts
˛e
˛e
0919 ch04 frame Page 75 Tuesday, November 20, 2001 6:26 PM
© 2002 by CRC Press LLC
water balance of the landscape. The investigations were conducted in a semi-desert
area in Kazakhstan near Alma-Ata, a steep zone near Kursk, Russia, transit climate
conditions near Turew, Poland and Müncheberg, Germany, humid zone near Ces-
sieres, France, and arid climatic zone near Zaragoza, Spain (K dziora et al. 1994).
The solar energy flux is high in the arid climatic zone, but the very high surface
temperature causes high-earth long wave radiation, and low concentrations of water
vapor in the atmosphere cause low atmospheric reradiation toward the Earth’s sur-
face. Thus net radiation is not as high as in the Mediterranean climate but is higher
than in humid climatic zones (Table 4.5). However, this net radiation with a very
high-saturation water-vapor deficit causes very high potential evapotranspiration.
Low precipitation and low soil water retention lead to low real evapotranspiration.
In such conditions, the ratio of ETP/P (potential evapotranspiration to precipitation)
is very high, the ratio of E/P (real evapotranspiration to precipitation) is also high,
but ratio of E/ETP is small. In a transitional climatic zone or semi-arid zone, potential
evapotranspiration is also high but can differ significantly mainly because of tem-
perature and saturation vapor pressure deficit differences as well as length of the
growing season. In the continental climate zone (Kursk), summer air temperature is
higher than in the arid zone (Zaragoza) where spring and autumn months are much
warmer. The growing season in Zaragoza also lasts the whole year, which is much
longer than in Kursk where it lasts 7 months. As a result, net radiation in Zaragoza
is 40% higher than in Kursk, and ETP is higher by about 25%. In humid climatic
conditions (Turew, Müncheberg, Cessieres, Table 4.5) net radiation and potential
evapotranspiration are lower but real evapotranspiration is on the same order, with
the exception of Zaragoza. In all places studied, the ratio of E/P for wheat fields is
above 1.0, but the ratio of E/ETP is less than 1.0. In the case of bare soil, the ratio
of E/P reaches a value near 1.0 in arid or semi-arid zones and about 0.80 in humid
zones. The ratio of E/ETP is very low in dry conditions and reaches a value of about
0.5 in humid climates in the case of bare soil, and about 0.8 in the case of wheat fields.
Table 4.5 Water Balance Components and Their Ratios for Bare Soil and Winter Wheat
Field in Different Climatic Zones during the Growing Season
Site
Rn
MJ·m
–2
P
mm
Bare Soil
Winter Wheat
ETP E E/P ETP/P E/ETP ETP E E/P ETP/P E/ETP
A 1680 119 942 116 0.98 7.94 0.12 955 336 2.83 8.05 0.35
K 1572 342 718 314 0.92 2.10 0.44 730 506 1.48 2.13 0.69
T 1442 375 582 295 0.79 1.55 0.51 592 460 1.23 1.58 0.78
M 1461 355 582 301 0.85 1.64 0.52 592 466 1.31 1.67 0.79
C 1663 494 666 357 0.72 1.35 0.54 685 510 1.03 1.39 0.74
Z 2210 319 1187 304 0.95 3.72 0.26 1188 553 1.73 3.73 0.47
A — Alm-Ata (Kazakhstan), K — Kursk (Russia), T — Turew (Poland), M — Müncheberg (Ger-
many), C — Cessieres (France), Z — Zaragoza (Spain). Rn — net radiation, P — precipitation,
E — real evapotranspiration, ETP — potential evapotranspiration. Growing season is the period
between the day when ascending curve of air temperature crosses 5°C (in spring) and the day
when the descending curve of air temperature crosses 5°C (in autumn).
˛e
0919 ch04 frame Page 76 Tuesday, November 20, 2001 6:26 PM
© 2002 by CRC Press LLC
On the other hand, evapotranspiration depends on humidity during any individual
year (Rosenberg 1974). For example, in the Turew region, in the case of alfalfa, the
ratio of real to potential evapotranspiration was 0.74 in the dry year of 1982 and 0.90
in the moderately moist year of 1983. In the moist year of 1984, this ratio was as
much as 1.0.
The diversity of energy and water fluxes in an agricultural landscape is strongly
influenced by general water conditions in any individual year (Table 4.6). In a dry
year, the difference in total latent heat flux (energy used for evapotranspiration)
between forest (using as much as 1478 MJ · m
–2
for evapotranspiration during the
growing season) and field (using only 892 MJ·m
–2
) was very high, reaching as much
as 586 MJ·m
–2
. This amount of energy is enough to evaporate 235 mm of water.
During a normal year, this difference is lower by about 100 MJ·m
–2
, but during a
wet year it reaches only half of the value of a dry year. The differences between
latent heat flux (LE) of individual landscape elements in wet and dry years were as
follows: 62 MJ·m
–2
for the forest, 147 MJ·m
–2
for the meadow, 350 MJ·m
–2
for the
field, and 302 MJ·m
–2
for the field with shelterbelts. These examples prove the thesis
that plant cover is a stabilizing and buffering factor of water cycling in the landscape.
For a very rich and permanent plant cover (forest), increased moisture habitat causes
increased evapotranspiration only by 25 mm, while for the field, which is covered
by plants growing only during a part of the growing season, this increase is as much
as 140 mm. But if the field is covered by a shelterbelt network, this increase is only
Table 4.6 Latent (LE) and Sensible (S) Heat of Selected Ecosystems in the Growing
Season (21.03 to 31.10) of Dry, Normal, and Wet Years in Turew, as Well as
Their Diversification (
⌬
)
Ecosystem
LE
MJ·m
–2
⌬
MJ·m
–2
S
MJ·m
–2
⌬
MJ·m
–2

S/LE
⌬
MJ·m
–2
␣
LE/Rn
⌬
MJ·m
–2
Dry Year
Meadow 1200 265 0.22 0.80
Field 892 586 638 473 0.71 0.60 0.58 0.27
Field +
Shelterbelts
998 538 0.54 0.63
Forest 1478 165 0.11 0.85
Meadow 1250 215 0.17 0.84
Normal Year
Field 1035 487 495 374 0.48 0.40 0.67 0.21
Field +
Shelterbelts
1078 458 0.42 0.68
Forest 1522 121 0.08 0.88
Meadow 1347 118 0.09 0.90
Wet Year
Field 1242 298 288 185 0.23 0.16 0.81 0.09
Field +
Shelterbelts
1300 236 0.18 0.82
Forest 1540 103 0.07 0.89
0919 ch04 frame Page 77 Tuesday, November 20, 2001 6:26 PM
© 2002 by CRC Press LLC
120 mm. Thus, higher diversification of landscape structure has higher stability of
water cycling and water balance at the landscape level. Also the diversification of
efficiency of the solar energy utilized for evapotranspiration is higher in a dry year
than in a wet year. In a dry year, forest can use as much as 85% of net radiation for
evapotranspiration while the field uses only 58% (Table 4.6). In a wet year, the
efficiency of solar energy utilization by forest and field differs only by 9%. The
increase of habitat moisture causes the increase of the ratio LE/Rn by 4% in the
forest and by 23% in the field. Thus, richer plant cover means higher efficiency of
energy utilization even when a water shortage occurs. In the humid climate of the
Turew region, heat advection above the plant canopy can be observed quite often.
In these cases, plants consume more energy for evapotranspiration than is absorbed
as net radiation.
Weather conditions have a strong impact on the daily course of evapotranspira-
tion (Figure 4.17). This impact is strongly linked with that of plant cover (discussed
Figure 4.17 Daily course of evapotranspiration of sugar beet field (index E
B
) and stubble field
(index E
S
) during sunny and cloudy days, Cessieres, France.
-0.10
-0.05
0.00
0.05
0.10
0.15
0.20
0.25
0.30
0.35
0.40
6 7 8 9 10 11 12 13 14 15 16 17 18 19 20
Hour
-100
-50
0
50
100
150
B
Evapotranspiration [mm hour
-1
]
Net radiation [W m
-2
]
0.20
-0.10
-0.05
0.00
0.05
0.10
0.15
0.25
0.30
0.35
0.40
6 7 8 9 10 11 12 13 14 15 16 17 18 19 20
Hour
-100
-50
0
50
100
150
200
250
300
350
400
Net radiation [W m
-2
]
Evapotranspiration [mm hour
-1
]
Sunny day
Cloudy day
Rn
Rn
E
B
E
B
E
S
E
S
t = 17.2°C. N = 2.1
t = 14.5°C. N = 8.9
E = 3.4 mm
E = 0.3 mm
B
S
E = 1.5 mm
E = 0.7 mm
B
S
A
B
0919 ch04 frame Page 78 Tuesday, November 20, 2001 6:26 PM
© 2002 by CRC Press LLC
later in this chapter). During a sunny day (Figure 4.17) a daily course of plant cover
evapotranspiration is regular, and its intensity can reach a level as high as 0.35 mm/h
in the early afternoon hours. The course of evapotranspiration from bare soil or soil
covered by nonactive plant detritus is quite different. The maximum is a few times
lower, and it decreases before noon. This difference is because plants can use the
water stored in topsoil as well as in the deeper layer of the soil profile. Thus, only
solar energy input limits intensity of evapotranspiration. There is no limit in access
to water supply. In the case of a field without plants, the quickly growing atmospheric
water demands and solar energy input force intensive evaporation but only to the
point when water stored in a thin soil surface layer has been evaporated. In humid
climatic zones, water is usually stored in the thin soil layer during the nocturnal
condensation process. When this water is exhausted, moisture of the soil surface
layer decreases, causing the reduction of hydraulic conductivity in this layer, which
finally leads to a decrease in or a halt to the evaporation process. In such conditions,
condensation is usually observed in late afternoon or early evening. During a cloudy
day (Figure 4.17) the daily course of evapotranspiration is irregular, maximum
evapotranspiration intensity is low, and differences between a plant-covered field
and field without plants are not significant.
The impact of solar energy flux on the intensity of evapotranspiration increases
simultaneously with increasing plant development stage (Figure 4.18), (K dziora
et al. 2000). During the days with low solar flux (Rn < 40W·m
–2
) the differences
between evapotranspiration of a field covered by poorly developed plants (plant
development stage <0.3) and one with well-developed plant cover (plant development
Figure 4.18 Impact of plant development stage (f) and net radiation (Rn) on evapotranspiration
within an agricultural landscape in the Wielkopolska region. (Site and plant spe-
cies are not distinguished.)
˛e
<0.3
0.3-0.8
>0.8
<40
40-80
80-120
120-160
>160
0
1
2
3
4
5
6
Plant development stage
Net radiation. Rn [W m
-2
]
Evapotranspiration. E [mm]
0919 ch04 frame Page 79 Tuesday, November 20, 2001 6:26 PM
© 2002 by CRC Press LLC
stage >0.8) are very small (first row of blocks at the Figure 4.18). A field uses no
more than 70% of available solar energy for evapotranspiration. As the solar energy
flux increases, the differences in evapotranspiration between fields with different
degrees of plant development as well as the ratio of solar energy used for evapo-
transpiration also increase. During the days with net radiation about 140 W·m
–2
, a
field with poorly developed plant cover can evaporate about 3 mm, using about 75%
of net radiation for evapotranspiration, while a field with well-developed plants can
evaporate as much as 4.5 to 5.0 mm, using total available solar energy for evapo-
transpiration. Thus, more developed plant cover results in a higher degree of energy
use for evapotranspiration (efficiency of energy use for evapotranspiration is
expressed by the alpha ratio, α = LE/Rn).
The second important factor for increasing efficiency of the landscape’s energy
use is habitat moisture. This mutual impact of plant cover and habitat moisture is
strongly affected by general climatic conditions (Figure 4.19). The ratio of energy
needed for evapotranspiration of the total amount of precipitation to energy expressed
as net radiation, denoted as index W1, expresses moisture conditions of any site
(W1 = P·L/Rn). The value of W1 equal to 0.10 means that for evapotranspiration
Figure 4.19 Efficiency of solar energy uses for evapotranspiration during the growing season
as a result of habitat moisture and climatic conditions. Rn — net radiation [W·m
–2
],
LE — latent heat flux density of evapotranspiration [W·m
–2
], P — precipitation
[mm], L — latent heat of evaporation [2,448,000 J·kg
–1
]. A — Alma-Ata (Kaza-
khstan), Z — Zaragoza (Spain), K — Kursk (Russia), T — Turew (Poland), M —
Müncheberg (Germany), C — Cessieres (France).
1
1.5
2
2.5
3
3.5
4
4.5
5
5.5
6
0.10 0.20 0.30 0.40 0.50 0.60 0.70
0.80
k3
k2
k1
AZ
K
T
M
C
W1
k
k1 = 1.6 exp(-5.0 w1)+1.3; r = 0.9918
k2 = 4.0 exp(-6.0 w1)+1.4; r = 0.9942
k3 = 15.0 exp(-7.2 w1)+2.0; r = 0.9985
k1 =
LE/Rn (field, regular moisture)
k2 =
LE/Rn (field, regular moisture)
LE/Rn (irrigated field)
k3 =
LE/Rn (irrigated field)
LE/Rn (bare soil)
LE/Rn (bare soil)
W1=P
.
L/Rn
0919 ch04 frame Page 80 Tuesday, November 20, 2001 6:26 PM
© 2002 by CRC Press LLC
of total precipitation (during a growing season) only 10% of net radiation is needed.
This value changes from about 12% in an arid zone to 75% in a humid zone. The
least efficient energy use is observed in the case of bare soil. In this case evaporation
originates only from a thin surface layer, and it is quickly reduced when that layer
dries, so intensity of this process is low. Higher efficiency will be observed for the
field with plant cover under regular moisture conditions, but the highest efficiency
will occur in the case of irrigated fields. The ratio between individual α ratios,
denoted as the k ratio, is a measure of plant cover and habitat moisture impact on
increasing of energy use efficiency of the fields and the same of the landscape. Thus,
the ratio k
1
(Figure 4.19) shows how the ratio α of plant cover under regular moisture
will increase in comparison with a bare field; however, the ratio k
2
shows how the
ratio α increases when the field is irrigated.
The impact of plant cover or habitat moisture on efficiency of solar energy use
is strongly affected by weather and climatic conditions, and the relationship between
ratio k and climatic index W1 is nonlinear (Figure 4.19). For example, in the humid
climate of Europe, fields with plant cover use about 40% more solar energy for
evapotranspiration than bare soil does (k
1
equals 1.40) (Figure 4.19). In an arid zone
this ratio is equal to 2 (fields with plant cover use solar energy for evapotranspiration
two times more efficiently than bare soil does). The impact of habitat moisture on
efficiency of solar energy use is even higher than the impact of plant cover. In humid
climatic conditions energy use efficiency amounts to nearly 50% but in arid zones
it is as high as 170% (k
2
is 1.5 and 2.7, respectively). Simultaneous impact of plant
cover and irrigation on efficiency of solar energy use shows a synergistic character.
In the humid climate condition of Europe, the ratio k
3
is equal to 2.0, which means
total impact of plant cover and irrigation is equal to 100% (a little more than the
sum of their individual impacts: 40% + 50%), but in arid climates this synergistic
effect is as high as 500%, while the sum of separate effects of plant cover and
irrigation is much lower (100% + 270%). Irrigated and well-developed plant cover
use nearly the same or even more energy for evapotranspiration than that determined
by value of net radiation, independent of general climatic conditions.
Thus, an agricultural landscape shows a much more stabilized efficiency of solar
energy use for evapotranspiration than does any individual element making up that
landscape. The importance of landscape structure for creating stable efficient solar
energy use and for controlling the structure of water and heat balance is higher when
moisture conditions are strained.
Soil Conditions
From the water-balance point of view, soil plays the role of water reservoir. The
amount of water stored in the soil, its availability to plants, and its movement depend
on the soil’s structure and mineral composition as well as on its organic matter
content. Organic matter can absorb much more water than do mineral components.
It also improves soil structure and increases soil water capacity. Very important for
the structure of water balance is the presence or absence of a shallow ground water
level that can ensure intensive evapotranspiration from almost all ecosystems. As
ground water level decreases, fewer and fewer plants can use soil water. Not all
0919 ch04 frame Page 81 Tuesday, November 20, 2001 6:26 PM
© 2002 by CRC Press LLC