Statistical Tools for Environmental Quality Measurement - Chapter 3 potx
Bạn đang xem bản rút gọn của tài liệu. Xem và tải ngay bản đầy đủ của tài liệu tại đây (766.8 KB, 28 trang )
C H A P T E R 3
Hypothesis Testing
“Was it due to chance, or something else? Statisticians have
invented tests of significance to deal with this sort of question.”
(Freedman, Pisani, and Purves, 1997)
Step 5 of EPA’s DQO process translates the broad questions identified in Step 2
into specific testable statistical hypothesis. Examples of the broad questions might
be the following.
• Does contamination at this site pose a risk to health and the environment?
• Is the permitted discharge in compliance with applicable limitations?
• Is the contaminant concentration significantly above background levels?
• Have the remedial cleanup goals been achieved?
The corresponding statements that may be subject to statistical evaluation might be
the following:
• The median concentration of acrylonitrile in the upper foot of soil at this
residential exposure unit is less than or equal to 5 mg/kg?
• The 30-day average effluent concentration of zinc if the wastewater discharge
from outfall 012 is less than or equal to 137 µg/l?
• The geometric mean concentration of lead in the exposure unit is less than or
equal to that found in site specific background soil?
• The concentration of thorium in surface soil averaged over a 100-square-
meter remedial unit is less than or equal to 10 picocuries per gram?
These specific statements, which may be evaluated with a statistical test of
significance, are called the null hypothesis often symbolized by H
0
. It should be
noted that all statistical tests of significance are designed to assess the strength of
evidence against the null hypothesis.
Francis Y. Edgeworth (1845–1926) first clearly exposed the notion of
significance tests by considering, “Under what circumstances does a difference in
[calculated] figures correspond to a difference of fact” (Moore and McCabe, 1993,
p. 449, Stigler, 1986, p. 308). In other words, under what circumstances is an
observed outcome significant. These circumstances occur when the outcome
calculated from the available evidence (the observed data) is not likely to have
resulted if the null hypothesis were correct. The definition of what is not likely is
entirely up to us, and can always be fixed for any statistical test of significance. It is
very analogous to the beyond-a-reasonable-doubt criteria of law where we get to
quantify ahead of time the maximum probability of the outcome that represents a
reasonable doubt.
steqm-3.fm Page 49 Friday, August 8, 2003 8:08 AM
©2004 CRC Press LLC
Step 6 of the DQO process refers to the specified maximum reasonable doubt
probability as the probability of false positive decision error. Statisticians simply
refer to this decision error of rejecting the null hypothesis, H
0
, when it is in fact true
as an error of Type I. The specified probability of committing a Type I error is
usually designated by the Greek letter α .
The specification of α depends largely on the consequences of deciding the null
hypothesis is false when it is in fact true. For instance, if we conclude that the
median concentration of acrylonitrile in the soil of the residential exposure unit
exceeds 5 mg/kg when it is in truth less than 5 mg/kg, we would incur the cost of soil
removal and treatment or disposal. These costs represent real out-of-pocket dollars
and would likely have an effect that would be noted on a firm’s SEC Form 10Q.
Therefore, the value assigned to α should be small. Typically, this represents a
one-in-twenty chance (α = 0.05) or less.
Every thesis deserves an antithesis and null hypotheses are no different. The
alternate hypothesis, H
1
, is a statement that we assume to be true in lieu of H
0
when
it appears, based upon the evidence, that H
0
is not likely. Below are some alternate
hypotheses corresponding to the H
0
’s above.
• The median concentration of acrylonitrile in the upper foot of soil at this
residential exposure unit is greater than 5 mg/kg.
• The 30-day average effluent concentration of zinc if the wastewater discharge
from outfall 012 exceeds 137 µg/l.
• The geometric mean concentration of lead in the exposure unit is greater than
the geometric mean concentration found in site specific background soil.
• The concentration of thorium in surface soil averaged over a 100-square-
meter remedial unit is greater than 10 picocuries per gram.
We have controlled and fixed the error associated with choosing the alternate
hypothesis, H
1
, when the null hypothesis, H
0
, is indeed correct. However, we must
also admit that the available evidence may favor the choice of H
0
when, in fact, H
1
is true. DQO Step 6 refers to this as a false negative decision error. Statisticians call
this an error of Type II and the magnitude of the Type II error is usually symbolized
by Greek letter β . β is a function of both the sample size and the degree of true
deviation from the conditions specified by H
0
, given that α is fixed.
There are consequences associated with committing a Type II error that ought to
be considered, as well as those associated with an error of Type I. Suppose that we
conclude that concentration of thorium in surface soil averaged over a
100-square-meter remedial unit is less than 10 picocuries per gram; that is, we adopt
H
0
. Later, during confirmatory sampling it is found that the average concentration of
thorium is greater than 10 picocuries per gram. Now the responsible party may face
incurring costs for a second mobilization; additional soil excavation and disposal;
and, a second confirmatory sampling. β specifies the probability of incurring these
costs.
steqm-3.fm Page 50 Friday, August 8, 2003 8:08 AM
©2004 CRC Press LLC
The relative relationship of Type I and Type II errors and the null hypothesis is
summarized in Table 3.1.
Rarely, in the authors’ experience, do parties to environmental decision making pay
much, if any, attention to the important step of specifying the tolerable magnitude of
decision errors. The magnitude of both the Type I and Type II error, α and β , has a
direct link to the determination of the number of the samples to be collected. Lack
of attention to this important step predictably results in multiple cost overruns.
Following are several examples that illustrate the concepts involved with the
determination of statistical significance in environmental decision making via
hypothesis evaluation. These examples provide illustration of the concepts
discussed in this introduction.
Tests Involving a Single Sample
The simplest type of hypothesis test is one where we wish to compare a
characteristic of a population against a fixed standard. Most often this characteristic
describes the “center” of the distribution of concentration, the mean or median, over
some physical area or span of time. In such situations we estimate the desired
characteristic from one or more representative statistical samples of the population.
For example, we might ask the question “Is the median concentration of acrylonitrile
in the upper foot of soil at this residential exposure unit less than or equal to 5
mg/kg.”
Ignoring for the moment the advice of the DQO process, the management
decision was to collect 24 soil samples. The results of this sampling effort appear in
Table 3.2.
Using some of the techniques described in the previous chapter, it is apparent that
the distribution of the concentration data, y, is skewed. In addition it is noted that the
log-normal model provides a reasonable model for the data distribution. This is
fortuitous, for we recall from the discussion of confidence intervals that for a
log-normal distribution, half of the samples collected would be expected to have
concentrations above, and half below, the geometric mean. Therefore, in expectation
the geometric mean and median are the same. This permits us to formulate
hypotheses in terms of the logarithm of concentration, x, and apply standard
statistical tests of significance that appeal to the normal theory of errors.
Table 3.1
Type I and II Errors
Decision Made
Unknown Truth Accept H
0
Reject H
0
H
0
True No Error Type I Error (α )
H
0
False Type II Error (β )No Error
steqm-3.fm Page 51 Friday, August 8, 2003 8:08 AM
©2004 CRC Press LLC
Table 3.2
Acrylonitrile in Samples from Residential Exposure Unit
Sample
Number
Acrylonitrile
(mg/kg, y) x = ln(y)
Above
5mg/kg
S001 45.5 3.8177 Yes
S002 36.9 3.6082 Yes
S003 25.6 3.2426 Yes
S004 36.5 3.5973 Yes
S005 4.7 1.5476 No
S006 14.4 2.6672 Yes
S007 8.1 2.0919 Yes
S008 15.8 2.7600 Yes
S009 9.6 2.2618 Yes
S010 12.4 2.5177 Yes
S011 3.7 1.3083 No
S012 2.6 0.9555 No
S013 8.9 2.1861 Yes
S014 17.6 2.8679 Yes
S015 4.1 1.4110 No
S016 5.7 1.7405 Yes
S017 44.2 3.7887 Yes
S018 16.5 2.8034 Yes
S019 9.1 2.2083 Yes
S020 23.5 3.1570 Yes
S021 23.9 3.1739 Yes
S022 284 5.6507 Yes
S023 7.3 1.9879 Yes
S024 6.3 1.8406 Yes
Mean, =
2.6330
Std. deviation, S = 1.0357
Number greater than 5 mg/kg, w = 20
x
steqm-3.fm Page 52 Friday, August 8, 2003 8:08 AM
©2004 CRC Press LLC
Consider a null, H
0
, and alternate, H
1
, hypothesis pair stated as:
H
0
: Median acrylonitrile concentration is less than or equal to 5 mg/kg;
H
1
: Median acrylonitrile concentration is greater than 5 mg/kg;
Given the assumption of the log-normal distribution these translate into:
H
0
: The mean of the log acrylonitrile concentration, µ
x
, is less than or equal
to ln(5 mg/kg);
H
1
: The mean of the log acrylonitrile concentration, µ
x
, is greater than
ln(5 mg/kg).
Usually, these statements are economically symbolized by the following shorthand:
H
0
: µ
x
< µ
0
(= ln(5 mg/kg) = 1.6094);
H
1
: µ
x
> µ
0
(= ln(5 mg/kg) = 1.6094).
The sample mean standard deviation (S), sample size (N), and population mean
µ, hypothesized in H
0
are connected by the student’s “t” statistics introduced in
Equation [2.20]. Assuming that we are willing to run a 5% chance (α = 0.05) of
rejecting H
0
when it is true, we may formulate a decision rule. That rule is “we will
reject H
0
if the calculated value of t is greater than the 95th percentile of the
t distribution with 23 degrees of freedom.” This value, t
ν =23, 0.95
= 1.714, may be
found by interpolation in Table 2.2 or from the widely published tabulation of the
percentiles of Student’s t-distribution such as found in Handbook of Tables for
Probability and Statistics from CRC Press:
[3.1]
Clearly, this value is greater than t
ν =23, 0.95
= 1.714 and we reject the hypothesis that
the median concentration in the exposure area is less than or equal to 5 mg/kg.
Alternately, we can perform this test by simply calculating a 95% one-sided
lower bound on the geometric mean. If the target concentration of 5 mg/kg lies
above this limit, then we cannot reject H
0
. If the target concentration of 5 mg/kg lies
below this limit, then we must reject H
0
.
This confidence limit is calculated using the relationship given by
Equation [2.29] modified to place all of the Type I error in a single tail of the “t”
distribution to accommodate the single-sided nature of the test. The test is single
sided simply because if the true median is below 5 mg/kg, we don’t really care how
much below.
[3.2]
x
t
x µ
0
–
SN⁄
–
2.6330 1.6094–
1.0357 24⁄
4.84
==
Lx() xt
v1 α–(),
SN⁄–=
Lx() 2.6330 1.714 1.0357 24ڥР2.2706==
Lower Limit e
Lx()
9.7'==
steqm-3.fm Page 53 Friday, August 8, 2003 8:08 AM
©2004 CRC Press LLC
Clearly, 9.7 mg/kg is greater than 5 mg/kg and we reject H
0
.
Obviously, each of the above decision rules has led to the rejection of H
0
. In
doing so we can only make an error of Type I and the probability of making such an
error has been fixed at 5% (α = 0.05). Let us say that the remediation of our
residential exposure unit will cost $1 million. A 5% chance of error in the decision
to remediate results in an expected loss of $50,000. That is simply the cost to
remediate, $1 million, times the probability that the decision to remediate is wrong
( α = 0.05). However, the calculated value of the “t” statistic, t = 4.84, is well above
the 95th percentile of the “t”-distribution.
We might ask exactly what is the probability that a value of t equal to or greater
than 4.84 will result when H
0
is true. This probability, “P,” can be obtained from
tables of the student’s “t”-distribution or computer algorithms for computing the
cumulative probability function of the “t”-distribution. The “P” value for the
current example is 0.00003. Therefore, the expected loss in deciding to remediate
this particular exposure unit is likely only $30.
There is another use of the “P” value. Instead of comparing the calculated value
of the test statistic to the tabulated value corresponding to the Type I error
probability to make the decision to reject H
0
, we may compare the “P” value to the
tolerable Type I error probability. If the “P” value is less than the tolerable Type I
error probability we then will reject H
0
.
Test Operating Characteristic
We have now considered the ramifications associated with the making of a Type I
decision error, i.e., rejecting H
0
when it is in fact true. In our example we are 95%
confident that the true median concentration is greater than 9.7 mg/kg and it is
therefore unlikely that we would ever get a sample from our remedial unit that would
result in accepting H
0
. However, this is only a post hoc assessment. Prior to
collecting the statistical collection of physical soil samples from our exposure unit it
seems prudent to consider the risk making a false negative decision error, or error of
Type II.
Unlike the probability of making a Type I error, which is neither a function of the
sample size nor the true deviation from H
0
, the probability of making a Type II error
is a function of both. Taking the effect of the deviation from a target median of
5 mg/kg and the sample size separately, let us consider their effects on the
probability, β , of making a Type II error.
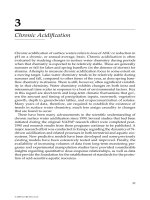
Figure 3.1 presents the probability of a Type II error as a function of the true
median for a sample size of 24. This representation is often referred to as the
operating characteristic of the test. Note that the closer the true median is to the
target value of 5 mg/kg, the more likely we are to make a Type II decision error and
accept H
0
when it is false. When the true median is near 14, it is extremely unlikely
that will make this decision error.
steqm-3.fm Page 54 Friday, August 8, 2003 8:08 AM
©2004 CRC Press LLC
It is not uncommon to find a false negative error rate specified as 20% (β =0.20).
The choice of the tolerable magnitude of a Type II error depends upon the
consequent costs associated with accepting H
0
when it is in fact false. The debate as
to precisely what these costs might include, i.e., remobilization and remediation,
health care costs, cost of mortality, are well beyond the scope of this book. For now
we will assume that β = 0.20 is tolerable.
Note from Figure 3.1 that for our example, a β = 0.20 translates into a true
median of 9.89 mg/kg. The region between a median of 5 mg/kg and 9.89 mg/kg is
often referred to as the “gray area” in many USEPA guidance documents (see for
example, USEPA, 1989, 1994a, 1994b). This is the range of the true median greater
than 5 mg/kg where the probability of falsely accepting the null hypothesis exceeds
the tolerable level. As is discussed below, the extent of the gray region is a function
of the sample size.
The calculation of the exact value of β for the student’s “t”-test requires the
evaluation of the noncentral “t”-Distribution with noncentrality parameter d, where
d is given by
Figure 3.1 Operating Characteristic,
Single Sample Student’s t-Test
steqm-3.fm Page 55 Friday, August 8, 2003 8:08 AM
©2004 CRC Press LLC
Several statistical software packages such as SAS
®
and SYSTAT
®
offer routines for
evaluation of the noncentral “t”-distribution. In addition, tables exist in many
statistical texts and USEPA guidance documents (USEPA, 1989, 1994a, 1994b) to
assist with the assessment of the Type II error. All require a specification of the
noncentrality parameter d, which is a function of the unknown standard deviation σ .
A reasonably simple approximation is possible that provides sufficient accuracy to
evaluate alternative sampling designs.
This approximation is simply to calculate the probability that the null hypothesis
will be accepted when in fact the alternate is true. The first step in this process is to
calculate the value of the mean, , which will result in rejecting H
0
when it is true.
As indicated above, this will be the value of , let us call it C, which corresponds to
the critical value of t
ν =23, 0.95
= 1.714:
[3.3]
Solving for C yields the value of 1.9718.
The next step in this approximation is to calculate the probability that a value of
less than 2.06623 will result when the true median is greater than 5, or
µ > ln(5) = 1.6094:
[3.4]
Suppose that a median of 10 mg/kg is of particular interest. We may employ [3.4]
with µ = ln(10) = 2.3026 to calculate β :
Using tables of the Student’s “t”-distribution, we find β = 0.066, or, a Type II error
rate of about 7%.
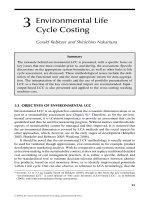
Power Calculation and One Sample Tests
A function often mentioned is referred to as the discriminatory power, or simply
the power, of the test. It is simply one minus the magnitude of the Type II error, or
power = 1−β . The power function for our example is presented in Figure 3.2. Note
that there is at least an 80 percent chance of detecting a true median as large as
9.89 mg/kg and declaring it statistically significantly different from 5 mg/kg.
d
N µµ
0
–()
σ
=
x
x
t
C µ
0
–
SN⁄
C
1.6094
1.0357 24⁄
– 1.714== =
x
Pr x C µµ
0
><()β=
Pr x 1.9718 µ 1.6094><()β=
β Pr t
C µ
–
SN⁄
≤
1.9718 2.3026
–
0.2114
1.5648
–==
=
steqm-3.fm Page 56 Friday, August 8, 2003 8:08 AM
©2004 CRC Press LLC
Sample Size
We discovered that there is a 14 percent chance of accepting the hypothesis that
the median concentration is less than or equal to 5 mg/kg when in truth the median
is as high as 10 mg/kg. There are situations in which a doubling of the median
concentration dramatically increases the consequences of exposure. Suppose that
this is one of those cases. How can we modify the sampling design to reduce the
magnitude of the Type II error to a more acceptable level of β = 0.01 when the true
median is 10 (µ = ln(10) = 2.3026)?
Step 7 of the DQO process addresses precisely this question. It is here that we
combined our choices for magnitudes α and β of the possible decision errors, an
estimate of the data variability with perceived important deviation of the mean from
that specified in H
0
to determine the number of samples required. Determining the
exact number of samples requires iterative evaluation of the probabilities of the
noncentral t distribution. Fortunately, the following provides an adequate
approximation:
[3.5]
Figure 3.2 Power Function,
Single Sample Student’s t-Test
N σ
2
=
Z
1-β
Z
1-α
+
µµ
0
–
2
Z
1-α
2
2
+
steqm-3.fm Page 57 Friday, August 8, 2003 8:08 AM
©2004 CRC Press LLC
Here Z
1 −α
and Z
1−β
are percentiles of the standard normal distribution
corresponding to one minus the desired error rate. The deviation µ − µ
0
is that
considered to be important and σ
2
represent the true variance of the data population.
In practice we approximate σ
2
with an estimate S
2
. In practice the last term in this
expression adds less than 2 to the sample size and is often dropped to give the
following:
[3.6]
The value of the standard normal quantile corresponding to the desired α = 0.05
is Z
1−α
Z
0.95
= 1.645. Corresponding to the desired magnitude of Type II error,
β =0.01, is Z
1−β
= Z
0.99
= 2.326. The important deviation, µ − µ
0
= ln(10) − ln(5)
= 2.3026 − 1.6094 = 0.69319. The standard deviation, σ , is estimated to be
S = 1.3057. Using the quantities in [3.6] we obtain
Therefore, we would need 56 samples to meet our chosen decision criteria.
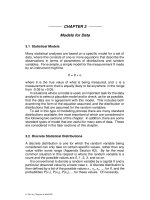
It is instructive to repeatedly perform this calculation for various values of the log
median, µ, and magnitude of Type II error, β . This results in the representation given
in Figure 3.3. Note that as the true value of the median deemed to be an important
deviation from H
0
approaches the value specified by H
0
, the sample size increases
dramatically for a given Type II error. Note also that the number of samples also
increases as the tolerable level of Type II error decreases.
Frequently, contracts for environmental investigations are awarded based upon
minimum proposed cost. These costs are largely related to the number of samples to
be collected. In the authors’ experience candidate project proposals are often
prepared without going through anything approximating the steps of the DQO
process. Sample sizes are decided more on the demands of competitive contract
bidding than analysis of the decision making process. Rarely is there an assessment
of the risks of making decision errors and associated economic consequences.
The USEPA’s Data Quality Objects Decision Error Feasibility Trails, (DQO/DEFT)
program and guidance (USEPA 1994c) provides a convenient and potentially useful
tool for the evaluation of tolerable errors alternative sampling designs. This tool
assumes that the normal theory of errors applies. If the normal distribution is not a
useful model for hypothesis testing, this evaluation requires other tools.
Whose Ox is Being Gored
The astute reader may have noticed that all of the possible null hypotheses given
above specify the unit sampled as being “clean.” The responsible party therefore has
a fixed specified risk, the Type I error, that a “clean” unit will be judged
“contaminated” or a discharge in compliance as noncompliant. This is not always
the case.
N σ
2
=
Z
1-β
Z
1-α
+
µµ
0
–
2
N1.3057
2
2.326 1.645+
0.69319
2
55.95 56≈==
steqm-3.fm Page 58 Friday, August 8, 2003 8:08 AM
©2004 CRC Press LLC
The USEPA’s (1989) Statistical Methods for Evaluating the Attainment of
Cleanup Standards, Volume 1: Soils and Solid Media, clearly indicates that “it is
extremely important to say that the site shall be cleaned up until the sampling
program indicates with reasonable confidence that the concentrations of the contam-
inants at the entire site are statistically less than the cleanup standard” (USEPA
1994a, pp. 2–5). The null hypothesis now changes to “the site remains contaminated
until proven otherwise within the bounds of statistical certainty.” The fixed Type I
error is now enjoyed by the regulating parties. The responsible party must now come
to grips with the “floating” risk, Type II error, of a truly remediated site being
declared contaminated and how much “overremediation” is required to control those
risks.
Nonparametric Tests
We thus far have assumed that a lognormal model provided a reasonable model
for our data. The geometric mean and median are asymptotically equivalent for the
lognormal distribution, so a test of median is in effect a test geometric mean or mean
Figure 3.3 Sample Sizes versus True Median Concentration
for Various Type II Errors
(Type I Error Fixed at α = 0.05)
Type II Error
0.01
0.05
0.1
0.2
steqm-3.fm Page 59 Friday, August 8, 2003 8:08 AM
©2004 CRC Press LLC
of the logarithms of the data as we have discussed above. Suppose now that the
lognormal model may not provide a reasonable model for our data.
Alternatively, we might want a nonparametric test of whether the true median
acrylonitrile sample differs from the target of 5 mg/kg. Let us first restate our null
hypothesis and alternate hypothesis as a reminder:
H
0
: Median acrylonitrile concentration is less than or equal to 5 mg/kg;
H
1
: Median acrylonitrile concentration is greater than 5 mg/kg.
A median test can be constructed using the number of observations, w, found to
be above the target median and the binomial distribution. Assuming that the null
hypothesis is correct, the probability, θ , of a given sample value being above the
median is 0.5. Restating the hypothesis:
H
0
, θ < 0.5
H
1
, θ > 0.5
The binomial density function, Equation 3.7, is used to calculate the probability
of observing w out of N values above the target median assumed under the null
hypothesis:
[3.7]
To test H
0
with a Type I error rate of 5% (α = 0.05), we find a critical value, C, as
the largest integer that satisfies the inequality:
[3.8]
If we observe C or more values greater than our assumed background, we then
reject H
0
. For our example, C is 17 and we observe k = 20 values greater than
background; thus we reject H
0
. Note that if we want to determine the probability,
“P-value,” of observing w or more successes, where k is the observed number above
the median (20 in our example), we sum f(w) from w = k to N. For our example, the
P-value is about 0.0008.
We can also assess the Type II error by evaluating Equation [3.8] for values of
θ >0.5:
[3.9]
fw()
N
!
w! Nw–()!
θ
w
1 θ–()
Nw–
=
Pr w C θ 0.5≤<()fw() 1 α–()≤
w0=
C1–
∑
0.95==
Pr w C θ 0.5><()fw()
w0=
C1–
∑
β==
steqm-3.fm Page 60 Friday, August 8, 2003 8:08 AM
©2004 CRC Press LLC
The following Table 3.3 presents the magnitude of the Type II error for our
current example for several values of θ greater than 0.5.
Tests Involving Two Samples
Rather than comparing the mean or median of a single sample to some fixed
level, we might wish to consider a question like: “Given that we have sampled
18 observations each from two areas, and have obtained sample means of 10 and
12 ppm, what is the probability that these areas have the same population mean?”
We could even ask the question “If the mean concentration of bad stuff in areas A
and B differs by 5 ppm, how many samples do we have to take from areas A and B
to be quite sure that the observed difference is real?”
If it can be assumed that the data are reasonably represented by the normal
distribution model (or if the logarithms represented by a normal distribution; e.g.,
log-normal) we can use the same t-test as described above, but now our population
mean is µ
1
−µ
2
; that is, the difference between the two means of the areas of
interest. Under the null hypothesis the value of µ
1
−µ
2
is zero and has a
“t”-distribution. The standard deviation used for this distribution is derived from a
“pooled” variance, , given by:
[3.10]
This pooled variance is taken as the best overall estimate of the variance in the two
populations if we assume that the two populations have equal variances.
Once we have calculated , we can use the principal that the variance of the
difference of two random variables is the sum of their variances (Hogg and Craig,
1995). In our case the variance of interest is the variance of , which we will
call . Since we know that the variance of the sample mean is given by S
2
/N
Table 3.3
Probability of Type II Error versus θ > 0.5
θβ
0.55 0.91
0.60 0.81
0.65 0.64
0.70 0.44
0.75 0.23
0.80 0.09
x
1
x
2
–
S
p
2
S
p
2
N
1
1–()S
1
2
N
2
1–()S
2
2
+
N
1
N
2
2–+
=
S
p
2
x
1
x
2
–
S
D
2
steqm-3.fm Page 61 Friday, August 8, 2003 8:08 AM
©2004 CRC Press LLC
(Equation [2.27]), it follows that the variance of the difference between two sample
means, (assuming equal variances) is given by:
[3.11]
and the standard deviation of the difference is its square root, S
D
.
The 95% confidence interval for is defined by an upper confidence
bound, for a two-sided probability interval of width (1−α ), given by:
[3.12]
and a lower confidence bound, or a two-sided probability interval of width
(1−α ), given by:
[3.13]
If we were doing a two-sided hypothesis with an alternative hypothesis H
1
of the
form and are not equal, we would reject H
0
if the interval
does not include zero.
One can also pose a one-tailed hypothesis test with an alternate hypothesis of the
form is greater than . Here we would reject H
0
if
[3.14]
were less than zero (note that for the one-tailed test we switch from α /2 to α ).
One point that deserves further consideration is that we assumed that and
were equal. This is actually a testable hypothesis. If we have , and want to
determine whether they are equal, we simply pick the larger of the two variances and
calculate their ratio, F, with the larger as the numerator. That is, if were larger
than , we would have:
[3.15]
This is compared to the critical value of an F distribution with (N
1
− 1) and (N
2
− 1)
degrees of freedom, which is written as . Note that the actual test has
, and
that is, it is a two-tailed test, thus we always pick the larger of and and test at
a significance level of α /2. For example, if we wanted to test equality of variance at
a significance level of 0.05, and we have sample sizes of 11 and 12, and the larger
S
D
2
S
D
2
S
p
2
1
N
1
1
N
2
+
=
x
1
x
2
–
U
x1 x2–
U
x1 x2–
x
1
x
2
– t
ν 1 ν 21 α 2⁄–(),+
S
D
+=
L
x1 x2–
L
x1 x2–
x
1
x
2
– t
ν 1 ν 21 α 2⁄–(),+
S
D
–=
x
1
x
2
L
x1 x2–
U
x1 x2–
,()
x
1
x
2
L
x1 x2–
x
1
x
2
– t
ν 1 ν 21 α–(),+
S
D
–=
S
1
2
S
2
2
S
1
2
S
2
2
S
1
2
S
2
2
FS
1
2
S
2
2
⁄=
F
α 2⁄ν1 ν 2,[]
H
0
: S
1
2
S
2
2
=
H
1
: S
1
2
S
2
2
≠
S
1
2
S
2
2
steqm-3.fm Page 62 Friday, August 8, 2003 8:08 AM
©2004 CRC Press LLC
variance was from the sample of size 12, we would test against F
0.025 [11,10]
(remember degrees of freedom for the sample variance is always N − 1).
We note that many statistics texts discuss modifications of the t-test, generally
referred to as a Behrens-Fisher t-test, or Behrens-Fisher test, or a Behrens-Fisher
correction for use when sample variances are unequal (e.g., Sokol and Rohlf, 1995;
Zar, 1996). It is our experience that when unequal variances are encountered, one
should first try a logarithmic transformation of the data. If this fails to equalize
variances, one should then consider the nonparametric alternative discussed below,
or if differences in arithmetic means are the focus of interest use bootstrap methods
(Chapter 6). The reason for our not recommending Behrens-Fisher t-tests is that we
have seen such methods yield quite poor results in real-world situations and feel that
rank-based or bootstrap alternatives are more robust.
The following example uses the data from Table 2.4 to illustrate a two-sample t-test
and equality-of-variance test. The values from the two samples are designated by
“sample ID” in column 1 of Table 2.4. The summary statistics required for the conduct
of the hypothesis test comparing the means of the two populations are as follows:
Sample No. 1:
= 2.6281
= 0.8052
= 15.
Sample No. 2:
= 4.0665
= 0.5665
= 15.
The first hypothesis to be considered is the equality of variances:
The critical value of F
0.025, [14,14]
= 2.98. Since F = 1.421 is less than the critical
value of 2.98, there is no indication of unequal variances. Therefore, we may calcu-
late the pooled variance using Equation [3.10] and = 0.68585. Consequently, the
standard deviation of the difference in the two means is S
D
= 0.3024 using
Equation [3.11]. Employing relationships [3.12] and [3.13] we obtain the 95%
confidence interval for the true mean difference as (− 2.0577, − 0.8191). Because this
interval does not contain zero, we reject the null hypothesis H
0
.
One thing that may strike the careful reader is that in Chapter 2 we decided that
the data were consistent with a normal distribution, yet when we do a t-test we
declare that the two samples have significantly different means. This may seem
S
12
2
S
11
2
⁄
x
1
S
1
2
N
1
x
2
S
2
2
N
2
FS
1
2
S
2
2
⁄ 0.8052 0.5665⁄ 1.421== =
S
p
2
steqm-3.fm Page 63 Friday, August 8, 2003 8:08 AM
©2004 CRC Press LLC
contradictory, but it is not; the answer one gets from a statistical test depends on the
question one asks.
In Chapter 2 we asked, “Are the data consistent with a normal distribution?” and
received an affirmative answer, while here we have asked, “Do the two samples have
the same mean?” and received a negative answer. This is actually a general
principle. One may have a population that has an overall distribution that is well
described by a single distribution, but at the same time have subpopulations that are
significantly different from one another. For example, the variation in height of male
humans can be well described by a normal distribution, but different male
populations such as jockeys and basketball players may have very different mean
heights.
Power Calculations for the Two-Sample t-Test
Determination of the power of the two-sample test is very similar to that of the
sample test; that is, under H
0
, µ
1
−µ
2
is always assumed to be zero. If under H
1
we
assume that µ
1
−µ
2
= δ , we can determine the probability that we will reject H
0
when
it is false, which is the power of the test. The critical value of the test is t
ν 1+ ν 2, (1−α /2)
S
D
or − t
ν 1+ ν 2, (1−α /2)
S
D
because our expected mean difference is zero under H
0
. If
we consider an H
1
of µ
1
< µ
2
with a mean difference of δ , we want to calculate the
probability that a distribution with a true mean of δ will yield a value greater than the
upper critical value C
L
= − t
ν 1+ν 2, (1−α /2)
S
D
(we are only interested in the lower
bound because H
1
says µ
1
−µ
2
< δ ). In this case, we obtain a t
ν 1+ν 2,(β )
as:
[3.16]
We then determine the probability of a t statistic with ν 1+ν 2 degrees of freedom
being greater than the value calculated using [3.17]. This is the power of the t-test.
We can also calculate sample sizes required to achieve a given power for a test with
a given α level. If we assume that our two sample sizes will be equal (that is,
N
1
=N
2
= N), we can calculate our required N for each sample as follows:
[3.17]
Here t
ν (α )
+ t
ν ( β )
are the t values associated with the α level of the test (α /2 for a
two-tailed test) and and δ are as defined above.
The observant reader will note that ν is given by 2N − 2, but we are using [3.17]
to calculate N. In practice this means we must take a guess at N and then use the
results of the guess to fine tune our N estimate. Since N is usually fairly large, one
good way to get an initial estimate is to use the normal statistics, Z
α
and Z
β
to get an
initial N estimate, and then use this N to calculate ν for our t distribution. Since t
ν (α )
and t
ν (β )
will always be slightly larger than Z
α
and Z
β
(see Table 2.2), our initial N
will always be a little too small. However, in general, a sample size one or two units
higher than our initial N guess will usually satisfy [3.17]. One can also do more
complex power calculations where N
1
might be a fixed multiple of N
2
. Such a
t
ν 1 ν 2 β(),+
δ C
L
–()S
D
⁄=
N2S
p
2
δ
2
⁄()t
να()
t
νβ()
+()=
S
p
2
steqm-3.fm Page 64 Friday, August 8, 2003 8:08 AM
©2004 CRC Press LLC
design may be desirable if samples from population 1 are less expensive to obtain
than samples from population 2. More extensive discussions of power calculations
for t-tests can be found in Sokol and Rohlf (1995) and Zar (1996).
A Rank-Based Alternative to the Two-Sample t-Test
In the previous section, we performed the two-sample t-test, but if the data are not
from a normal distribution or the variances of the two samples are not equal, the
probability levels calculated may be incorrect. Therefore, we consider a test
alternative that does not depend on assumptions of normality or equality of variance.
If we simply rank all of the observations in the two samples from smallest to largest
and sum the ranks of the observations in each sample, we can calculate what is called
the Mann Whitney U test or Wilcoxon Rank Sum Test (Conover, 1998; Lehmann,
1998).
The U statistic is given by:
[3.18]
Here N
1
and N
2
are the sizes of the two samples and R
1
is the sum of the ranks in
sample 1. One might ask, “How do I determine which sample is sample 1?” The
answer is that it is arbitrary and one must calculate U values for both samples.
However, once a U value has been determined for one sample, a U′ value that would
correspond to the other sample can easily be determined as:
[3.19]
Using our two-sample example from Table 2.4, we obtain the following:
Using [3.18] and [3.19] we obtain U = 201 and U′ = 24, and compare the smaller
of the two values to a table like that in Table 3.4. If this value is less than the
tabulated critical value we reject H
0
that the sampled populations are the same.
is certainly less than the tabulated 72, so we have two different
populations sampled in our example. Note that one can base the test on either the
larger or the smaller of the U values. Thus, when using other tables of critical values,
it is important to determine which U (larger or smaller) is tabulated.
In practice, statistical software will always provide P values for the U statistics. If
one has a fairly large sample size (as a rule of thumb: N1 + N2 >
30 and the smaller
of the two sample sizes greater than 10), one can calculate an average U value, U
M
, as:
[3.20]
Sample Size N Rank Sum R
No. 1 15 144
No. 2 15 321
Total 30 465
UN
1
N
2
()N
1
N
1
1+()2⁄()R
1
–+=
U′ N
1
N
2
()U–=
U′ 24=
U
M
N
1
N
2
()2⁄=
steqm-3.fm Page 65 Friday, August 8, 2003 8:08 AM
©2004 CRC Press LLC
and a standard error for U, S
U
as:
[3.21]
Table 3.4
Critical Values of U in the Mann-Whitney Test
(α = 0.05 for a One-Tailed Test, α = 0.10 for a Two-Tailed Test)
N
1
N
2
9 1011121314151617181920
100
2111222333444
334556778991011
4 6 7 8 91011121415161718
5 9 11 12 13 15 16 18 19 20 22 23 25
6121416171921232526283032
7151719212326283033353739
8182023262831333639414447
9212427303336394245485154
10 24 27 31 34 37 41 44 48 51 55 58 62
11 27 31 34 38 42 46 50 54 57 61 65 69
12 30 34 38 42 47 51 55 60 64 68 72 77
13 33 37 42 47 51 56 61 65 70 75 80 84
14 36 41 46 51 56 61 66 71 77 82 87 92
15 39 44 50 55 61 66 72 77 83 88 94 100
16 42 48 54 60 65 71 77 83 89 95 101 107
17 45 51 57 64 70 77 83 89 96 102 109 115
18 48 55 61 68 75 82 88 95 102 109 116 123
19 51 58 65 72 80 87 94 101 109 116 123 130
20 54 62 69 77 84 92 100 107 115 123 130 138
Adapted from Handbook of Tables for Probability and Statistics, CRC Press.
S
U
N
1
N
2
() N
1
N
2
1++()12⁄[]
12/
=
steqm-3.fm Page 66 Friday, August 8, 2003 8:08 AM
©2004 CRC Press LLC
The Z score is then
[3.22]
The result of Equation [3.22] is then compared to a standard normal distribution, and
H
0
is rejected if Z is greater than Z
(1−α /2)
. That is, if we wished to do a two-sided
hypothesis test for H
0
we would reject H
0
if Z exceeded 1.96.
One question that arises is “exactly what is H
0
?” For the t-test it is µ
1
= µ
2
, but
for a rank sum test H
0
, is that the ranks are assigned randomly to the two samples,
which is essentially equivalent to an H
0
that the two sample medians are equal. In
some cases, such as sampling for exposure assessment, we may be specifically
interested in H
0
: µ
1
− µ
2
, where and are the sample arithmetic means. For
strongly right-skewed distributions, such as the log-normal-like ones associated with
chemical concentration data, the arithmetic mean may be the 75th or even 90th
percentile of the distribution. Thus a test of medians may be misleading. In such
cases, tests based on bootstrapping are a better alternative.
Another problem with rank tests is tied values. That is, one may have two
observations with the same value. This may occur in environmental measurements
because reported values are rounded to a small number of decimal places. If the
number of ties is small, one can simply assign the average rank to each of the tied
values. That is, if two values that are tied at the positions that would ordinarily be
assigned ranks 7 and 8, each is assigned 7.5. One then simply calculates U and U′
and ignores the ties when doing the hypothesis test. In this case the test is slightly
conservative in the sense that it is less likely to reject the null hypothesis than if we
calculated an exact probability (which could always be done using simulation
techniques). Lehmann (1998) discusses the problem of ties and most discussions of
this test (e.g., Conover, 1998) offer formulae for large sample corrections for ties. It
is our feeling that for these cases, too, bootstrap alternatives are preferable.
A Simple Two-Sample Quantile Test
Sometimes we are not totally interested in the mean values but rather want to
determine if one area has more “high” concentration values than another. For
example, we might want to know if a newly remediated area has no more spot
contamination than a “clean” reference area. In this case we might simply pick some
upper quantile of interest such as the upper 70th or 80th
percentile of the data and ask
whether the remediated area had more observations greater than this quantile than
the reference area.
Let us again consider the data in Table 3.4. Suppose that the data of sample No. 1
come from an acknowledged reference area. Those data identified as from sample
No. 2 are from an area possibly in need of remediation. It will be decided that the
area of interest has no more “high” concentration values than the reference area if it
is statistically demonstrated that the number of observations from each area greater
than the 70th percentile of the combined set of values is the same. Further, we will
ZUU
M
–()S
U
⁄=
x
1
x
2
steqm-3.fm Page 67 Friday, August 8, 2003 8:08 AM
©2004 CRC Press LLC
fix our Type I error at α = 0.05. The exact P-value of the quantile test can be
obtained from the hypergeometric distribution as follows:
[3.23]
We start by sorting all the observations from the combined samples and note the
upper 70th percentile. In our example, this is ln(59.8) = 4.09123. Let r (=9) be the
total number of observations above this upper quantile. The number of observations
from the area of interest greater than or equal to this value is designated by k (=8).
The total number of samples from the reference area will be represented by m (=15)
and the total number of samples from the area of interest by n (=15):
Thus, we reject the hypothesis that the area of interest and the reference area have the
same frequency of “high” concentrations.
If the total number of observations above the specified quantile, r, is greater than
20, the calculation of the hypergeometric distribution can become quite tedious. We
may then employ the approximation involving the normal distribution. We first
calculate the mean, µ, and standard deviation, σ , of the hypergeometric distribution
assuming H
0
is true:
[3.24]
[3.25]
The probability used to determine significance is that associated with the standard
normal variate Z found by:
[3.26]
P
mnr
–+
ni–
r
i
ik=
r
∑
mn+
n
=
P
21
15 i
–
9
i
i8=
9
∑
30
15
0.007
==
µ
nr
mn
+
=
σ
mnr m n r
–+()
mn
+()
2
mn1–+()
1
2
=
Z
k0.5
– µ–
σ
=
steqm-3.fm Page 68 Friday, August 8, 2003 8:08 AM
©2004 CRC Press LLC
The Quantile Test is a prominent component in making decisions regarding the
success of site cleanups. It is a major part of the USEPA’s (1994a) Statistical
Methods For Evaluating The Attainment of Cleanup Standards for soils and solid
media and the NRC’s (1995) NUREG-1505 on determining the final status of
decommissioning surveys. These documents recommend that the Quantile Test be
used in conjunction with the Wilcoxon Rank Sum Test.
More Than Two Populations: Analysis of Variance (ANOVA)
In some cases we may have several samples and want to ask the question, “Do
these samples have the same mean?” (H
0
) or “Do some of the means differ?” (H
1
).
For example we might have a site with several distinct areas and want to know if it
is reasonable to assume that all areas have a common mean concentration for a
particular compound.
To answer such a question we do a one-way ANOVA of the replicate x data across
the levels of samples of interest. In such a test we first calculate a total sum of
squares (SS
T
) for the data set, which is given by:
[3.27]
where is the grand mean of the x’s from all samples. M is the number of samples
of interest and K
i
is the sample size in the ith group.
We then calculate a within-group sum of squares, SS
W
, for each group. This is
given by:
[3.28]
Here, K
i
and M are defined as before; is the mean value for each group.
We can then calculate a between-group sum of squares (SS
B
) by subtraction:
[3.29]
Once we have calculated SS
W
and SS
B
, we can calculate “mean square”
estimates for within- and-between group variation (MS
W
and MS
B
):
[3.30]
These are actually variance estimates. Thus, we can test whether MS
B
and MS
W
are
equal using an F test like that used for testing equality of two sample variances,
except here:
H
0
is MS
B
= MS
W
, versus H
1
, MS
B
> MS
W
SS
T
x
ij,
x
G
–()
2
j1
=
K
i
∑
i1=
M
∑
=
x
G
SS
W
x
ij,
x
i,.
–()
2
j1
=
K
i
∑
i1=
M
∑
=
x
i,.
SS
B
SS
T
SS
W
–=
MS
W
SS
W
= K
i
1–()
i1=
M
∑
⁄ , and MS
B
SS
B
N1–()⁄=
steqm-3.fm Page 69 Friday, August 8, 2003 8:08 AM
©2004 CRC Press LLC
These hypotheses are equivalent to H
0
of “all means are equal” versus an H
1
of some
means are unequal because when all means are equal, both MS
B
and MS
W
are
estimates of the population variance, σ
2
and when there are differences among
means, MS
B
is larger than MS
W.
We test the ratio:
[3.31]
This is compared to the critical value of an F distribution with (N − 1) and Σ (K
i
− 1)
degrees of freedom, which is written as: F
α [ν
1
, ν
2
]
. Note that here we test at a level
α rather than α /2 because the test is a one-tailed test. That is, under H
1
, MS
B
is
always greater than MS
W
.
Assumptions Necessary for ANOVA
There are two assumptions necessary for Equation [3.31] to be a valid hypothesis
test in the sense that the α level of the test is correct. First, the data must be normally
distributed and second, the M groups must have the same variance. The first
assumption can be tested by subtracting the group mean from the observations in
each group. That is, x
i,j,C
is found as:
[3.32]
The N (N = Σ K
i
) total x
i,j,C
values are then tested for normality using either the
Kolmogorov-Smirnov test or the correlation coefficient between the x
i,j,C
and their
expected normal scores as described in Chapter 2.
The most commonly used test for equality of variances is Bartlett’s test for
homogeneity of variances (Sokol and Rohlf, 1995). For this test we begin with the
MS
W
value calculated in our ANOVA and the variances of each of the M samples in
the ANOVA, , , . We then take the natural logs of the MS
W
and the
M within-sample S
2
values. We will write these as L
W
and L
1
, L
M
. We develop
a test statistic, χ
2
as:
[3.33]
This is compared to a chi-squared statistic with M − 1 degrees of freedom.
In Equation [3.33], C is given by:
where
[3.34]
FMS
B
MS
W
⁄=
x
ijC,,
x
ij,
x
i
–=
S
1
2
S
M
2
χ
2
CL
W
K
i
1–() L
i
K
i
1–()
i1=
M
∑
–
i1=
M
∑
=
C1ABD–()+=
A1/3(M1) B– 1/(K
i
1) D–
i1=
M
∑
1/ (K
i
1)–
i1=
M
∑
== =
steqm-3.fm Page 70 Friday, August 8, 2003 8:08 AM
©2004 CRC Press LLC
Table 3.5 provides a sample one-way ANOVA table. The calculations use the
log-transformed pesticide residue data, x, found in Table 3.6. Table 3.6 also provides
the data with the group means (daily means) subtracted. The F statistic for this
analysis has 8 and 18 degrees of freedom because there are 9 samples with 3
observations per sample. Here the log-transformed data are clearly normal (the
interested reader can verify this fact), and the variances are homogeneous (the
Bartlett χ
2
is not significant). The very large F value of 92.1 is highly significant
(the P value of 0.0000 means that the probability of an F with 8 and 18 degrees of
freedom having a value of 92.1 or more is less than 0.00001).
Table 3.5
ANOVA Pesticide Residue Example
Source of
Variation
Degrees of
Freedom
Sum of
Squares
Mean
Square F Statistic P Value
Days 8 98.422 12.303 92.1 <0.00001
Error 18 2.405 0.134
Total 26 100.827
Table 3.6
Data for Pesticide Example with Residuals and Ranks
Day
Residual
Pesticide, y,
(ppb) x = ln(y)
Deviation from
Daily Mean,
Rank
Order
Group
Mean
Rank
0 239 5.4764 − 0.11914 20.0
0 232 5.4467 − 0.14887 19.0 20.8
0 352 5.8636 0.26802 23.5
1 256 5.5452 0.13661 21.0
1 116 4.7536 − 0.65497 16.0 21.0
1 375 5.9269 0.51836 26.0
5 353 5.8665 − 0.14014 25.0
5 539 6.2897 0.28311 27.0 25.2
5 352 5.8636 − 0.14297 23.5
10 140 4.9416 − 0.36377 17.0
10 269 5.5947 0.28929 22.0 19.0
10 217 5.3799 0.07448 18.0
20 6 1.7664 0.06520 8.0
20 5 1.5063 − 0.19494 6.0 8.0
XX–
steqm-3.fm Page 71 Friday, August 8, 2003 8:08 AM
©2004 CRC Press LLC
Power Calculations for ANOVA
One can calculate the power for an ANOVA in much the same way that one does
them for a t-test, but things get very much more complex. Recall that the H
0
in
ANOVA is that “all means are the same” versus an H
1
of “some means are different.”
However for the power calculation we must have an H
1
that is stated in a
numerically specific way. Thus we might have an H
1
that all means are the same
except for one that differs from the others by an amount δ . Alternatively, we might
simply say that the among-group variance component exceeded the within group
component by an assumed amount.
It is our feeling that power or sample size calculations for more complex
multisample experimental designs are best pursued in collaboration with a person
trained in statistics. Thus, we do not treat such calculations here. Those wishing to
learn about such calculations can consult Sokol and Rohlf (1995; Chapter 9) or Zar
(1996; Chapters 10 and 12). For a more extensive discussion of ANOVA power
calculations one can consult Brown et al. (1991).
Multiway ANOVA
The preceding discussion assumed a group of samples arrayed along a single
indicator variable (days in our example). Sometimes we may have groups of
20 6 1.8310 0.12974 10.0
30 4 1.4303 0.02598 3.0
30 4 1.4770 0.07272 5.0 3.0
30 4 1.3056 − 0.09870 1.0
50 4 1.4702 − 0.24608 4.0
50 5 1.6677 − 0.04855 7.0 7.7
50 7 2.0109 0.29464 12.0
70 8 2.0528 0.03013 13.0
70 4 1.3481 − 0.67464 2.0 10.0
70 14 2.6672 0.64451 15.0
140 6 1.7783 − 0.22105 9.0
140 7 1.9242 − 0.07513 11.0 11.3
140 10 2.2956 0.29617 17.0
Table 3.6 (Cont’d)
Data for Pesticide Example with Residuals and Ranks
Day
Residual
Pesticide, y,
(ppb) x = ln(y)
Deviation from
Daily Mean,
Rank
Order
Group
Mean
RankXX
–
steqm-3.fm Page 72 Friday, August 8, 2003 8:08 AM
©2004 CRC Press LLC
samples defined by more than one indicator. For example, if we had collected
pesticide residue data from several fields we would have samples defined by days
and fields. This would be termed a two-way ANOVA. Similarly, if we had a still
larger data set that represented residues collected across days, and fields and several
years we would have a three-way ANOVA.
In our experience, multiway ANOVAs are not commonly employed in
environmental quality investigations. However, we mention these more complex
analyses so that the reader will be aware of these tools. Those desiring an accessible
account of multiway ANOVAs should consult Sokol and Rohlf (1995; Chapter 12)
or Zar (1996; Chapters 14 and 15). For a more comprehensive, but still relatively
nonmathematical, account of ANOVA modeling we suggest Brown et al. (1991).
A Nonparametric Alternative to a One-Way ANOVA
Sometimes either the data do not appear to be normal and/or the variances are not
equal among groups. In such cases the alternative analysis is to consider the ranks
of the data rather than the data themselves. The procedure of choice is the
Kruskal-Wallis test (Kruskal and Wallis, 1952; Zar, 1996). In this test all of the data
are ranked smallest to largest, and the ranks of the data are used in the ANOVA.
If one or more observations are tied, all of the tied observations are assigned the
average rank for the tied set. That is, if 3 observations share the same value and they
would have received ranks 9, 10, and 11, all three receive the average rank, 10. After
the ranks are calculated we sum the ranks separately for each sample. For example,
the mean rank for the ith sample, R
i
, is given by:
[3.35]
The values of the R
i
’s for our example groups are given in Table 3.6. Once the R
i
values are calculated for each group, we calculate our test statistic H as:
[3.36]
The value of H for our example is 22.18, which has an approximate P-value of
0.0046, indicating a statistically significant difference among the days as was the
case with the parametric ANOVA.
If there are tied values we also calculate a correction term C by first counting the
number of entries E
q
in each if the V tied groups. For example if we had 3 tied
groups with 3, 2, and 4 members each we would have E
1
= 3, E
2
= 2, and E
3
= 4. We
then compute T
q
for each tied group as:
[3.37]
R
i
1
K
i
r
j
j1
=
K
i
∑
=
H
12
N
2
N+()
K
i
R
i
2
i1
=
M
∑
3N 1+()–=
T
q
E
q
3
E
q
–=
steqm-3.fm Page 73 Friday, August 8, 2003 8:08 AM
©2004 CRC Press LLC