Lubrication and Reliability Handbook 2010 Part 8 pps
Bạn đang xem bản rút gọn của tài liệu. Xem và tải ngay bản đầy đủ của tài liệu tại đây (797.24 KB, 20 trang )
B3 Operating temperature limits
B3.1
Table 3.1 Maximum contact temperatures for typical tribological components
Table 3.2 Temperature as an indication of component failure
The temperatures in Table 3.1 are indicative of design limits. In practice it may be difficult to measure the contact
temperature. Table 3.2 indicates practical methods of measuring temperatures and the limits that can be accepted.
B4Vibration analysis
B4.1
PRINCIPLES
Vibration analysis uses vibration measurements taken at an accessible position on a machine, and analyses these
measurements in order to infer the condition of moving components inside the machine.
Table 4.1 The generation and transmission of vibration
Figure 4.1 Vibration measurements on machines
B4 Vibration analysis
B4.2
Table 4.2 Categories of vibration measurement
B4Vibration analysis
B4.3
Figure 4.2 Guidance on the levels of overall vibration of machines
B4 Vibration analysis
B4.4
OVERALL LEVEL MONITORING
This is the simplest method for the vibration monitoring
of complete machines. It uses the cheapest and most
compact equipment. It has the disadvantage however
that it is relatively insensitive, compared with other
methods, which focus more closely on to the individual
components of a machine.
The overall vibration level can be presented as a peak
to peak amplitude of vibration, as a peak velocity or as a
peak acceleration. Over the speed range of common
machines from 10 Hz to 1000 Hz vibration velocity is
probably the most appropriate measure of vibration
level. The vibration velocity combines displacement and
frequency and is thus likely to relate to fatigue stresses.
The normal procedure is to measure the vertical,
horizontal and axial vibration of a bearing housing or
machine casing and take the largest value as being the
most significant.
As in all condition monitoring methods, it is the trend
in successive readings that is particularly significant.
Figure 4.2, however, gives general guidance on accept-
able overall vibration levels allowing for the size of a
machine and the flexibility of its mounting
arrangements.
For machine with light rotors in heavy casings, where it
is more usual to make a direct measurement of shaft
vibration displacement relative to the bearing housing,
the maximum generally acceptable displacement is
indicated in the following table.
VIBRATION FREQUENCY MONITORING
The various components of a machine generate vibration
at characteristic frequencies. If a vibration signal is
analysed in terms of its frequency content, this can give
guidance on its source, and therefore on the cause of any
related problem. This spectral analysis is a useful
technique for problem diagnosis and is often applied,
when the overall level of vibration of a machine exceeds
normal values.
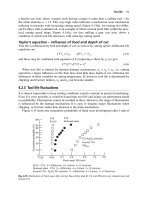
In spectral analysis the vibration signal is converted
into a graphical plot of signal strength against frequency
as shown in Figure 4.3, in this case for a single reduction
gearbox.
In Figure 4.3 there are three particular frequencies
which contribute to most of the vibration signal and, as
shown in Figure 4.4, they will usually correspond to the
shaft speeds and gear tooth meshing frequencies.
Table 4.3 Allowable vibrational displacements of
shafts
Figure 4.3 The spectral analysis of the vibration
signal from a single reduction gearbox
Figure 4.4 An example of the sources of discrete
frequencies observable in a spectral analysis
B4Vibration analysis
B4.5
Discrete frequency monitoring
If it is required to monitor a particular critical component the measuring system can be turned to signals at its
characteristic frequency in order to achieve the maximum sensitivity. This discrete frequency monitoring is particularly
appropriate for use with portable data collectors, particularly if these can be preset to measure the critical frequencies
at each measuring point. The recorded values can then be fed into a base computer for conversion into trends of the
readings with the running time of the machine.
Table 4.4 Typical discrete frequencies corresponding to various components and problems
B4 Vibration analysis
B4.6
SIGNAL AVERAGING
If a rotating component carries a number of similar
peripheral sub-units, such as the teeth on a gear wheel
or the blades on a rotor which interact with a fluid,
then signal averaging can be used as an additional
monitoring method.
A probe is used to measure the vibrations being
generated and the output from this is fed to a signal
averaging circuit, which extracts the components of
the signal which have a frequency base corresponding
to the rotational speed of the rotating component
which is to be monitored. This makes it possible to
build up a diagram which shows how the vibration
forces vary during one rotation of the component.
Some typical diagrams of this kind are shown in Figure
4.5 which indicates the contribution to the vibration
signal that is made by each tooth on a gear. An outline
of the technique for doing this is shown in Figure
4.6.
Figure 4.5 Signal average plots used to monitor a gear and showing the contribution from each tooth
Figure 4.6 A typical layout of a signal averaging system for monitoring a particular gear in a transmission
system
B5Wear debris analysis
B5.1
In wear debris analysis machine lubricants are monitored for the presence of particles derived from the deterioration
of machine components. The lubricant itself may also be analysed, to indicate its own conditon and that of the
machine.
WEAR DEBRIS ANALYSIS
Table 5.1 Wear debris monitoring methods
Figure 5.1 The relative efficiency of various wear debris monitoring methods
B5 Wear debris analysis
B5.2
Table 5.2 Off-line wear debris analysis techniques
Table 5.3 Problems with wear debris analysis
B5Wear debris analysis
B5.3
Table 5.4 Sources of materials found in wear debris analysis
Table 5.5 Quick tests for metallic debris from filters
B5 Wear debris analysis
B5.4
Physical characteristics of wear debris
Rubbing wear
The normal particles of benign wear of sliding surfaces.
Rubbing wear particles are platelets from the shear
mixed layer which exhibits super-ductility. Opposing
surfaces are roughly of the same hardness. Generally the
maximum size of normal rubbing wear is 15 m.
Break-in wear particles are typical of components having
a ground or machined surface finish. During the break-
in period the ridges on the wear surface are flattened
and elongated platelets become detached from the
surface often 50 m long.
Cutting wear
Wear particles which have been generated as a result of
one surface penetrating another. The effect is to
generate particles much as a lathe tool creates machin-
ing swarf. Abrasive particles which have become embed-
ded in a soft surface, penetrate the opposing surface
generating cutting wear particles. Alternatively a hard
sharp edge or a hard component may penetrate the
softer surface. Particles may range in size from 2–5 m
wide and 25 to 100 m long.
B5Wear debris analysis
B5.5
Rolling fatigue wear
Fatigue spall particles are released from the stressed
surface as a pit is formed. Particles have a maximum size
of 100 m during the initial microspalling process. These
flat platelets have a major dimension to thickness ratio
greater than 10:1.
Spherical particles associated with rolling bearing fatigue
are generated in the bearing fatigue cracks. The spheres
are usually less than 3 m in diameter.
Laminar particles are very thin free metal particles
between 20–50 m major dimension with a thickness
ratio approximately 30:1. Laminar particles may be
formed by their passage through the rolling contact
region.
Combined rolling and sliding (gear systems)
There is a large variation in both sliding and rolling
velocities at the wear contacts; there are corresponding
variations in the characteristics of the particles gen-
erated. Fatigue particles from the gear pitch line have
similar characteristics to rolling bearing fatigue particles.
The particles may have a major dimension to thickness
ratio between 4:1 and 10:1. The chunkier particles result
from tensile stresses on the gear surface causing fatigue
cracks to propagate deeper into the gear tooth prior to
pitting. A high ratio of large (20 m) particles to small
(2 m) particles is usually evident.
B5 Wear debris analysis
B5.6
Severe sliding wear
Severe sliding wear particles range in size from 20 m
and larger. Some of these particles have surface striations
as a result of sliding. They frequently have straight edges
and their major dimension to thickness ratio is approx-
imately 10:1.
Crystalline material
Crystals appear bright and changing the direction of
polarisation or rotating the stage causes the light
intensity to vary. Sand appears optically active under
polarised light.
Weak magnetic materials
The size and position of the particles after magnetic
separation on a slide indicates their magnetic susceptibil-
ity. Ferro-magnetic particles (Fe, Co, Ni) larger than
15 m are always deposited at the entry or inner ring
zone of the slide. Particles of low susceptibility such as
aluminium, bronze, lead, etc, show little tendency to
form strings and are deposited over the whole of the
slide.
Polymers
Extruded plastics such as nylon fibres appear very bright
when viewed under polarised light.
B5Wear debris analysis
B5.7
Examples of problems detected by wear
debris analysis
Crankshaft bearings from a diesel engine
Rapid wear of the bearings occurred in a heavy duty cycle
transport operation. The copper, lead and tin levels
relate to a combination of wear of the bearing material
and its overlay plating.
Grease lubricated screwdown bearing
The ratio of chromium to nickel, corresponding broadly
to that in the material composition, indicated severe
damage to the large conical thrust bearing.
B5 Wear debris analysis
B5.8
Differential damage in an intercity bus
Excessive iron and the combination of chromium and
nickel resulted from the disintegration of a nose cone
bearing
Large journal bearing in a gas turbine pumping
installation
The lead based white metal wore continuously.
Piston rings from an excavator diesel engine
Bore polishing resulted in rapid wear of the piston rings.
The operating lands of the oil control rings were worn
away.
Engine cylinder head cracked
The presence of sodium originates from the use of a
corrosion inhibitor in the cooling water. A crack was
detected in the cylinder head allowing coolant to enter
the lubricant system.
B5Wear debris analysis
B5.9
LUBRICANT ANALYSIS
Table 5.6 Off-line lubricant analysis techniques
Table 5.7 Analysis techniques for the oil from various types of machine
B6 Lubricant change periods and tests
B6.1
THE NEED FOR LUBRICANT CHANGES
CHANGE PERIODS
Systems containing less than 250 litre (50 gal)
Analytical testing is not justified and change periods are
best based on experience. The following examples in the
opposite column are typical of industrial practice:
B6Lubricant change periods and tests
B6.2
Systems containing more than 250 litre (50 gal)
Regular testing should be carried out to determine when the lubricant is approaching the end of its useful service life.
A combination of visual examination and laboratory testing is recommended.
The results obtained are only representative of the sample. This should preferably be taken when the system is
running, and a clean container must be used. Guidance on interpreting the results is given in the following tables.
VISUAL EXAMINATION OF USED LUBRICATING OIL
1 Take sample of circulating oil in clean glass bottle (50–100 ml).
2 If dirty or opaque, stand for 1 h, preferably at 60°C (an office radiator provides a convenient source of heat).
B6 Lubricant change periods and tests
B6.3
LABORATORY TESTS FOR USED MINERAL LUBRICATING OILS
NOTES ON GOOD MAINTENANCE PRACTICE
Attention to detail will give improved performance of
oils in lubrication systems. The following points should
be noted:
1 Oil systems should be checked weekly and topped up
as necessary. Systems should not be over-filled as this
may lead to overheating through excessive churning.
2 Oil levels in splash-lubricated gearboxes may be
different when the machine is running from when it is
stationary. For continuously running machines the
correct running level should be marked to avoid the
risk of over- or under-filling.
3 Degradation is a function of temperature. Where
possible the bulk oil temperature in systems should
not exceed 60°C. The outside of small enclosed
systems should be kept clean to promote maximum
convection cooling.
4 Care must be exercised to prevent the ingress of dirt
during topping up.
B7Lubricant biological deterioration
B7.1
The ability of micro-organisms to use petroleum products as nourishment is relatively common. When they do so in very
large numbers a microbiological problem may arise in the use of the petroleum product. Oil emulsions are particularly
prone to infection, as water is essential for growth, but problems also arise in straight oils.
CHARACTERISTICS OF MICROBIAL PROBLEMS
1 They are most severe between 20°C and 40°C.
2 They get worse.
3 They are ‘infectious’ and can spread from one system to another.
4 Malodours and discolorations occur, particularly after a stagnation period.
5 Degradation of additives by the organisms may result in changes in viscosity, lubricity, stability and corrosiveness.
6 Masses of organisms agglomerate as ‘slimes’ and ‘scums’.
7 Water is an essential requirement.
Factors affecting level of infection of emulsions
The severity of a problem is related to the numbers and types of organisms present. Most of the factors in the following
table also influence straight oil infections.
Characteristics of principal infecting organisms (generalised scheme)