báo cáo khoa học: "Transcriptome analysis by GeneTrail revealed regulation of functional categories in response to alterations of iron homeostasis in Arabidopsis thaliana" pdf
Bạn đang xem bản rút gọn của tài liệu. Xem và tải ngay bản đầy đủ của tài liệu tại đây (1.15 MB, 10 trang )
METH O D O LOG Y AR T I C LE Open Access
Transcriptome analysis by GeneTrail revealed
regulation of functional categories in response to
alterations of iron homeostasis in Arabidopsis
thaliana
Mara Schuler
1
, Andreas Keller
2
, Christina Backes
2
, Katrin Philippar
3
, Hans-Peter Lenhof
2
and Petra Bauer
1*
Abstract
Background: High-throughput technologies have opened new avenues to study biological processes and
pathways. The interpretation of the immense amount of data sets generated nowadays needs to be facilitated in
order to enable biologists to identify complex gene networks and functional pathways. To cope with this task
multiple computer-based programs have been developed. GeneTrail is a freely available online tool that screens
comparative transcriptomic data for differentially regulated functional categories and biological pathways extracted
from common data bases like KEGG, Gene Ontology (GO), TRANSPATH and TRANSFAC. Additionally, GeneTrail
offers a feature that allows screening of individually defined biological categories that are relevant for the
respective research topic.
Results: We have set up GeneTrail for the use of Arabidopsis thaliana. To test the functionality of this tool for plant
analysis, we generated transcriptome data of root and leaf responses to Fe deficiency and the Arabidopsis metal
homeostasis mutant nas4x-1. We performed Gene Set Enrichment Analysis (GSEA) with eight meaningful pairwise
comparisons of transcriptome data sets. We were able to uncover several functional pathways inclu ding metal
homeostasis that were affected in our experimental situations. Representation of the differentially regulated
functional categories in Venn diagrams uncovered regulatory networks at the level of whole functional pathways.
Over-Representation Analysis (ORA) of differentially regulated genes identified in pairwise comparisons revealed
specific functional plant physiological categories as major targets upon Fe deficiency and in nas4x-1.
Conclusion: Here, we obtained supporting evidence, that the nas4x-1 mutant was defective in metal homeostasis.
It was confirmed that nas4x-1 showed Fe deficiency in roots and signs of Fe deficiency and Fe sufficiency in leaves.
Besides metal homeostasis, biotic stress, root carbohydrate, leaf photosystem and specific cell biological categories
were discovered as main targets for regulated changes in response to - Fe and nas4x-1. Among 258 differentially
expressed genes in response to - Fe and nas4x-1 five functional categories were enriched covering metal
homeostasis, redox regulation, cell division and histone acetylation. We proved that GeneTrail offers a flexible and
user-adapted way to identify functional categories in large-scale plant transcriptome data sets. The distinguished
feature that allowed analysis of individually assembled functional categories facilitated the study of the Arabidopsis
thaliana transcriptome.
* Correspondence:
1
Dept. of Biosciences - Botany, Campus A2.4, Saarland University, D-66123
Saarbrücken, Germany
Full list of author information is available at the end of the article
Schuler et al. BMC Plant Biology 2011, 11:87
/>© 2011 Schuler et al; licensee BioMed Central Ltd . This is an Open Access article d istribute d u nder the terms of the Creative Commons
Attribution License (http://crea tivecommons.org/licens es/by/2.0), which permits unrestricted use, distribution, and re prod uction in
any medium, provide d the origin al work is properly cited.
Background
High-throughput technologies for transcriptional profil-
ing have strongly advanced our understanding of com-
plex networks of gene interactions in physiology and
development. The most common integrative approach
for measuring gene expression is microarray analysis,
which has already been applied to investigat e many bio-
logical processes. Fo r storing the vast amount of mea-
sured expression profiles, many freely available
repositories have been developed, including th e Gene
Expression Omnibus (GEO) [1] o r Stanford Microarray
Database (SMD) [2]. It has become a routine habit for
many researchers to consult published microarray
expression data f or theoretical modeling of regulatory
networks involving their favourite genes prior to expe ri-
mentation [3,4]. The full strength of mi croarray inter-
pretation lies in the possibility of extracting information
beyond the single gene level to address questions on the
co-regulation of genes, on the identification of gene net-
works and entire extensive pathways of genes acting in
the same physiological process. Specialized software
tools like Genevestigator [4], the Botany Array Resource
(BAR) [5], MapMan [6], ATTED-II [7,8] or VirtualPlant
[9] for example have been developed to answer such
complex questions in plants.
The analysis software tool GeneTrail [10] can be used
for comparative analysis of transcriptome data to iden-
tify functional clusters or pathways rather than single
genes that are affected in one experimental condition
compared to another. This user-friendly and freely avail-
able tool covers analysis of a wide spectrum of available
biological categories assembled from information of the
Kyoto Encyclopedia of Genes and Genomes (KEGG),
Gene Ontology (GO), TRANSPATH pathways and tran-
scription factors from TRANSFAC. An advantage of
GeneTrail is that functional categories for investigation
by the program need not to be predefined by the soft-
ware developers, the categories can also be created by
the users themselves according to their personal fields
of interest. Therefore, the GeneTrail tool allows indivi-
dual users a flexible pathway analysis when comparing
two different samples.
GeneTrail has already been applied to analyse tran-
scriptomedataofawiderangeofmodelorganisms
including Homo sapiens and Mus musculus [11-13].
Here, we demonstrate the functionality of GeneTrail for
plant transcriptome analysis beyond the single gene level.
Our example of application was based on the compari-
sons of the root and leaf transcriptomes of the metal
homeostasis mutant nas4x-1 [14] and wild type plants in
response to sufficient and deficient Fe supply. Our study
focused on the regulatory patterns of entire response
pathways. These response pathways included cellular
categories derived from KEGG, GO, TRANSPATH and
TRANSFAC, plant-specific response pathways described
in MapMan [6] and an individually assembled category
named “metal homeostasis”. Gene Set Enrichment Analy-
sis (GSEA) of all genes and Over-Representation Analysis
(ORA) of the selected differentially expressed genes pro-
vided complex information on regulatory networks at the
level of gene categories and pathways.
Methods
Plant material and growth conditions
The nas4x-1 mutant plant line used has been described
in [14]. Wild type and nas4x-1 plants wer e grown in a
hydroponic solution containing a quarter strength of
Hoagland salts (0.1875 mM MgSO
4
×7H
2
O, 0.125 mM
KH
2
PO
4
, 0.3125 mM KNO
3
, 0.375 mM Ca(NO
3
)
2
,12.5
μMKCL,12.5μMH
3
BO
3
,2.5μMMnSO
4
×H
2
O, 0.5
μMZnSO
4
×7H
2
O, 0.375 μMCuSO
4
×5H
2
O,
0.01875 μM(NH
4
)
6
Mo
7
O
24
×4H
2
O, pH 6.0) supplied
with 10 μM FeNa-EDTA. The medium was exchanged
weekly. Fo ur weeks after germination, plants were
exposed for another week to plant medium containing
either 10 μM FeNa-EDTA (+ Fe) or without Fe (- Fe).
Cultivation took place at 21°C/19°C and 16 h light, 8 h
dark cycles and a light intensity of 150 μmol × m
-2
×s
-1
.
RNA extraction and microarray hybridization
L3/ L4 rosette leaves and roots of wild type and nas4x-1
mutant plants grown under + and - Fe were harvested
separately in liquid nitrogen (total of 8 samples). Experi-
ments were performed three times in three consecutive
weeks and respective samples were harvested to obtain
3 biological r eplicates (n = 3; Additional file 1, Figure
S1A). Total RNA was extracted from 100 mg of root or
leaf material with the Qiagen RNeasy Plant Mini Prep
Kit according to the manufacturer’s protocol. 5 μgRNA
were processed into biotin-labeled cRNA and hybridized
to Affymetrix GeneChip Arabidopsis ATH1 Genome
Arrays (Affymetrix, High Wycombe, U.K.), using the
Affymetrix One-Cycle Labeling and C ontrol (Target) kit
according to the manufacturer’s instructions. Microarray
signals were determined using Affymetrix Microarray
Suite 5.1.(MAS 5.1) and made comparable by scaling the
average overall signal intensity of all probe sets to a tar-
get signal of 100 (Affymetrix GeneChip Operating soft-
ware, GCOS) [15,16]. Data are available under http://
www.ncbi.nlm.nih.gov/geo/query/acc.cgi?acc=GSE24348.
Statistical analysis of microarray expression data and
calculation of fold changes
Forfurtherdataanalysis,thedataextractedfromthe
Affymetrix Microarray Suite Microarray were processed
by using standard quantile normalization [17], which
has become one of the most commonly used normaliza-
tion techniques for microarray data and finds also
Schuler et al. BMC Plant Biology 2011, 11:87
/>Page 2 of 10
application in pre-processing packages as e.g., the
“Robust Multichip Average"(RMA) approach [18]. Med-
ian values were calculated from the normalized expres-
sion signals of the three biological replicates. Fold
changes were calculated from median values for eight
comparisons of the eight data sets, namely - Fe vs. + Fe
(WT),-Fevs.+Fe(nas4x-1), nas4x-1 vs. WT (+ Fe),
nas4x-1 vs. WT (- Fe), for roots and leaves, respectively
(see Additional file 1, Figure S1D).
GeneTrail
The web-based application GeneTrail [10,19] provided
two basic approaches for assessing the enrichment or
depletion of gene sets: the unweighted Gene Set Enrich-
ment Analysis (GSEA) and the Over-Representation
Analysis (ORA).
GeneTrail supported a variant of unweighted GSEA
[20]. The input for a GSEA was a list of genes or proteins
that were sorted by an arbitrary criterion (e.g., fold
changes of expression values). For computing the statisti-
cal significance of a biological category, a Kolmogorov-
Smirnov-like test was used that computed whether the
genes in the category were equally distributed (category
was not enriched) or accumulated on top (see example in
Additional file 2, Figure S2A) or on bottom (see example
in Additional file 2, Figure S2B) of the list. To this end, a
running sum was computed as follows: When processing
the input list from top to bottom, the running sum was
increased each time a gene belonged to the biological cate-
gory, otherwise the running sum was decreased. Red
graphs with a ‘mountain-like shape’ illustrated a specific
category predominantly containing top-ranked genes (see
example in Additional file 2, Figure S2A). In contrast,
green graphs with a ‘valley-like shape’ illustrated a specific
category predominantly containing bottom-ranked genes
(see example in Additional file 2, Figure S2B). The enrich-
ment of a category did not imply a differential expression
of all genes of this category. The expression values o f
every single gene were interpreted and evaluated individu-
ally. For estimating the statistical significance, the maximal
deviation from zero of the running sum was considered. If
this maximal deviation was positive, the category was
enriche d for the test set genes, otherwise it was de pleted.
In GeneTrail, the p-value was computed as the probability
that any running sum reached a larger or equal absolute
maximal deviation from zero. To perform GSEA fold
changes were generated to c ompare two samples, which
were then sorted according to values from highest to low-
est. Sorted gene identifiers were uploaded as text file prior
to performing GSEA.
An ORA compared a set of interesting genes or pro-
teins (test set) to a backgro und distribution (reference
set) concerning a certain biological category (e.g. a
metabolic pathway). The distribution of test set genes
that were contained in the considered biological cate-
gory were compared to the genes of the reference set
having this property. If more genes in the test set
belonged to the considered biological category than
expected, this category was enriched or over-repre-
sented, otherwise the category was depleted or under-
represented in the test set. In GeneTrail, the statistical
significance was assessed by computing a one-tailed p-
value using the hypergeometric distribution.
If not mentioned otherwise, we performed all analyses
with GeneTrail using the following parameters: p-value
adjustment: FDR, significance threshold: 0.05. The number
of two genes per category was set as minimum number for
all analyses. As reference set for performing an ORA, we
used all genes present on the ATH1 chip. All analysis
results computed with GeneTrail are available on the web-
site where
links to GSEA and ORA results are provided (The original
GeneTrail results pages can b e accessed under the file
named SummaryPage.html for all comparisons).
NIA Array Analysis Tool
For statistical treatment and identification of differen-
tially expressed genes from pairwise co mparisons, the
web-based software NIA Array Analysis tool developed
by the National Institute on Aging [21] was utilized.
The statistical analysis performed with this online tool
was based on the single-factor ANalysis Of VAriance
(ANOVA). The statistical significance was determined
using the False Discovery Rate (FDR) method. The data
were statistically analyzed using the following settings:
error model ´max (average, actual)’,0.01proportionof
highest variance values to be removed before variance
averaging, 10 degrees of freedom for the Bayesian error
model, 0.05 Benjamini and Hochberg False discovery
rate (FDR) threshold, zero mutations.
Results
Adaptation of GeneTrail for the use of Arabidopsis
thaliana
In order to utilize GeneTrail for Arabidopsis thaliana,
we extended GeneTrail such that, besides our supported
default identifiers, Arabidopsis-specific identifiers (AGI
gene codes from TAIR, transcript IDs from the ATH1
microarray) could be used. In addition, we allowed for
the usage of the ATH1 chip as pre-defined reference
set. Moreover, we improved the handling of individually
defined categories. As default analyses for Arabidopsis,
we included KEGG, GO, Homologene, and the search
for an arbitrary amino acid sequence motif.
Experimental design
In order to evaluate the GeneTrail tool for plant-specific
analysis, we generated and used transcriptome data sets
Schuler et al. BMC Plant Biology 2011, 11:87
/>Page 3 of 10
of nas4x-1 mutants compared to wild type plants grown
under + and - Fe supply (Additional file 1, Figure S1).
The quadruple nas4x-1 mutant harbours T-DNA inser-
tions in the four NICOTIANAMINE SYNTHASE (NAS)
genes present in the Arabidopsis genome. In conse-
quence this mutant shows a strongly reduced nicotiana-
mine (NA) level [14]. Since nicotianamine acts as
chelator for Fe, Cu and Zn, nas4x-1 mutants have a
defect in transport and allocation of these metals
throughout the plant [14]. Microarray experiments were
conducted using the Arabidopsis ATH1 GenChip (Affy-
metrix). For this study, four-week old nas4x-1 mutant
and wild type plants were exposed for 7 days to + and -
Fe supply. These conditions have been established pre-
viously and have resulted in a reproducibly strong inter-
veinal leaf chlorosis of nas4x-1 plants compared to wild
type, especially upon Fe deficiency conditions (Addi-
tional file 1, Figure S1B) [14]. The experiment was
repeated three times in consecutive weeks to obtain
three independent biological repetitions. Rosette leaves
and roots of five week-old plants were harvested and
microarray hybridization experiments were performed.
Normalized expression values (available from GEO
under />acc=GSE24348) were either processed and further ana-
lysed in GeneTrail or screened for differentially
expressed genes with the NIA array tool and subse-
quently used for GeneTrail (see experimen tal outline in
Additional file 1, Figure S1A, S1C). A total of eight
meaningful pair-wise comparisons between the eight
data sets was considered in our analysis, namely - Fe vs.
+Fe(WT),-Fevs.+Fe(nas4x-1), nas4x-1 vs. WT (+
Fe), nas4x-1 vs. WT (- Fe), for roots and leaves, respec-
tively (Additional file 1, Figure S1D).
Gene Set Enrichment Analysis (GSEA) using general
biochemical and cell biological categories from KEGG,
TRANSPATH, GO and TRANSFAC
To identify functional categories that were significantly
differentially regulated between nas4x-1 and wild type
and between + and - Fe samples we performed Gene
Set Enrichment Analysis (GSEA). GeneTrail-predefined
categories from KEGG, TRANSPATH, GO and TRANS-
FAC were used in GSEA for the eight pair-wise compar-
isons that were mentioned in the previous paragraph to
be meaningful to us (see also Additional file 1, Figure
S1D).Comparing-Fevs.+Feinwildtypewecould
identify nine induced categories belonging to four differ-
ent areas (c arbohydrate and energy, oxidoreductase
activity, defense response, nitrate and amino acid meta-
bolism), and 17 repressed categories belonging to 11 dif-
ferent areas (dolichol metabolism, cold response, prenol
metabolism, chloroplast, flavonoid metabolism, nucleo-
side metabolism, COP1, cellulose activity, fatty acid
metabolism, phototropism, DNA polymerase) (Tables 1
and Additional file 3, Table S1). When comparing
nas4x-1 samples,-Fevs.+Fe,weidentifiedfivecate-
gories of three different areas (Fe transport, protease,
secondary metabolism) that were induced, whereas three
categories of two different areas (hormone/auxin trans-
port, tubulin) were repressed (Tables 1 and Additional
file 3, Ta ble S1). When comparing + Fe samples, nas4x-
1 vs. wild type, we found that 16 categories of five dif-
ferent areas (pyrimidin metabolism, nutrient reservoir,
metal homeostasis, defense/glu cosinolate/chi tinase, gen-
eral metabolism) were induced while five categories of
three different areas (sucrose, fatty acid, protein synth-
esis) were repressed (Tables 1 and Additional file 3,
Table S1). Finally in the comparison of - Fe samples,
nas4x-1 vs. wild type, only five categories of two differ-
ent areas (metal, ATPase) were induced, and no cate-
gories were found repressed (Tables 1 and Additional
file 3, Table S1). From these data we can conclude that
the number of differentially regulated categories was
highest in the comparisons of wild type - Fe vs. + Fe (in
total 26 categories belonging to 15 areas, Tables 1 and
Additional file 3, Table S1) and of + Fe, nas4x-1 vs. wild
type (in total 21 categories belonging to eight areas,
Tables 1 and Additional file 3, Table S1) suggesting that
cellular physiology of the plants from which the samples
had been taken had been drastically affected by the
treatment ( wild type + vs. - Fe) and by the mutation (+
Fe nas4x-1 vs. wild type). On the other other hand, the
number of differentially regulated categories was low
when comparing nas4x-1 sampleswitheachother(in
total eight categories belonging to five areas, Tables 1
and Additional file 3, Table S1) and nas4x-1 with wild
type at - Fe ( in total five categories belonging to two
areas, Tables 1 and Additional file 3, Table S1). T he lat-
ter observation suggests that few cell physiological
changes had occurred between the samples which were
therefore physiologically more similar to each other at
cellular level.
When comparing leaf samples the majority of cate-
gories were also affected between wild type + and - Fe
(in total 31 categories belonging to 15 areas), while an
intermediate number of categories was hit between
nas4x-1 samples (in total twelve categories belonging to
ten areas) and between nas4x-1 and wild type at - Fe (in
total 14 categories belonging to eight areas) (Tables 1
and Additional file 3, Table S1 ). Few changes of cate-
gories were found between nas4x-1 and wil d type leaves
at + Fe (in t otal five c ategories belonging to five areas)
(Tables 1 and Additional file 3, Table S1). These com-
parisons therefore suggest that wild type + and - F e leaf
samples were physiologically very different, whereas
nas4x-1 leaf samples (+ or - Fe) and - Fe samples
(nas4x-1 or wild type) were only partially physiologically
Schuler et al. BMC Plant Biology 2011, 11:87
/>Page 4 of 10
distinct. Little physiological difference was detected
between nas4x-1 and wild type leaves upon + Fe. There-
fore, roots and leaves reacted with similar str ength to +
and - Fe. The nas4x-1 mutation had resulted in an
approximation of the - Fe w ild type situation in roots
and of the + Fe wild type cell physiological situa tion in
leaves.
Due to the diversity and little overlap of cellular cate-
gories hit in between the different comparisons we were
not able to represent the results in Venn diagrams in
any reasonable manner (not shown).
GSEA of transcriptome data using specific plant
physiology categories (MapMan)
The GeneTrail-predefined categories utilized in the pre-
vious paragraph reflected the physiologi cal status at cel-
lular level but did not appear sufficient for the
investigation at whole organism level. To circumvent
this obstacle, we performed GSEA with categories that
had been de veloped for the plant-specific visualization
tool MapMan [6]. MapMan categories could be incorpo-
rated into the GSEA tool of GeneTrail as individually
defined categories. Contrary to the GeneTrail-predefined
categories the genes of MapMan categories had been
grouped according to physiological aspect s and path-
ways relevant for plants.
The number of MapMan categories affected in the
eight meaning ful comparisons was determined as in the
previous paragraph (Tables 1 and Additional file 4,
Table S2). We found that between one and seven Map-
Man categories (induced and repressed counted
together) were hit in the eight comparisons (Tables 1
and Additional file 4, Table S2). The majority of Map-
Man categories affected was found when comparing
wild type roots + and - Fe (six categories) and leaf
nas4x-1 vs. wild type (six and seven categories for + and
- Fe, respectively) (Table 1). Only one MapMan category
was hit in the comparison of leaf + vs. - Fe, while all
other comparisons gave intermediate numbers of Map-
Man categories hit (four to fiv e) (Table 1). In total we
identified 15 different MapMan categories in all com-
parisons of root samples and 17 different MapMan cate-
gories in all comparisons of leaf samples. The data were
represented in Venn diagrams (Figure 1). This represen-
tation shows that among the 15 categories affected in
root samples three MapMan categories were shared
between at least two comparisons, namely biotic stress,
metal transport and carbohydrate metabolism (Figure
1A, C). The biotic stress category was found induced in
comparisons of - Fe vs. + Fe (in wild type and in nas4x-
1)andinnas4x-1 vs. wild type at + Fe, indicating that
biotic stress responses were generally induced by Fe
deficiency. The metal transport category was induced in
comparisons of nas4x-1 vs. wild type and between
nas4x-1 - and + Fe, showing that metal transport pro-
cesses were reoriented in nas4x-1. F inally, carbohydrate
metabolism was induced in nas4x-1 - Fe vs. + Fe and vs.
wild type - Fe suggesting that in nas4x-1 plants carbohy-
drate metabolism was altered in response to - Fe.
Among the 17 MapMan categories affected in leaf sam-
ples only two categories were hit in at least two compar-
isons as deduced from the Venn diagram (Figure 1B, D).
The photosystem category was induced in leaves in the
comparisons of nas4x-1 -Fevs.+Feandnas4x-1 vs.
wild type at - Fe indicating that nas4x-1 leaves at - Fe
experienced a remodeling of the photosynthetic appara-
tus. The MapMan category biotic stress was induced in
wild type - Fe vs. + Fe and at + Fe in nas4x-1 vs. wild
type indicating that - Fe conditions resulted in a need
for stress defense.
Table 1 Numbers of significantly enriched categories in GSEA
General biochemical and cellular categories from KEGG, GO, TRANSPATH and TRANSFAC
Roots Leaves
Comparisons induced repressed ∑ induced repressed ∑
WT - Fe vs. + Fe 9 (4) 17 (11) 26 (15) 18 (11) 13 (4) 31 (15)
nas4x-1 - Fe vs. + Fe 5 (3) 3 (2) 8 (5) 10 (8) 2 (2) 12 (10)
+Fenas4x-1 vs. WT 16 (5) 5 (3) 21 (8) 3 (3) 2 (2) 5 (5)
-Fenas4x-1 vs. WT 5 (2) - 5 (2) 11 (6) 3 (2) 14 (8)
MapMan categories
Roots Leaves
Comparisons induced repressed ∑ induced repressed ∑
WT - Fe vs. + Fe 5 1 6 1 - 1
nas4x-1 - Fe vs. + Fe 3 1 4 4 1 5
+Fenas4x-1 vs. WT 3 2 5 4 2 6
-Fenas4x-1 vs. WT 4 - 4 3 4 7
The numbers were obtained by counting induced and repressed categories of Table S1 and Table S2. In brackets are the numbers of areas into which the
corresponding enriched categories were grouped.
Schuler et al. BMC Plant Biology 2011, 11:87
/>Page 5 of 10
This analysis indicated that the incorporation of plant-
speci fic physi ological categories into GSEA added possi-
bilities for novel physiologic al interpretations a t whole
organism level that were n ot achieved by merely con-
centrating on cellular categories.
GSEA of transcriptome data using an individually
designed metal homeostasis category
Surprisingly, GSEA of MapMan categories did not reveal
hits of the transport metal category in each of t he eight
meaningful comparisons. One possible explanation
could be that metal transport was not a ffected in all
comparisons. However, an alternative interpretation
could be of technical nature that simply the transport
metal MapMan category was not complete. Indeed, this
MapMan category only contained 47 genes involved in
uptake, transport and allocation of metal ions (further
information at />ath/), whereas the list of published gene s that were
affected by altered metal distribution was larger. We
intended therefore to test a large metal homeostasis
category in GSEA. To obtain such a category, we col-
lected a nearly complete set of genes assembled from
published data of metal homeostasis genes and their
homologous genes based on sequence similarities and
created an individual, new functional category, that we
nam ed “metal homeostasis” (Additional file 5, Table S3;
the gene list of this category is available as Additional
file 6, Table S4). When performi ng GSE A this individu-
ally defined metal homeostasis category showed enrich-
ment in all eight meaningful pairwise comparisons
(Figure 1; results are available at inf.
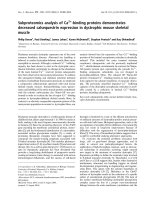
Figure 1 Venn diagrams illustrating co-regulated functional categories ( MapMan and met al homeostasis categories) in the eight
pairwise comparisons of transcriptome data. (A, B) Venn diagrams summarizing co-regulation data of enriched categories in pairwise
comparisons of (A) root and (B) leaf transcriptome data. Each circle represents the pairwise comparison indicated. The numbers indicate the
respective categories that were found enriched (see C, D). If categories were enriched in more than one comparison the respective number is
found in the overlap region of the circles. (C, D) Designation of categories that were found enriched in (C) root comparisons and (D) leaf
comparisons. Red coloured numbers indicate induced categories, green coloured numbers indicate repressed categories.
Schuler et al. BMC Plant Biology 2011, 11:87
/>Page 6 of 10
uni-sb.de/paper/ath/ ). The cate gory was found induced
in all comparisons of root samples with - Fe vs. + Fe
and nas4x-1 vs. wild type, as well as of leaf samples with
wild type - Fe vs. + Fe and + Fe nas4x-1 vs. wild type
(Figure 1). The category was repressed in leaf compari-
sons of nas4x-1 -Fevs.+Feand-Fenas4x-1 vs. wild
type (Figure 1).
Thus, changes in exter nal Fe supply or in internal reg-
ulators of metal chelation and transport resulted in sig-
nificant alterations of gene expression patterns of an
entire category of genes representing the components
for metal homeostasis.
Over Representation Analysis (ORA) of 258 differentially
expressed genes
Finally, we aimed at utilising GeneTrail to identify func-
tional categories among selected significantly differen-
tially expressed genes that could be revealed from our
transcriptome data [19]. To identify a list of significantly
differentially expressed genes we used the NIA array
analysis software tool to analyze the eight meaningful
pairwise comparisons. Root and leaf samples were con-
sidered separately from each other. The pairwise com-
parisons of expression values revealed a total number of
226 leaf-specific and 32 root-specific differentially
expressed genes (Additional file 7, Table S5). These 258
genes showed a differential expression in at least one
single pairwise comparison in the NIA Array analysis.
With this data set we performed an Over Representation
Analysis (ORA) to test whether among the 258 differen-
tially expressed genes specific biological categories or
pathways were aff ected. When an ORA was performed
with the GeneTrail-predefined categories from KEGG,
GO, TRANSPATH and TRANSFAC no category was
enriched within the 258 selected genes compared to all
thegenesontheATH1genechip.UponORAwith
MapMan categories seven MapMan categories were
enriche d (Table 2). Amon g the enriched categories were
two metal specific categories, named “metalhandling,
binding, chelation and storage” and “ transport metal”,
two different oxidative stress categories, both named
“ redox.dismutases and catalases” ,acelldivision,a
GCN5-related N-acetyltransferase and a non-assigned
category (Table 2). We also performed ORA with the
metal homeostasis category that we have designed indi-
vidually as described above. This category w as found
enriched as expected. Hence, we conclude from ORA
analysis of the differentially expressed genes that metal
homeostasis as a category was preferentially affected in
our experimental conditions. In conclusion, ORA of
pre-selected genes allowed to interpret transcriptome
data in meaningful physiological contexts.
Discussion
Here, w e mined comparative Arabidopsis transcriptome
data and identified differentially regulated functional
categories and pathways using the web-based tool Gene-
Trail, by performing Gene Set Enrichment Analysis
(GSEA) of eight meaningful pairwise comparisons
between leaf and root, nas4x-1 mutant versus wild type
samples, in response to + vs. - Fe. From our data analy-
sis we were able to determine differential numbers and
types of enriched functional categories for the respective
comparisons. Hence, we could ch aracteri ze phenotypes
at cell biological level, at whole-organism physiological
level and with respect to metal homeostasis. 258 differ-
entially expressed genes were identified from the eight
meaningful pairwise comparisons. By Over-Repre senta-
tion Analysis (ORA) of these pre-selected genes we
could determine that five plant physiological categories
were overrepresented among them. The example we
presented here can also be used as an outline that
guides researchers through microarray analysis with the
aim of identifying regulated functional c ategories of
genes in plants. GeneTrail was found part icularly useful
for plant physiological analysis due to its feature that
allowed incorporation of individually defined functional
categories.
Table 2 Enriched MapMan categories testing the 258 NIA pre-selected genes compared to all the genes present on
the ATH1 gene chip in the ORA
Enriched categories Associated genes
metalhandling.binding,
chelationandstorage
NAS3, ATCCS, ATFER4, ATFER3, CCH, ATFER1, NAS1, NAS2
redox.dismutasesandcatalases ATCCS, CSD2, FSD1
redox.dismutasesandcatalases WRKY60 WRKY46 WRKY47 WRKY53 WRKY48
transport.metal NRAMP3, MTPA2, IRT2, ZIP5, HMA5, YSL1
cell.division AT1G49910 AT1G69400 CDKB1;2 APC8 ATSMC3
misc.gcN5-related N-
acetyltransferase
AT2G32020 AT2G32030 AT2G39030
notassigned.noontology AT3G07720 AT5G52670 AT1G09450 CENP-C COR414-TM1ZW9 AT1G76260 ATNUDT6 ATEXO70H4 AT3G14100
ATNUDX13 AT4G36700
The table illustrates those genes among the 258 NIA preselected genes, which are associated with enriched categories.
Schuler et al. BMC Plant Biology 2011, 11:87
/>Page 7 of 10
Confirmation of molecular phenotypes by GSEA, and
identification of differentially expressed categories
GSEA of general biochemical and cell biological cate-
gories demonstrated that roots and leaves of wild type
plants had reacted with similar strength to - Fe. 26 and
31 categories in total were differentially regulated in
wild type roots and leaves, respectively, between + and -
Fe. This number of enriched categories was higher than
that of any comparisons involving nas4x-1 samples.
Multiple reasons may have accounted for differential
regulation of these categories. Regulation of the category
might indicate an adaptation to Fe deficiency stress such
as for example defense responses. Alternatively, the lack
of Fe as a cofactor for specific enzyme activities may
have led to deregula ted gene expression of these
enzymes due to feedback control, such as for example
oxidoreductase activity, nitrate and amino acid metabo-
lism. The lowered photosynthetic activity at - Fe may
also have caused extensive metabolic changes for pro-
duction of anaerobic energy as represented for example
by carbohydrate and energy categories.
The lowest numbers of differentially regulated cate-
gories were detected between roots - Fe, nas4x-1 vs.
wild type, and leaves + Fe, nas4x-1 vs. wild type. We
conclude from these numbers of regulated categories
that + Fe nas4x-1 mutant root cells had approximated
the cellular status present in - Fe wild type roots, while
+Fenas4x-1 mutant leaf cells had reacted closest to
those of + Fe wild type cells. These findings correlated
well with our previous analysis of the nas4x-1 mutant.
Based on our previous investigation of Fe content, regu-
lation of Fe deficiency genes, YSL2 transporter and ferri-
tingeneswehadproposedthatthelackof
nicotianamine had caused increased Fe deficiency
responses in the root, but Fe deficiency and sufficiency
responses in the leaves [14]. Although the comparison
of the numbers of regulated cell biological categories
was meaningful to us, the exact nature of these cate-
gories was not suitable for finding overlaps in regulatory
patterns between different samples. Due to this lack of
overlaps we were not able to represent the results in
Venn diagrams. One possible explanation for this puz-
zling finding could be that the cell biological categories
contained mostly rather few genes so that the diversity
of categories was high. Perhaps if the high number of
general categories derived from KEGG, GO, TRANS-
FAC and TR ANSPATH was rea ssembled into areas
each comprising several of the categories more overlap
in regulatory patterns may become appar ent, e.g.
through assembly of individual pyrimidine, purine and
nucleoside metabolism into a large nucleoside/nucleo-
tide metabolism category, or of individual leucine, tyro-
sine, etc. categories into a large N metabolism category.
Interestingly, the above conclusion about the cell phy-
siological status of mutant and wild type situations was
not possible when analyzing MapMan plant physiologi-
cal categories. In those cases, a low numb er of differen-
tially expressed categor ies was found for the comparison
of wild type, + vs. - Fe, wherea s the highest number was
revealed in the comparison of - Fe, nas4x-1 vs. wild
type. A reason could be that the enriched plant physio-
logical MapMan categories had represented adaptations
to + or - Fe, mutant or wild type at whole organ level
rather than at cellular level, such as for example stress
responses. On the other hand, the MapMan categories
comprised plant-specific categories like plant hormone
metabolism and regulation which could be made
responsible for conferring adaptations at cellular level so
that cellular differences became more or less apparent.
GSEA with a nearl y complete metal homeostasis cate-
gory showed that in all meaningful pairwise compari-
sons, b etween + and - Fe, wild type and nas4x-1
samples, metal homeostasis was found affected. The
metal homeostasis category contained many genes
involved in metal transport or metal regulation
assembled from studies reporting m ainly their up-regu-
lation in response to - Fe. From the observation that
this category was found induced in wild type - vs. + Fe
in roots and in leaves we can deduce that indeed the
metal homeostasis category was an indicator for Fe defi-
ciency responses. In all root comparisons of nas4x-1 vs.
wild type and of - Fe vs. + Fe this category was induced
and hence the nas4x-1 mutant status of roots can be
considered Fe-deficient, in agreement with the above
findings on cell biological categories and the previous
findings reported [14]. On the other hand, we have pre-
viously determined that nas4x-1 leaf cells showed par-
tially signs of Fe deficiency and partially of Fe
sufficiency. This was reflected by the observation that in
the comparisons of leaf samples the metal homeostasis
category was found induced and repressed, respectively.
Only from GSEA results of MapMan and the m etal
homeostasis categories we were able to construct mean-
ingful Venn diagrams that revealed overlaps in regula-
tory patterns between the different samples. In roots
and partially in leaves (under - Fe vs. + Fe) and at + Fe
(nas4x-1 vs . wild type) we found induction of the biotic
stress cat egory, indicativ e of an adaptat ion to avoid
pathogen infection under - Fe. Carbohydrate metabolism
was also affected in multiple pairwise comparisons indi-
cative of altered sugar utilization due to reduced photo-
synthesis at - Fe. In leaves, photosystem regulation was
apparent as major regulated category. Hence, the metal
homeostasis, biotic stress, root carbohydrate and leaf
photosystem categories were the main ta rgets for regu-
lated changes in response to - Fe and nas4x-1.
Schuler et al. BMC Plant Biology 2011, 11:87
/>Page 8 of 10
Identification of major regulated categories among
differentially expressed genes using a combination of
ORA and GSEA
TheabovediscussedGSEAresultsmighthavemasked
regulated categories if they contained few differentially
regulated genes but a high number of unregulated genes.
To circumvent this potential obstacle we identified from
our transcriptome data all genes that were differentially
expressed in any of the meaningful pairwise compariso ns
and performed Over-Representation Analysis (ORA).
None of the gen eral cell biological categories was over-
represented among these 258 genes. An explanation for
this finding could be again that the categories from
KEGG, GO, TRANSFAC and TRANSPATH were too
low in size, unspecific and diverse for statistical analysis.
On the other hand, ORA with MapMan categories identi-
fied sever al meaningful functional pathways diffe rentially
regulated in response to Fe supply and nas4x-1. In addi-
tion to metal homeostasis categories, this analysis
revealed redox dismutase and catalase categories, a cell
division and a GCN5-related N-acetyltransferase cate-
gory. The reappearance of the metal homeostasis cate-
gories not only in GSEA but also in ORA shows again
how significantly this path way was affected in the tran-
scriptome comparisons. As discussed above, an influence
of - Fe and of nas4x-1 on metal hom eostasis was
expected from previous analysis and represented here a
positive control for proper functioning of the GeneTrail
tool. Redox dismutase and catalase genes were differen-
tially regulated presumably because these enzymes often
use Fe as cofac tor. Low enzyme activit y at - Fe may have
resulted in differential expression as the result of a feed-
back control. Alternatively, upon - Fe new enzyme iso-
forms with different metal requirements might have been
produced. It is also reasonable to argue that decreased Fe
toxicity upon - Fe might have been the cause for the dif-
ferential regulation of these genes. The differentially
regulated cell division category may have reflected an
adaptation o f root growth behaviour. Finally, the GCN5-
related N-acetyltransferase category represented specifi-
cally genes in volved in histone acetylation, a process
ass ociated generally wi th gene activation. This st udy and
others have shown that - Fe conditions caused an up-reg-
ulation of genes and proteins that was more important
than a down-regulation [22-24]. It is therefore plausible
that genes and enzymes involved in histone acetylation
were activated to r ender more chromosomal areas acces-
sible to the transcription machineries.
Conclusion
Analysis of differentially regulated functional categories
confirmed that the nas4x-1 mutant is defective in metal
homeostasis. The mutant was found to show Fe defi-
ciency signs in roots and signs of Fe deficienc y and Fe
sufficiency in leaves. Biotic stress, root carbohydrate, leaf
photosystem and specific cell biological categories were
also discovered as ma in targets for regulated changes in
response to - Fe and nas4x-1. 258 genes differentially
expressed in response to - Fe and nas4x-1 were identi-
fied. Among these genes, five functional categories were
enriched including metal transport and metal binding,
redox regulation, cell division and histone acetylation.
GeneTrail is therefore generally highly suitable to reveal
functional categories among comparative transcriptome
data in Arabidopsis. We could use the quantitative and
qualitativ e aspects provided by GSEA to interpret mole-
cular-physiological phenotypes. A combination of the
GeneTrail analysis methods, GSEA and ORA, together
with other analysis tools, like the NIA array tool, was
successfully applied for data mining. The main strength
of GeneTrail was that it offered answers to individual
biological questions with its feature of incorporation of
individually defined categories (such as MapMan and
metal homeostasis). Hence, GeneTrail can be applied to
analyze novel physiological treatments or unknown
mutations to identify functional pathways that are
affected.
Web links
GeneTrail
/>NIA Array Analysis
/>Web-site containing links to GSEA and ORA results
/>Additional material
Additional file 1: Figure S1: Overview of the experimental set-up.
(A) Scheme showing three biological repetitions (R1, R2, R3) harvested in
three consecutive weeks for the microarray experiment. (B) Images of
nas4x-1 and wild type plants grown for four weeks under Fe supply (10
μM Fe) and one week under Fe supply or Fe deficiency (0 Fe) conditions,
respectively. (C) Work flow of transcriptome and bioinformatic analysis.
(D) Eight meaningful comparisons for root and leaf samples.
Additional file 2: Figure S2: Types of running sum statistics when
applying a Gene Set Enrichment Analysis. (A) Mountain-like graph; in
this example the enriched category “iron ion binding” illustrates a
mountain-like graph for top-ranked genes in the comparison of wild
type leaves + Fe vs. - Fe, indicating that genes of this category were
mostly induced at + Fe. (B) Valley-like graph; in this example the
enriched category “Golgi vesicle transport” illustrates a valley-like graph
for bottom-ranked genes in the comparison of wild type roots + Fe vs. -
Fe, indicating that genes of this category were mostly repressed under +
Fe.
Additional file 3: Table S1: Selection of significantly enriched
categories in the GSEA using GeneTrail-predefined GO, KEGG,
TRANSPATH and TRANSFAC categories.
Additional file 4: Table S2: Selection of significantly enriched
categories in the GSEA using MapMan categories.
Schuler et al. BMC Plant Biology 2011, 11:87
/>Page 9 of 10
Additional file 5: Table S3: Annotated gene list of the self-defined
category “metal homeostasis”.
Additional file 6: Table S4: Gene list of the self-defined category
metal homeostasis.txt.
Additional file 7: Table S5: Gene list of 258 NIA selected genes.txt.
Abbreviations
GO: gene ontology; GSEA: Gene set enrichment analysis; KEGG: Kyoto
enzyclopedia of genes and genomes; NA: nicotianamine; ORA: Over-
representation analysis
Acknowledgements and Funding
The authors would like to thank Björn Usadel for kindly providing relevant
MapMan Arabidopsis thaliana information for this study. This work has been
funded by a Deutsche Forschungsgemeinschaft (DFG) grant to PB.
Author details
1
Dept. of Biosciences - Botany, Campus A2.4, Saarland University, D-66123
Saarbrücken, Germany.
2
Dept. of Informatics - Center for Bioinformatics,
Campus E1.1, Saarland University, D-66123 Saarbrücken, Germanys.
3
Dept.
Biology I - Plant Biochemistry and Physiology, Biocenter of the Ludwig-
Maximilians-University München, Großhadernerstr. 2-4, D-82152 Planegg-
Martinsried, Germany.
Authors’ contributions
MS drafted the manuscript, established the experimental design and
conducted the experimental work, performed plant growth, sample
preparation and data analysis. KP performed the microarray work and
revised the manuscript critically. AK performed pre-processing and statistical
analysis of the microarray data. CB conducted adaptations of the GeneTrail
software for the use of Arabidopsis thaliana. CB and AK supported the
application of GeneTrail and revised the manuscript critically. HPL supervised
the computational work on the GeneTrail software. PB conceived, designed
and supervised the experimental design and participated in drafting the
manuscript. All authors have read and approved the final manuscript.
Received: 17 May 2010 Accepted: 18 May 2011 Published: 18 May 2011
References
1. Edgar R, Domrachev M, Lash AE: Gene Expression Omnibus: NCBI gene
expression and hybridization array data repository. Nucleic Acids Res 2002,
30:207-210.
2. Sherlock G, Hernandez-Boussard T, Kasarskis A, Binkley G, Matese JC,
Dwight SS, Kaloper M, Weng S, Jin H, Ball CA, Eisen MB, Spellman PT,
Brown PO, Botstein D, Cherry JMl: The Stanford Microarray Database.
Nucleic Acids Res 2001, 29:152-155.
3. Winter D, Vinegar B, Nahal H, Ammar R, Wilson , Greg V, Provart J: An
“electronic fluorescent pictograph” browser for exploring and analyzing
large-scale biological data sets. PLoS ONE 2007, 2:e718.
4. Zimmermann P, Hirsch-Hoffmann M, Hennig L, Gruissem W:
GENEVESTIGATOR. Arabidopsis microarray database and analysis
toolbox. Plant Physiol 2004, 136:2621-2632.
5. Toufighi K, Brady SM, Austin R, Ly E, Provart NJ: The Botany Array
Resource: e-Northerns, Expression Angling, and promoter analyses. Plant
J 2005, 43:153-163.
6. Thimm O, Blasing O, Gibon Y, Nagel A, Meyer S, Kruger P, Selbig J,
Muller LA, Rhee SY, Stitt M: MAPMAN: a user-driven tool to display
genomics data sets onto diagrams of metabolic pathways and other
biological processes. Plant J 2004, 37:914-939.
7. Obayashi T, Kinoshita K, Nakai K, Shibaoka M, Hayashi S, Saeki M, Shibata D,
Saito K, Ohta H: ATTED-II: a database of co-expressed genes and cis
elements for identifying co-regulated gene groups in Arabidopsis.
Nucleic Acids Res 2007, 35:D863-9.
8. Obayashi T, Hayashi S, Saeki M, Ohta H, Kinoshita K: ATTED-II provides
coexpressed gene networks for Arabidopsis. Nucleic Acids Res 2009, 37:
D987-91.
9. Katari MS, Nowicki SD, Aceituno FF, Nero D, Kelfer J, Thompson LP,
Cabello JM, Davidson RS, Goldberg AP, Shasha DE, Coruzzi GM,
Gutierrez RA: VirtualPlant: a software platform to support systems
biology research. Plant Physiol 2009, 152:500-515.
10. Backes C, Keller A, Kuentzer J, Kneissl B, Comtesse N, Elnakady YA, Muller R,
Meese E, Lenhof HP: GeneTrail–advanced gene set enrichment analysis.
Nucleic Acids Res 2007, 35:W186-92.
11. Keller A, Ludwig N, Backes C, Romeike BF, Comtesse N, Henn W, Steudel WI,
Mawrin C, Lenhof HP, Meese E: Genome wide expression profiling
identifies specific deregulated pathways in meningioma. Int J Cancer
2009, 124:346-351.
12. Elnakady YA, Rohde M, Sasse F, Backes C, Keller A, Lenhof HP, Weissman KJ,
Muller R: Evidence for the mode of action of the highly cytotoxic
Streptomyces polyketide kendomycin. Chembiochem 2007, 8:1261-1272.
13. Fehrmann RS, de Jonge HJ, Ter Elst A, de Vries A, Crijns AG, Weidenaar AC,
Gerbens F, de Jong S, van der Zee AG, de Vries EG, Kamps WA, Hofstra RM,
Te Meerman GJ, de Bont ES: A new perspective on transcriptional system
regulation (TSR): towards TSR profiling. PLoS ONE
2008, 3:e1656.
14. Klatte M, Schuler M, Wirtz M, Fink-Straube C, Hell R, Bauer P: The analysis
of Arabidopsis nicotianamine synthase mutants reveals functions for
nicotianamine in seed iron loading and iron deficiency responses. Plant
Physiol 2009, 150:257-271.
15. Clausen C, Ilkavets I, Thomson R, Philippar K, Vojta A, Mohlmann T,
Neuhaus E, Fulgosi H, Soll J: Intracellular localization of VDAC proteins in
plants. Planta 2004, 220:30-37.
16. Duy D, Wanner G, Meda AR, von Wiren N, Soll J, Philippar K: PIC1, an
Ancient Permease in Arabidopsis Chloroplasts, Mediates Iron Transport.
Plant Cell 2007.
17. Bolstad BM, Irizarry RA, Astrand M, Speed TP: A comparison of
normalization methods for high density oligonucleotide array data
based on variance and bias. Bioinformatics 2003, 19:185-193.
18. Rafael AIrizarry: Summaries of Affymetrix GeneChip probe level data.
Nucleic Acids Research 2003, 31:15e-15.
19. Keller A, Backes C, Al-Awadhi M, Gerasch A, Kuntzer J, Kohlbacher O,
Kaufmann M, Lenhof HP: GeneTrailExpress: a web-based pipeline for the
statistical evaluation of microarray experiments. BMC Bioinformatics 2008,
9:552.
20. Keller A, Backes C, Lenhof HP: Computation of significance scores of
unweighted Gene Set Enrichment Analyses. BMC Bioinformatics 2007,
8:290.
21. Sharov AA, Dudekula DB, Ko MS: A web-based tool for principal
component and significance analysis of microarray data. Bioinformatics
2005, 21:2548-2549.
22. Dinneny JR, Long TA, Wang JY, Jung JW, Mace D, Pointer S, Barron C,
Brady SM, Schiefelbein J, Benfey PN: Cell identity mediates the response
of Arabidopsis roots to abiotic stress. Science (New York, N.Y.) 2008,
320:942-5.
23. Brumbarova T, Matros A, Mock H-P, Bauer P: A proteomic study shows
differential regulation of stress, redox regulation and peroxidase
proteins by iron supply and the transcription factor FER. Plant J 2008.
24. Thomas JWYang, Wolfgang Schmidt W-DL: Transcriptional Profiling of the
Arabidopsis Iron Deficiency Response Reveals Conserved Transition
Metal Homeostasis Networks. Plant Physiol 2010, 10:109.
doi:10.1186/1471-2229-11-87
Cite this article as: Schuler et al.: Transcriptome analysis by GeneTrail
revealed regulation of functional categories in response to alterations
of iron homeostasis in Arabidopsis thaliana. BMC Plant Biology 2011
11:87.
Schuler et al. BMC Plant Biology 2011, 11:87
/>Page 10 of 10