báo cáo khoa học: "Prospecting for Genes involved in transcriptional regulation of plant defenses, a bioinformatics approach" pdf
Bạn đang xem bản rút gọn của tài liệu. Xem và tải ngay bản đầy đủ của tài liệu tại đây (5.64 MB, 12 trang )
RESEARC H ARTIC L E Open Access
Prospecting for Genes involved in transcriptional
regulation of plant defenses, a bioinformatics
approach
Marcel C van Verk, John F Bol and Huub JM Linthorst
*
Abstract
Background: In order to comprehend the mechanisms of induced plant defense, knowledge of the biosynthesis
and signaling pathways mediated by salicylic acid (SA), jasmonic acid (JA) and ethylene (ET) is essen tial. Potentially,
many transcription factors could be involved in the regulation of these pathways, although finding them is a
difficult endeavor. Here we report the use of publicly available Arabidopsis microarray datasets to generate gene
co-expression networks.
Results: Using 372 publicly available microarray data sets, a network was constructed in which Arabidopsis genes
for known components of SA, JA and ET pathways together with the genes of over 1400 transcription factors were
assayed for co-expression. After determining the Pearson Correlation Coefficient cutoff to obtain the most probable
biologically relevant co-expressed genes, the resulting network confirmed the presence of many genes previously
reported in literature to be relevant for stress responses and connections that fit current models of stress gene
regulation, indicating the potential of our approach. In addition, the derived network suggested new candidate
genes and associations that are potentially interesting for future rese arch to further unravel their involvement in
responses to stress.
Conclusions: In this study large sets of stress related microarrays were used to reveal co-expression networks of
transcription factors and signaling pathway components. These networks will benefit further characterization of the
signal transduction pathways involved in plant defense.
Keywords: Co-expression analysis, salicylic acid-induced, jasmonic acid-induced, ethylene-induced, defense
response, signal transduction, Arabidopsis, transcription factors
Background
Plants exposed to biotic and abiotic stress activate var-
ious signal transduction pathways, like the salicylic acid
(SA)-, jasmonic acid (JA)-, ethylene (ET)-, and abscisic
acid (ABA)-mediated signaling pathways that act singly
or in combinations to evoke the most appropriate
defense response [1-6]. For example, attack by patho-
gens results in extensive crosstalk between the SA-, JA-
and ET-signaling pathwa ys, implicating complex regula-
tory networks underlying the plant’s pathogen defense
[3]. Arabidopsis contains almost 1500 genes encoding
transcription factors [7] and it is safe to assume that
many are involved in regulation of these defense-signal-
ing pathways. However, the precise regulatory mechan-
isms and the transcription factors involved a re mostly
still unknown. To fine-tune the initiated defense
responses the biosynth esis and signaling pathways influ-
ence each other via crosstalk. This makes discovery of
novel regulatory elements w ithin these pathways even
more challenging.
The signaling that leads to defense proceeds via interac-
tions of signaling pathway components and because of
this, the genes involved are often expressed under similar
conditions. This makes thei r expression cooperatively
regulated and their exp ression patterns highly s imilar.
Based on this concept, an analysis of co-regulated genes
under a variety of conditions can give valuable information
* Correspondence:
Institute of Biology, Leiden University, Sylvius Laboratory, Sylviusweg 72,
2333 BE Leiden, The Netherlands
van Verk et al. BMC Plant Biology 2011, 11:88
/>© 2011 van Verk et al; licensee BioMed Central Ltd. This is an Open Access article distributed under th e terms of the Creative
Commons Attribution License (http://creative commons.org/licenses/by/2.0), which permits unrestricted use, distribution, and
reproduction in any medium, provided the original work is properly cited.
for understanding the possible regulatory mechanisms
involved in defense responses. Any dataset consisting of at
least two experiments can be used to perform a co-expres-
sion analysis, although for an analysis that is independent
of the experimental conditions, a minimum of approxi-
mately 100 experiments is needed [8].
To investigate co-expressed genes in Arabidopsis
many co-expression databases from different micro-
array sources with hund reds of experim ental conditions
per dataset have been developed in the last couple of
years, such as Gene Expression Omnibus (http://www.
ncbi.nlm.nih.gov/geo/[9]), ArrayExpress (.
ac.uk/microarray-as/ae/[10]), (http://
csbdb.mpimp-golm.mpg.de[ 11]), Genevestigator (http://
www.genevestigator.com[12-14 ]), The Botany Array
Resource (BAR; ronto .ca[15]), Ara-
bidopsis Co-expression Data Mining Tool (ACT; http://
www.arabidopsis.leeds.ac.uk/act/[16]), ATTED-II (http://
atted.jp[17-19]), AtGenExpress/PRI ME (.
riken.jp/[20]), and CressExpress (ssex-
press.org[21]). Many of these databases only accept sin-
gle-gene queries for analysis of a correlation coefficient.
To obtain full flexibility in analysis method, data selec-
tion, filtering, etc., a more tailor made approach is
needed. This can only be achieved after downloading
the datasets and perform a manual analysis, which
requires considerable computer power and knowledge
about analysis methods, which is n ot essential for most
of the available online tools.
Within the plant field there is an increasing number
of publications that report the finding of biologically
relevant ge nes involved in certa in pathways via co-
expression analysis. Examples are: genes involved in root
development [22], genes involved in mitochondrial func-
tions [23], clusters of genes involved in primary and sec-
ondary cell wall formation [24], Myb transcription
factors responsible for initiation of aliphatic glucosino-
late biosynthesis [25], and clusters of genes in a network
related to cold stress and biochemi cal pathways [26]. In
all these cases co-expression analysis assisted in building
a network that linked unknown regulatory elements to
already described pathways and helped expand hypoth-
eses on how the genes in the network were regulated.
Although co-expression analysis tools are powerful in
lead discovery, they cannot guarantee that observed co-
expression of genes is biologically relevant. Further analy-
sis using the ‘cla ssical’ genomic and/or metabolo mic
approaches will still be necessary to confirm the involv e-
ment of the discovered genes. Despite this, co-expression
analysis has proven itself as a very powerful tool in the
discovery of new targets for analysis in pathways or net-
works of interest, as it can much more rapidly provide
insight into potentially important networ k genes than
random gain of function or loss of function approaches.
Here we report findings from a co-expression analysis
covering a large number of microarray data sets derived
from stress-induced Arabidopsis. In addition to genes
already known to be involved in various stress-response
pathways, a large number of new candidate genes were
identified that potentially participate in regulation of
stress-responses.
Results and Disc ussion
Public Microarray Data Selection
To discover new leads in the transcriptional regulation
of the S A, JA and ET biosynthesis and signaling path-
ways under stress conditions an analysis of multiple
transcriptome co-expression profiles was setup. For a
flexible setup that is not limited to predefined settings,
datasets or processing of samples, a dataset was do wn-
loaded from the TAIR website ( />Microarrays/a nalyzed_data/). This dataset consists of
1436 Affymetrix Arabidopsis 25K arrays obtained from
NASCArrays and AtGenExpress. All microarrays were
normalized by TAIR using the robust multi-array
method (RMA).
To focus on stress-related SA, JA and ET biosynthesis
and signaling pathways we performed a bi-clustering of
all WRKY transcription factors spotted on the Affyme-
trix arrays versus a selected set of microarray data
obtained from a variety of stress conditions. The stress
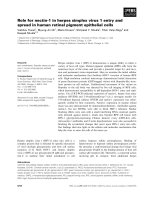
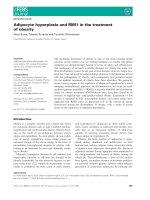
data set of 372 microarrays as listed in Figure 1D was
selected from the total of 1436 currently available
microarrays. An overview of these 372 microarrays is
given in Additional file 1, Table 1. For comparison, a set
consisting of 237 development-related microarrays and a
set consisting of all 1436 available microarrays were also
analyzed. Hierarchical cluster trees with complete link-
age and dendogram cutoffs of 0.50 were added for both
the experimental c onditions and the WRKY genes, and
visualized using different colors. The result of this bi-
clustering is shown in Figure 1A. The colors of the bar
below the bi-clustering matrix correspond to the colored
sets of arrays as denoted in Figure 1D. Similar bi-clus-
terings of WRKY gene expression profiles were per-
formed with the subset of development-related
microarrays and with the set containing all micro-arrays.
The hierarchical cluster trees for the latter bi-clusterings
are shown in Figures 1B and 1C, respectively.
It is evident that substantial differences occur in the
hierarchical clustering of the WRKYs between the three
sets of arrays. WRKY genes with coordinated expression
patterns clustering c lose together under conditions of
stress (Figure 1A) appeared not necessarily also co-regu-
lated during development (Figure 1B). E.g., WRKYs 19
and 4 (Figure 1A, top) were clustered close together in
the same sub-tree when the bi- clustering was done with
the set of stress microarrays, but were situated far apart
van Verk et al. BMC Plant Biology 2011, 11:88
/>Page 2 of 12
in separate sub-trees when the development-related
arrays were used. The same is the case for WRKYs 28
and 46 (see below). Therefore, to maximize the prob-
ability that only biologically relevant correlations were
obtained, we chose to use the dataset of the stress-
related microarrays listed in Figure 1D to investigate co-
expression of genes involved in the SA, JA and ET
pathways.
Figure 1 Bi-clustering of WRKY genes under different experimental conditions. Bi-clustering of WRKY genes under stress conditions (A),
development-related processes (B), and all micro-arrays in the dataset (C). The colors in the bar underneath the bi-clustering in panel A correspond
to the colored datasets of the selected microarray experiments listed in (D). The numbers on the left side of the bi-clustering indicate the
corresponding WRKY numbers. Similarly colored branches within the dendogram represent groups with a linkage between nodes lower then 0.50.
The color range in the bi-clustering matrix ranges from +3 (red, above average expression) to -3 (green, below average expression).
van Verk et al. BMC Plant Biology 2011, 11:88
/>Page 3 of 12
Target Gene Selection and Co-expression Cutoff
Determination
To elucidate new transcription factors regulating SA, JA
and ET biosynthesis and signaling pathways we com-
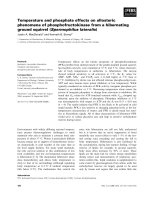
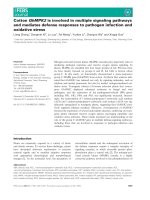
posed a set of genes consisting of all color-coded genes
indicated in Figure 2. This set comprises many well-
documented genes attributed to the respective stress-
signaling pathways [4]. This set was supplemented with
a set of genes encoding almost 1400 transcription fac-
tors according to Czechowski et al. [7] and with the
genes for the known JAZ repressor pro teins and a num-
ber of other known regulators of these pathways. A list-
ing of the genes in the set i s given in Additional file 1,
Table 1. To determine the Pearson Correlation Coeffi-
cient (PCC) cutoff for finding biologically relevant co-
expressed genes and networks, various approaches c an
be applied. Several of these approaches are reviewed by
Borate et al. [27] including maximal cliques, spectral
graph clustering, correlation of control spots with
expressed genes, top 1% of correlations, Bonferroni cor-
rected p-values, and statistical power. The first two
methods resulted in the most biological reliable PCC
cutoffs. Since a maximal cliques approach required
more computational power than we had available and
the spectral graph clustering easily results in cutoffs that
are 0.05 off, we chose to apply the approach as
described by Aoki et al. [8]. Their method, based on
density of the network combined with decreasing num-
ber of nodes and edges with higher PCC values, closely
approaches the biological relevant PCC and is ea sy to
implement for biologists with modest computing power.
The number of nodes (genes), edges (links between
genes), the network density (a ratio of the observed
number of edges to all possible edge s), and the number
of individual clusters obtained using the MCODE algo-
rithm was determined for different PCC cutoffs using
the genes listed in Additional file 1, Table 1 and Figure
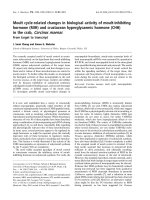
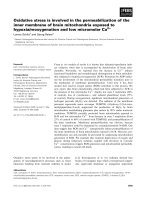
2. The results are visualized in Figure 3A-D. The total
number of nodes and edges increased with a decreasing
PCC threshold (Figure 3A and 3B). In Figure 3A a linear
increase in the number of nodes that have at least one
link with another node is found between 0.62 and 0.82.
On the other hand, the number of edges below a cutoff
of 0.70 starts to rapidly increase (Figure 3B), indicating
that the available nodes become more densely connected
as can also be seen with the increase in network density
Figure 2 Visual representation of the JA/SA/ET biosynthesis and signaling pathways. Dark green boxes, MAPK kinases leading from
flagellin to defense genes; red boxes, genes within the SA biosynthesis pathway; purple boxes, MAPK kinases leading to repression of SA and
induction of JA defense genes; yellow boxes, genes involved in JA biosynthesis; light blue boxes, genes involved in ET biosynthesis; pink boxes,
genes involved in ET signaling.
van Verk et al. BMC Plant Biology 2011, 11:88
/>Page 4 of 12
below this cutoff (Figure 3C). The region from 0.70 to
0.85 in Figure 3C indicates the minimum network den-
sity. According to the analysis of Aoki et al. [8] the
most biological relevant PCC cutoff is found above
these values. Combined, the data of Figure 3A-C leaves
a relevant range for the cutoff between 0.70 to 0.82. To
evaluate the number of c lusters related to this range of
closely co-regulated genes inside the network, the
Figure 3 Pearson correlation coefficient cutoff determination and co-expression network. (A) Graph of the number of nodes with at least
one link for each PCC cutoff. (B) Graph of the number of edges between nodes for each PCC cutoff. (C) Graph of the network density for each
PCC cutoff. (D) Graph of the total number of clusters determined with the MCODE algorithm for each PCC cutoff. (E) Visualization using
Cytoscape of the co-expression network. Blue-dots, on microarray spotted selection of >1400 transcription factors and JAZ proteins; other
colored dots represent similarly colored genes from Figure 2.
van Verk et al. BMC Plant Biology 2011, 11:88
/>Page 5 of 12
MCODE algorithm was used to determine the number
of clusters for decreasing PCC values between 0.9 and
0.5 at 0.01 intervals (Figure 3D). The number of clusters
increases steadily when lowering the PCC cutoff from
0.90 to approximately 0.70 after which it stabilizes
between 0.72 and 0.60 and at lower thresholds even
decreases. Combining the ranges of 0.60 to 0.72 and
0.70 to 0.82 made us choose the lowest overlapping cut-
off of 0.70 for where biologically significant modules are
most likely to be expected. We have not investigated
networks of genes that are up-regulated in one set and
down-regulated in the other (as would be represented
by a negative PCC).
Using the PCC threshold of 0.70 a co-expression net-
work was constructed and visualized with Cytoscape (Fig-
ure 3E). The blue dots represent the selection of
transcription factors and JAZ proteins having at least one
edge (i.e. sharing at least one connection with other
genes), and the colored dots represent the correspondingly
colored genes from Figure 2. The total co-expression net-
work thus obtained consists of 808 nodes that share 5951
edges. Statistical verification of our choice of cutoff by cal-
culation of Bonferroni corrected p-values cannot be
applied with data sets of this size, since cutoffs of as little
as 0.2 can easily become statistically highly significant,
while biological relevance at this low cutoff would be unli-
kely [28]. However, close co-expression of genes as
deduced from our constructed network matched well with
correlations found in literature (see below). Moreover, bio-
chemical and functional analysis with gene sets selected
from our network further supported its robustness [29].
Exploration of Co-expressed Closest Neighbor
Transcription Factors of Regulatory Genes
The closest neighbors with a single edge distance from the
regulatory genes shown in Figure 2 were separated in mul-
tiple sub cluster networks (Figures 4, 5 , 6 and 7). The
MAP kinase pathway from flagellin to defense genes
(Figure 2, dark green boxes) is depicted in Figure 4A, and
the MAP kinase pathway leading to the suppression of SA
and induction of JA defense genes (Figure 2, purple boxes)
is shown in Figure 4B. The network of genes co-expressed
with the JA biosynthesis genes (Figure 2, yellow boxes) is
depicted in Figure 5. Networks of ET biosynthesis (Figure
2, light blue hexagons) and ET signaling (Figure 2, pink
ovals) are shown in Figures 6A and 6B, respectively. Figure
7 shows the network of genes co-expressed with the genes
leading to SA biosynthesis (Figure 2, red boxes). A detailed
description of the above networks is given in the following
paragraphs.
The MAP Kinase Pathways
The response to flagellin fragment flg22 as part of the
PAMP signaling pathway is mediated via a MAPK
Figure 4 Co-expression network of the MAP kinase pathways.
Co-expression network of MAP kinases leading to defense genes (A)
and to SA defense gene repression and JA defense gene induction
(B). The genes in colored boxes in the network correspond to
similarly colored components of the signaling pathways indicated in
Figure 2. The genes in white boxes indicate co-expressed genes
with at least one edge to the kinase genes in the colored boxes.
Figure 5 Co-expression network of the JA biosynthesis
pathway. The genes in the yellow boxes in the network
correspond to the yellow-colored components of the JA
biosynthesis pathway indicated in Figure 2. The genes in white
boxes indicate co-expressed genes with at least one edge to the
pathway genes.
van Verk et al. BMC Plant Biology 2011, 11:88
/>Page 6 of 12
cascade [30,31]. This signal transduction via MAPKKK/
MEKK1?-M KK4/MKK5-MPK3/MPK6 leads to transc rip-
tional activation of downstream WRKY22 and WRKY29
genes, which results in the induction of resistance to
both bacterial and fungal pathogens (Figur e 2; [30]). Our
results show that the genes encoding the MAPK compo-
nents are highly co-expressed and form a network with a
large number of co-expressed transcription factors (Fig-
ure 4A). The known downstream target of this cascade,
WRKY22, is connected to MEKK1 and MKK4/MKK5.
Surprisingly, MPK6 was not linked to any of the genes in
the networ k, but appeared to be co-expressed with EIN3
and ETR1, both involved in the ET signaling pathway
(Figure 4A; see below). As revealed by [32], multiple dif-
ferentmodelsarepossibleofhowMPK6couldberegu-
lated directly under MEK K1. On the other hand, MPK6
has been described as the MAP kinase substrate of
MKK3 and the MKK3-MPK6 cascade is important for
the JA-dependent negative regulation of MYC2[33].
MYC2 has the opposite effect on the MKK4/MPK3
branch. Induction of ERF2 activates a variety of wound
response/insect resistance genes in JA-treated plants and
regulates JA-dependent responses. ERF2 is positively
regulated by MYC2 a nd in our analysis is connected to
MKK4 and MPK3[34,35]. Besides this connection, MKK4
is co-expressed with AOS and OPR3 (Figure 5) that are
both important genes in the biosynthesis pathway of JA,
suggesting that ERF2 might activate the MKK4/MPK3
cascade and via this route induce JA biosynthesis. With
the biosynthesis of JA, in many cases also the JAZ repres-
sor genes are positively regulated [36]. The connection
between MKK4 and JAZ5 might indicate that this branch
is under control of the JAZ5 repressor.
The flagellin fragment flg22 not only affects the regu-
lation of JA and ET pathways, but also activates the SA
pathway. Many WRKY genes are co-expressed with
MEKK 1 and MKK4. WRKY28 is rapidly induced to very
high levels upon flg22 treatment [37]. Togethe r with
WRKY28, WRKY46 is also co-regulated and they are
both found as co-expressed genes with important genes
in the SA biosynthesis pathway (Figure 7).
Both WRKY18 and WRKY53 are positive regulators of
PR-gene expression and systemic acquired resistance
(SAR). Functional WRKY18 is required for full induc-
tion of SAR and is linked to the activation of PR-1 [38].
WRKY18 enhances resistance against Pseudomonas syr-
ingae [39]. The link between WRKY53 and MEK1 ca n
be explained via MEKK1 (Figure 4B). MEKK1 is
upstream of MEK1 and interacts with an activation
domain protein that can be phosphorylated and binds to
the promoter of WRKY53 to activate gene expression
[40]. This links WRKY18 and WRKY53 to flg22 and the
initiation of SAR mediated defense within our co-
expression network.
Figure 6 Co-expression network of the ET biosy nthesis and
signaling pathways. In panel A, the genes in the blue boxes in
the network correspond to the blue-colored components of the ET
biosynthesis pathway indicated in Figure 2. In panel B, The genes in
colored boxes correspond to genes in similarly colored boxes of the
ET signal transduction pathway shown in Figure 2. The genes in the
white boxes in both panels indicate co-expressed genes having at
least one edge to the pathway genes.
Figure 7 Co-expression network of the SA biosynthesis
pathway. The genes in the red boxes in the network correspond to
the red-colored components of the SA biosynthesis pathway
indicated in Figure 2. The genes in white boxes indicate co-
expressed genes with at least one edge to the pathway genes.
van Verk et al. BMC Plant Biology 2011, 11:88
/>Page 7 of 12
The MAPK cascade (MEKK1-MEK1/MKK2-MPK4),
induced by challenge inoculation with P. syringae or
treatment with flg22, leads to phosphorylation of MAP
kinase substrate 1 (MKS1), which forms a complex
with MPK4 and WRKY33 and possibly WRKY25.
Upon phosphorylation of MKS1, WRKY33 is released
inthe nucleus to initiate positive regulation of JA-
induced defense genes and negative regulation of SA-
related defense genes. Also other WRKYs, like
WRKY11 and WRKY17, act as negative regulators of
basal resistance responses [41-44]. Almost all of the
genes encoding these WRKYs were found intercon-
nected in the co-expression network (Figure 4B).
WRKY48 is also stress and pathogen inducible and acts
as a transcription factor that represses basal defense
and PR-gene expression. When considering its location
in the co-expression network, WRKY48 could function
in a similar manner as WRKY11/17 and/or WRKY25/
33 [45].
WRKY70 and the functional homolog WRKY54 have
dual roles in SA-mediated gene expression and resis-
tance. Upon high accumulation of SA, WRKY54/70 act
as negative regulators of SA biosynthesis. Besides this
negative role, they activate other SA-regulated genes
[38,46]. The route via which WRKY54 and WRKY70
repress SA biosynthesis is unknown. Within the co-
expression network both these WRKYs link to both
MEK1 and MKK2, two important kinases in the cascade
that leads to repression of SA defense genes. It may be
that negative regulation of SA biosynthesis is brought
about by activation of this MAP kinase cascade by
WRKY54 and WRKY70.
The JA Biosynthesis Pathway
The JAZ repr essor proteins play an important role in JA
signaling. The initial JAZ repressor that is released from
MYC2 to activate transcription of target genes is J AZ3
[36,47]. MYC2, JAZ1 and JAZ3 are directly linked in the
co-expre ssion network with OPR3, encoding 12-oxophy-
todienoate reductase, an essential enzyme in JA bio-
synthesis (Figure 5). Several other genes encoding JAZ
repressors are also connected to OPR3 and to the gene
encoding JA methyl transferase (JMT), while others link
to both JMT and the gene for allene oxide synthase
(AOS). The various connections of these JAZ genes may
hint at which levels the different JAZ repressors are
operational (Figure 5).
Surprisingly, many of the WRKY transcription factors
that are involved in positive or negative regulation of
PR-genes and SAR are also connected to the JA bio-
synthesis pathway (Figure 5), like the pos itive regulatory
combinations WRKY18/53 (Figure 4A), WRKY54/70
(Figure 4B), WRKY28/46 that are possibly involved in
the regulation of SA biosynthesis (Figure 7) and
WRKY11/48 that act as negative regulators of SA
defense genes.
Several members of the MYB t ranscription factor
family were also found to be closely co-expressed with
the JA biosynthesis genes AOS, OPR3 and JMT.Mostof
the co-expressed MYB transcription factors have no
known function. Using publicly avail able online co-
expression analyses, a link was found between MYB29
and the regulation of aliphatic glucosinolate biosynthesis
[25]. Since methyl-JA is involved in regulation of gluco-
sinolate biosynthesis this could indicate that MYB29 is
co-expressed at the level of JMT or below. However, the
upstream conn ection of MYB29 with AOS suggests that
activation of the glucosinolate pathway by MYB29 is
already initiated before methyl-JA is synthesized.
The ET Biosynthesis and Signaling Pathway
ET is produced from S-adenosyl-methionine in a two-
step reaction catalyzed by the enzy mes aminocyclopro-
pane carboxylic acid (ACC)-synthase (encoded by ACS
genes) and ACC-oxidase (enc oded by ACO), respec-
tively. Genes co-expressed with the ET biosynthesis
genes are depicted in Figure 6A. We found a connection
between ACS2/6 and MEKK1/MKS1 of the MAP ki nase
pathway. MEKK1 has b een proposed to lead to phos-
phorylation of MP K6, although the mecha nism through
which this might occur has not yet been established.
Diff erent models for this regula tion have been proposed
[32]. ACS2 and ACS6 can be phosphorylated by MPK6
(Figure 2). Thi s phosphorylation stabilizes the protein,
which results in increased ET production [48]. Other
genes co-expressed with the ET biosynthesis genes
ACS4, ACS5 and ACO encode a variety of Aux/IAA and
ARF factors. In a review by Reed [49] it is proposed that
targets of Aux/IAA and ARF might include genes
encoding ACC synthase. Various other Aux/IAA and
ARF genes were found to be closely co-expressed with a
number of other regulator genes (encoding ubiquitin
ligases EOL1, ETO1) involved in ET biosynthesis, indica-
tiveofapossiblefunctionintheintegrationofETand
auxin signaling pathways.
The MAP kinases in the ET signaling pathway (Figure
6B) are connected to a limited number of other nodes.
The link between MPK3 and ERF2 was discussed above.
Mutant studies with the etr1-1 gain-of-function ET-
insensitive mutant placed MPK6 directly downstream of
ETR1 [50,51]. This is also observed within the co-
expression network. In the network EIN3 is also con-
nected to MPK6. In the MKK9-MPK3/6 cascade it was
shown that direct phosphorylation in the nucleus via
this cascade stabilizes the EIN3 protein, which may be a
key step in ET signaling (Figure 2; [52]). The involve-
ment of MKK9 at this point of the pathway has re cently
been questioned [53]. Notably, in the co-expression
van Verk et al. BMC Plant Biology 2011, 11:88
/>Page 8 of 12
network MKK9 doesn’t correlate with any genes know n
to be involved at this point of the pathway, further
undercutting the suggested involvement of MKK9 in
ET-signaling. Within the co-expression network
depicted in Figure 3E both genes for ETR1 and MPK6
(represented by the pin k and green dot almost in the
middle of the network), are in between the super cluster
with the genes encoding proteins invo lved in SA signal-
ing (red dots), Flg22-initiated MAPK kinase cascade
(green dots) and the JA biosynthesis genes (yellow dots),
and the super cluster with several genes involved in the
ET signaling pathway (pink dots). The central location
of MPK6 and ETR1 between the super clusters with the
other signaling genes might be indicative for a role of
the combination of ETR1/MPK6 in crosstalk between
these clusters.
Within the ethylene-signaling network (Figure 6B) we
found many genes co-expressed with EIN2. For almost
none of these genes a clear function has been described
in literature so far. Recently, it was found that the mod-
ulation of NPR1 dependency of SA-JA crosstalk by ET
is dependent on EIN2 [54]. Most of the genes involved
in the crosstalk have not yet been assigned to a particu-
lar function. Surprisingly, in our analysis many of the
genes that are co-expressed with EIN2 (IAA13, RAP2.12,
MYB36, MYB43, WRKY39, WRKY69) are also connected
to CPR5 in the SA biosynthesis pathway (see below). It
is tempting to assume that some of these genes are
involved in the EIN2-dependent crosstalk with SA.
The SA Biosynthesis Pathway
Heterodimerization of EDS1 and PAD4 and their
nuclear localization are important for subsequent steps
in the SA signaling pathway [55]. Recently, it was found
that EDS1 expression is repressed by the Ca
2+
/calmodu-
lin-binding transcription factor AtSR1, indicating that
SA levels are regulated by Ca
2+
[56]. We found that the
gene encoding the Ca
2+
/calmodulin-binding transcription
factor MYB2, is co-expressed with PBS3 (Figure 7; [57]).
If MYB2, like AtSR1, acts as a repressor of SA accumula-
tion, this might indicate another point of regulation. In
addition to the link to PBS3, MYB2 is also connected to
JMT in the methyl-JA synthesis pathway and to ACS2 in
the ET biosynt hesis pathway, suggestive f or a role of
MYB2 in fine-tuning SA, JA, and ET biosynthesis.
Besides the connections of WRKY54 and WRKY70 that
are already known to influence biosynthesis of SA, we
found two new WRKY genes (WRKY28 and WRKY46)to
be co-expressed with isochorismate synthase 1 (ICS1), a
key enzyme in the biosynthesis of SA. As described
above, WRKY28 is known to be rapidly induced by flg22,
while WRKY46 is rapidly induced downstream of aviru-
lence effectors [58]. This might indicate a direct role for
these WRKYs in flagellin and avirulence effector-induced
biosynthesis of SA. Another WRKY gene that we found
to be co-expressed with PBS3 is WRKY8.ThisWRKYis
described in literature as one that is evolutionary highly
related to WRKY28 [59].
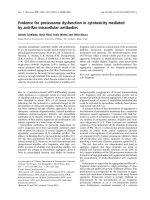
To illustrate the validity of our choice to li mit the co-
expression analysis to the set of stress-related micro-
arrays, in Figure 8 we focused on the sub network around
ICS1/PBS3. In Figure 8A, all genes that were found co-
expressed in the stress-related set within one edge at the
PCC cutoff of 0.7 are displayed. Among the co-expressed
genes are WRKY 70 and PAD4, which are proven factors
in the SA-signaling pathway [38,55]. This sub-network
degraded when only the set of development-related genes
(Figure 8B) or the set of all 1436 available micro-arrays
Figure 8 Co-expressi on subnetworks of ICS1 and PBS3. The sub-network of genes that are co-expressed within one ed ge of ICS1 and PBS3
as obtained from the data sets of stress-related Arabidopsis microarrays (A), development-related microarrays (B), and all micro-arrays (C). Nodes
from panel A are only shown in panels B and C if they have at least one edge within our outside of the ICS1 and PBS3 network.
van Verk et al. BMC Plant Biology 2011, 11:88
/>Page 9 of 12
were considered (Figure 8C). This supports the notion
that also other genes in the dataset may play roles in the
stress-related pathways investigated. Based on the results
of the co-expression sub-network around ICS1 and PBS3,
in a follow-up paper we investigated the possible role of
transcription factors WRKY28 and WRKY46 in ICS1 and
PBS3 gene expression [29].
In Figures 4, 5, 6 and 7 only co-expressed, established
transcriptional regulators are depicted. A full list of all
genes found to be closely co-expressed with the pathway
components in Figure 2 is given in Additional file 2,
Table 2.
Conclusions
Our study shows that co-expression analysis using a
selection of publicly available stress related data sets
resulted in many new, potential components of the sig-
nal transduction pathways involved in stress responses.
This could aid in the further characterization of these
pathways.
Methods
Microarray Dataset
The dataset of 1436 Affymetrix Arabidopsis 25K arrays
obtained from NASCArrays and AtGenExpress was
downloaded from ftp.arabidopsis.org. This dataset has
already been normalized using the robust multi-array
method (RMA). For tracking down the e xperimental
conditions of the different arrays we used the mapping
file provided and with assistance from the curators of
TAIR the codes were converted into matching experi-
mental conditions that can be found on the website.
Based on these experimental conditions selections were
made of stress- and development-related datasets that
were used in our experiments.
Bi-clustering, Pearson Cutoff Determination and Co-
expression Analysis
For the bi-clustering the raw RMA normalized expres-
sion values were transformed such, to obtain mean
expression values of 0 and a standard deviation of 1 for
all rows. Clust ering of the data was performed using the
following parameters: the dista nce between object s in
the data matrix was one minus the sample correlation
between points (treated as sequences of values), linkage
was set to complete (furthest distance), and the cutoff
within the dendogram for the hierarchical cluster tree
was set to 0.50. All values below this cutoff were given a
different color for both the experimental conditions and
the genes.
To determine a biologically relevant Pearson correla-
tion cutoff, the number of nodes and edges and the net-
work density were determined using the raw RMA
normalized expression values for different PCC cutoff s
ranging from 0 to 1 at 0.01 intervals per data point
using the 372 microarrays from the selected set of
stress-related micro-arrays. The total number of clusters
was determined using the MCODE algorithm within
Cytoscape for PCC cutoffs from 0.5 to 0.9 at 0.01 inter-
vals using the following settings: loops not included,
degree cutoff = 2, Haircut on, fluff off, node score cutoff
= 0.2, K-score = 2, Max depth = 100.
The co-expression network was built using the raw
RMA normalized expression values with a PCC cutoff of
0.70 for the stress dataset and was visualized using
Cytoscape using standard settings.
Additional material
Additional file 1: Table 1. Lists of the 372 microarrays and the genes
used for analysis in combination with Figure 2.
Additional file 2: Table 2. Genes encoding transcriptional regulators
closely co-expressed with signaling pathway genes.
Acknowledgements and Funding
We would like to thank the curators of The Arabidopsis Information
Resource (TAIR) for helpful suggestions for tracking the experimental
conditions of most of the micro-arrays in the dataset. The work was
performed without external funding.
Authors’ contributions
MVV designed the study, carried out the analysis, helped in data
interpretation, and made the draft of the manuscript. JFB and HL helped in
data interpretation and edited the manuscript. All authors have given final
approval for this version to be published.
Received: 22 December 2010 Accepted: 19 May 2011
Published: 19 May 2011
References
1. Agarwal PK, Jha B: Transcription factors in plants and ABA dependent
and independent abiotic stress signalling. Biologia Plantarum 2010,
54:201-212.
2. Bari R, Jones JDG: Role of plant hormones in plant defence responses.
Plant Molecular Biology 2009, 69:473-488.
3. Pieterse CMJ, Leon-Reyes A, Van der Ent S, Van Wees SCM: Networking by
small-molecules hormones in plant immunity. Nat Chem Biol 2009,
5:308-316.
4. van Verk MC, Gatz C, Linthorst HJM: Transcriptional Regulation of Plant
Defense Responses. In Adv Bot Res. Volume 51. Edited by: van Loon LC.
Elsevier; 2009:397-438.
5. Ramirez V, Coego A, Lopez A, Agorio A, Flors V, Vera P: Drought tolerance
in Arabidopsis is controlled by the OCP3 disease resistance regulator.
The Plant Journal 2009, 58:578-591.
6. Yasuda M, Ishikawa A, Jikumaru Y, Seki M, Umezawa T, Asami T, Maruyama-
Nakashita A, Kudo T, Shinozaki K, Yoshida S, Nakashita H: Antagonistic
interaction between systemic acquired resistance and the abscisic acid-
mediated abiotic stress response in Arabidopsis. The Plant Cell 2008,
20:1678-1692.
7. Czechowski T, Bari RP, Stitt M, Scheible W, Udvardi MK: Real-time RT-PCR
profiling of over 1400 Arabidopsis transcription factors: unprecedented
sensitivity reveals novel root- and shoot-specific gene. The Plant Journal
2004, 38:366-379.
8. Aoki K, Ogata Y, Shibata D: Approaches for Extracting Practical
Information from Gene Co-expression Networks in Plant Biology. Plant
Cell Physiol 2007, 48:381-390.
van Verk et al. BMC Plant Biology 2011, 11:88
/>Page 10 of 12
9. Edgar R, Domrachev M, Lash AE: Gene Expression Omnibus: NCBI gene
expression and hybridization array data repository. Nucleic Acids Res 2002,
30:207-210.
10. Brazma A, Parkinson H, Sarkans U, Shojatalab M, Vilo J,
Abeygunawardena N, Holloway E, Kapushesky M, Kemmeren P, Lara GG,
Oezcimen A, Rocca-Serra P, Sansone SA: ArrayExpress - a public repository
for microarray gene expression data at the EBI. Nucleic Acids Res 2003,
31:68-71.
11. Steinhauser D, Usadel B, Luedemann A, Thimm O, Kopka J: CSB.DB: a
comprehensive systems-biology database. Bioinformatics 2004,
20:3647-3651.
12. Zimmermann P, Hirsch-Hoffmann M, Hennig L, Gruissem W:
GENEVESTIGATOR: Arabidopsis Microarray Database and Analysis
Toolbox. Plant Physiology 2004, 136:2621-2632.
13. Zimmermann P, Hennig L, Gruissem W: Gene expression analysis and
network discovery using Genevestigator. Trends in Plant Science 2005,
10:407-409.
14. Hruz T, Laule O, Szabo G, Wessendrop F, Bleuler S, Oertle L, Widmayer P,
Gruissem W, Zimmermann P: Genevestigator V3: A reference expression
database for the meta-analysis of transcriptomes. Advances in
Bioinformatics 2008, Article ID 420747.
15. Toufighi K, Brady SM, Austin R, Ly E, Provart NJ: The Botany Array
Resource: e-Northerns, Expression Angling, and promoter analyses. The
Plant Journal 2005, 43:153-163.
16. Manfield IW, Jen CH, Pinney JW, Michalopoulos I, Bradford JR, Gilmartin PM,
Westhead DR: Arabidopsis Co-expression Tool (ACT): web server tools for
microarray-based gene expression analysis. Nucleic Acids Res 2006, 34:
W504-509.
17. Obayashi T, Kinoshita K, Nakai K, Shibaoka M, Hayashi S, Saeki M, Shibata D,
Saito K, Ohta H: ATTED-II: a database of co-expressed genes and cis
elements for identifying co-regulated gene groups in Arabidopsis.
Nucleic Acids Res 2007, 35:D863-D869.
18. Obayashi T, Hayashi S, Shibaoka M, Saeki M, Ohta H, Kinoshita K:
COXPRESdb: a database of coexpressed gene networks in mammals.
Nucleic Acids Res 2008, 36:D77-82.
19. Obayashi T, Hayashi S, Saeki M, Ohta H, Kinoshita K: ATTED-II provides
coexpressed gene networks for Arabidopsis. Nucleic Acids Res 2009, 37:
D987-991.
20. Akiyama K, Chikayama E, Yuasa H, Shimada Y, Tohge T, Shinozaki K,
Hirai MY, Sakurai T, Kikuchi J, Saito K: PRIMe: A Web site that
assembles tools fo r metabolomics and transc riptomics. In Silico Biol
2008, 8:0027.
21. Srinivasasainagendra V, Page GP, Mehta T, Coulibaly I, Loraine AE:
CressExpress: a tool for large-scale mining of expression data from
Arabidopsis. Plant Physiology 2008, 147:1004-1016.
22. Birnbaum K, Shasha DE, Wang JY, Jung JW, Lambert GM, Galbraith DW,
Benfey PN: A gene expression map of the Arabidopsis root.
Science 2003,
302:1956-1960.
23.
Elo A, Lyznik A, Gonzalez DO, Kachman SD, Mackenzie SA: Nuclear genes
that encode mitochondrial proteins for DNA and RNA metabolism are
clustered in the Arabidopsis genome. The Plant Cell 2003, 15:1619-1631.
24. Persson S, Wei H, Milne J, Page GP, Somerville CR: Identification of genes
required for cellulose synthesis by regression analysis of public
microarray data sets. Proceedings of the National Academy of Sciences of
the United States of America 2005, 102:8633-8638.
25. Hirai MY, Sugiyama K, Sawada Y, Tohge T, Obayashi T, Suzuki A, Araki R,
Sakurai N, Suzuki H, Aoki K, Goda H, Nishizawa OI, Shibate D, Saito K:
Omics-based identification of Arabidopsis Myb transcription factors
regulating aliphatic glucosinolate biosynthesis. Proceedings of the National
Academy of Sciences of the United States of America 2007, 104:6478-6483.
26. Ma S, Gong Q, Bohnert HJ: An Arabidopsis gene network based on the
graphical Gaussian model. Genome Res 2007, 17:1614-1625.
27. Borate BR, Chesler EJ, Langston MA, Saxton AM, Voy BH: Comparison of
threshold selection methods for microarray gene co-expression
matrices. BMC Res Notes 2009, 2:240.
28. Usadel B, Obayashi T, Mutwil M, Giorgi FM, Bassel G, Tanimoto M, Chow A,
Steinhauser D, Persson S, Provart NJ: Co-expression tools for plant biology:
opportunities for hypothesis generation and caveats. Plant, Cell and
Environment 2009, 32:1633-1651.
29. van Verk MC, Bol JF, Linthorst HJM: WRKY Transcription Factors Involved
in Activation of SA Biosynthesis Genes. BMC Plant Biol 2011, 11:89.
30. Asai T, Tena G, Plotnikova J, Willmann MR, Chiu WL, Gomez-Gomez L,
Boller T, Ausubel FM, Sheen J: MAP kinase signalling cascade in
Arabidopsis innate immunity. Nature 2002, 415:977-983.
31. Suarez-Rodriguez MC, Adams-Phillips L, Liu Y, Wang H, Su SH, Jester PJ,
Zhang S, Bent AF, Krysan PJ: MEKK1 is required for flg22-induced MPK4
activation in Arabidopsis plants. Plant Physiology 2007, 143:661-669.
32. Mészáros T, Helfer A, Bögre L: The more we know, the less we
understand? Complexity of MAP kinase signaling. Plant Signal Behav
2007, 2:30-32.
33. Takahashia F, Yoshidab R, Ichimurac K, Mizoguchib T, Seoe S, Yonezawac M,
Maruyamaf K, Yamaguchi-Shinozakif K, Shinozakia K: The Mitogen-
Activated Protein Kinase Cascade MKK3-MPK6 Is an Important Part of
the Jasmonate Signal Transduction Pathway in Arabidopsis. The Plant Cell
2007, 19:805-818.
34. McGrath KC, Dombrecht B, Manners JM, Schenk PM, Edgar CI, Maclean DJ,
Scheible WR, Udvardi MK, Kazan K: Repressor- and activator-type ethylene
response factors functioning in jasmonate signaling and disease
resistance identified via a genome-wide screen of Arabidopsis
transcription factor gene expression.
Plant Physiology 2005, 139:949-959.
35.
Dombrecht B, Xue GP, Sprague SJ, Kirkegaard JA, Ross JJ, Reid JB, Fitt GP,
Sewelam N, Schenk PM, Manners JM, Kazana K: MYC2 differentially
modulates diverse jasmonate-dependent functions in Arabidopsis. The
Plant Cell 2007, 19:2225-2245.
36. Chini A, Fonseca S, Fernández G, Adie B, Chico JM, Lorenzo O, García-
Casado G, López-Vidriero I, Lozano FM, Ponce MR, Micol JL, Solano R: The
JAZ family of repressors is the missing link in jasmonate signalling.
Nature 2007, 448:666-671.
37. Navarro L, Zipfel C, Rowland O, Keller I, Robatzek S, Boller T, Jones JDG: The
transcriptional innate immune response to flg22. Interplay and overlap
with Avr gene-dependent defense responses and bacterial
pathogenesis. Plant Physiology 2004, 135:1113-1128.
38. Wang D, Amornsiripanitch N, Dong X: A genomic approach to identify
regulatory nodes in the transcriptional network of systemic acquired
resistance in plants. PLoS Pathogens 2006, 2:e123.
39. Xu X, Chen C, Fan B, Chen Z: Physical and functional interactions
between pathogen-induced Arabidopsis WRKY18, WRKY40, and WRKY60
transcription factors. The Plant Cell 2006, 18:1310-1326.
40. Miao Y, Laun TM, Smykowski A, Zentgraf U: Arabidopsis MEKK1 can take a
short cut: it can directly interact with senescence-related WRKY53
transcription factor on the protein level and can bind to its promoter.
Plant Molecular Biology 2007, 65:63-76.
41. Andreasson E, Jenkins T, Brodersen P, Thorgrimsen S, Petersen NHT, Zhu S,
Qiu JL, Micheelsen P, Rocher A, Petersen M, Newman MA, Nielsen HB,
Hirt H, Somssich I, Mattsson O, Mundy J: The MAP kinase substrate MKS1
is a regulator of plant defense responses. The EMBO Journal 2005,
24:2579-2589.
42. Brodersen P, Petersen M, Nielsen HB, Zhu S, Newman MA, Shokat KM,
Rietz S, Parker J, Mundy J: Arabidopsis MAP kinase 4 regulates salicylic
acid- and jasmonic acid/ethylene-dependent responses via EDS1 and
PAD4. The Plant Journal 2006, 47:532-546.
43. Journot-Catalino N, Somssich IE, Roby D, Kroj T: The transcription factors
WRKY11 and WRKY17 act as negative regulators of basal resistance in
Arabidopsis thaliana. The Plant Cell 2006, 18:3289-3302.
44. Qiu JL, Zhou L, Yun BW, Nielsen HB, Fiil BK, Petersen K, MacKinlay J,
Loake GJ, Mundy J, Morris PC: Arabidopsis mitogen-activated protein
kinase kinases MKK1 and MKK2 have overlapping functions in defense
signaling mediated by MEKK1, MPK4, and MKS1. Plant Physiology 2008,
148:212-222.
45. Xing DH, Laia ZB, Zhenga ZY, Vinoda KM, Fana BF, Chen ZX: Stress- and
Pathogen-Induced Arabidopsis WRKY48 is a Transcriptional Activator
that Represses Plant Basal Defense. Mol Plant 2008, 1:459-470.
46. Kalde M, Barth M, Somssich IE, Lippok B: Members of the Arabidopsis
WRKY group III transcription factors are part of different plant defense
signaling pathways. Molecular Plant-Microbe Interactions 2003, 16:295-305.
47. Thines B, Katsir L, Melotto M, Niu Y, Mandaokar A, Liu G, Nomura K, He SY,
Howe GA, Browse J: JAZ
repressor proteins are targets of the SCF
COI1
complex during jasmonate signalling. Nature 2007, 448:661-665.
48. Liu Y, Zhang S: Phosphorylation of 1-aminocyclopropane-1-carboxylic
acid synthase by MPK6, a stress-responsive mitogen-activated protein
kinase, induces ethylene biosynthesis in Arabidopsis. The Plant Cell 2004,
16:3386-3399.
van Verk et al. BMC Plant Biology 2011, 11:88
/>Page 11 of 12
49. Reed JW: Roles and activities of Aux/IAA proteins in Arabidopsis. Trends
in Plant Science 2001, 6:420-425.
50. Chang C: Ethylene signaling: the MAPK module has finally landed. Trends
in Plant Science 2003, 8:365-368.
51. Ouaked F, Rozhon W, Lecourieux D, Hirt H: A MAPK pathway mediates
ethylene signaling in plants. The EMBO Journal 2003, 22:1282-1288.
52. Yoo SD, Cho YH, Tena G, Xiong Y, Sheen J: Dual control of nuclear EIN3
by bifurcate MAPK cascades in C
2
H
4
signalling. Nature 2008, 451:789-795.
53. An F, Zhao Q, Ji Y, Li W, Jiang Z, Yu X, Zhang X, Zhang C, Han Y, He W,
Liu Y, Zhang S, Ecker JR, Guo H: Ethylene-Induced stabilization of
ETHYLENE INSENSITIVE3 and EIN3-LIKE1 is mediated by proteasomal
degradation of EIN3 binding F-Box 1 and 2 that requires EIN2 in
Arabidopsis. The Plant Cell 2010, 22:2384-2401.
54. Leon-Reyes A, Spoel SH, De Lange ES, Abe H, Kobayashi M, Tsuda S,
Millenaar FF, Welschen RAM, Ritsema T, Pieterse CMJ: Ethylene modulates
the role of NONEXPRESSOR OF PATHOGENESIS-RELATED GENES1 in
cross talk between salicylate and jasmonate signaling. Plant Physiology
2009, 149:1797-1809.
55. Feys BJ, Moisan LJ, Newman MA, Parker JE: Direct interaction between the
Arabidopsis disease resistance signaling proteins, EDS1 and PAD4. The
EMBO Journal 2001, 20:5400-5411.
56. Du L, Ali GS, Simons KA, Hou J, Yang T, Reddy ASN, Poovaiah BW: Ca2
+
/calmodulin regulates salicylic-acid-mediated plant immunity. Nature
2009, 457:1154-1158.
57. Yoo JH, Park CY, Kim JC, Heo WD, Cheong MS, Park HC, Kim MC, Moon BC,
Choi MS, Kang YH, Lee JH, Kim HS, Lee SM, Yoon HW, Lim CO, Yun DJ,
Lee SY, Chung WS, Cho MJ: Direct Interaction of a Divergent CaM
Isoform and the Transcription Factor, MYB2, Enhances Salt Tolerance in
Arabidopsis. Journal of Biological Chemistry 2005, 280:3697-3706.
58. He P, Shan L, Lin NC, Martin GB, Kemmerling B, Nürnberger T, Sheen J:
Specific bacterial suppressors of PAMP signaling upstream of MAPKKK in
Arabidopsis innate immunity. Cell 2006, 125:563-575.
59. Yamasaki K, Kigawa T, Inoue M, Tateno M, Yamasaki T, Yabuki T, Aoki M,
Seki E, Matsuda T, Tomo Y, Hayami N, Terada T, Shirouzu M, Tanaka A,
Seki M, Shinozaki K, Yokoyama S: Solution structure of an Arabidopsis
WRKY DNA binding domain. The Plant Cell 2005, 17:944-956.
doi:10.1186/1471-2229-11-88
Cite this article as: van Verk et al.: Prospecting for Genes involved in
transcriptional regulation of plant defenses, a bioinformatics approach.
BMC Plant Biology 2011 11:88.
Submit your next manuscript to BioMed Central
and take full advantage of:
• Convenient online submission
• Thorough peer review
• No space constraints or color figure charges
• Immediate publication on acceptance
• Inclusion in PubMed, CAS, Scopus and Google Scholar
• Research which is freely available for redistribution
Submit your manuscript at
www.biomedcentral.com/submit
van Verk et al. BMC Plant Biology 2011, 11:88
/>Page 12 of 12