báo cáo khoa học: "Over-expressing the C3 photosynthesis cycle enzyme Sedoheptulose-1-7 Bisphosphatase improves photosynthetic carbon gain and yield under fully open air CO2 fumigation (FACE)" docx
Bạn đang xem bản rút gọn của tài liệu. Xem và tải ngay bản đầy đủ của tài liệu tại đây (1.52 MB, 12 trang )
RESEARCH ARTICLE Open Access
Over-expressing the C
3
photosynthesis cycle
enzyme Sedoheptulose-1-7 Bisphosphatase
improves photosynthetic carbon gain and yield
under fully open air CO
2
fumigation (FACE)
David M Rosenthal
1
, Anna M Locke
2
, Mahdi Khozaei
3
, Christine A Raines
4
, Stephen P Long
5
and Donald R Ort
6*
Abstract
Background: Biochemical models predict that photosynthesis in C
3
plants is most frequently limited by the slower
of two processes, the maximum capacity of the enzyme Rubisco to carboxylate RuBP (V
c,max
), or the regeneration
of RuBP via electron transport (J). At current atmospheric [CO
2
] levels Rubisco is not saturated; consequently,
elevating [CO
2
] increases the velocity of carboxylation and inhibits the competing oxygenation reaction which is
also catalyzed by Rubisco. In the future, leaf photosynthesis (A) should be increasingly limited by RuBP
regeneration, as [CO
2
] is predicted to exceed 550 ppm by 2050. The C
3
cycle enzyme sedoheptulose-1,7
bisphosphatase (SBPase, EC 3.1.3.17) has been shown to exert strong metabolic control over RuBP regeneration at
light saturation.
Results: We tested the hypothesis that tobacco transformed to overexpressing SBPase will exhibit greater
stimulation of A than wild type (WT) tobacco when grown under field conditions at elevated [CO
2
] (585 ppm)
under fully open air fumigation. Growth under elevated [CO
2
] stimulated instantaneous A and the diurnal
photosynthetic integral (A’) more in transformants than WT. There was evidence of photosynthetic acclimation to
elevated [CO
2
] via downregulation of V
c,max
in both WT and transformants. Nevertheless, greater carbon
assimilation and electron transport rates (J and J
max
) for transformants led to greater yield increases than WT at
elevated [CO
2
] compared to ambient grown plants.
Conclusion: These results provide proof of concept that increasing content and activity of a single photosynthesis
enzyme can enhance carbon assimi lation and yield of C
3
crops grown at [CO
2
] expected by the middle of the 21st
century.
Keywords: climate change, photosynthetic carbon reduction cycle, C3 plants, RuBP regeneration, electron trans-
port, improving photosynthesis
Background
Biochemical models of C
3
photosynthesis (A)predict
that A is limited by the slowest of three processes: the
maximum carboxylation capacity of the enzyme Rubisco
(V
c,max
), the regeneration of Ribulose-5-phosphate
(RuBP) via whole chain electron transport (J or J
max
), or
the inorganic phosphate release from the utilization of
triose phosphates (TPU or Pi limited) [1,2]. At current
atmospheric [CO
2
], and under non stressed conditions,
light saturated A operates at the transit ion between
Rubisco and RuBP regeneration limitation. Globally,
[CO
2
] is expected to increase from current levels of 390
ppm [3] to over 550 ppm by the middle of this century
[4,5]. Elevating [CO
2
] stimulates C
3
photosynthesis by
increasing the substrate for carboxylation, CO
2
,andby
reducing photorespiration [6,7]. Therefore, as atmo-
spheric carbon dioxide concentration increases, the
* Correspondence:
6
Global Change and Photosynthesis Research Unit, United States
Department of Agriculture, Institute for Genomic Biology, 1206 West Gregory
Drive, Urbana, IL, 61801, USA; Department of Plant Biology and Crop
Sciences, University of Illinois, Urbana, IL, 61801, USA
Full list of author information is available at the end of the article
Rosenthal et al. BMC Plant Biology 2011, 11:123
/>© 2011 Rosenthal et al; licensee BioMed Central Ltd. This is an Open Access article distributed under the t erms of the Creative
Commons Attribution License (http://creativ ecommon s.org/licenses/by/2.0) , which permits unrestricted use, distribution, and
reproduction in any medium, provided the original work is properly cited.
control of photosynthesis will shift away from Rubisco
limitation toward RuBP regeneration limitation.
Although photosynthetic stimulation at 550 ppm
[CO
2
] could in theory increase production by 34%, the
observed increase in field C
3
crops is only 15% [7,8].
Additional future increases in yield p otential of the
world’s major crops through an increase in the propor-
tion of biomass allocated to grain or an increase in the
efficiency of light capture will be small, as conventional
breeding programs are reaching the theoretical maxi-
mum with diminishing returns [9-11]. In contrast,
model simulations demo nstrate that increasing photo-
synthetic efficiency under current [CO
2
] by optim izing
the biochemistry of photosynthesis could increase the
energy conversion efficiency of a given crop in less time
than conventional breeding programs [10,12]. At current
levels of crop productivity, global food requirements
may outpace current crop production by the middle of
this century [11,13,14]. Taken together, these observa-
tions suggest that direct improvements in photosyn-
thetic efficiency will be needed if we are to meet global
food needs in the future.
A common acclimation response of plants grown at
elevated [CO
2
] is to allocate fewer resources to Rubisco,
thereby downregulating maximum carboxylation capa-
city (V
cmax
). This so called photosynthetic acclimation
makes more resources available for other metabolic pro-
cesses [6,15]. The implication is that plants could reallo-
cate resources in the photosynthetic carbon reduction
(PCR) cycle to increase the efficiency of N use i n ele-
vated [CO
2
] [6,7]. In practice, however, plants’ photo-
synthetic resources are not optimally allocated for
current [CO
2
] nor is their acclimation response optimal
in elevated [CO
2]
[12]. Theoretically, and by reference to
a biochemical model of photosy nthesis [i.e., [1]], a plant
with a 15% decrease in Rubisco content and 15%
increase in RuBP regeneration capacity could translate
to a 40% increase in A and photosynthe tic efficiency of
nitrogenuseatelevated[CO
2
] [Figure 1 in [7]]. It fol-
lows that plants engineered with an increased capacity
for RuBP regeneration would have a greater increase in
productivity in elevated [CO
2
]whencomparedtowild
type plants [16-18].
While 11 e nzymes are involved in the PCR cycle,
modeling and metabolic control analyses have consis-
tently demonstrated that four enzymes are expected to
exert the greatest control of flux in the cycle: ribulose
bisphosphate carboxylase-oxygenase (Rubisco), sedo-
heptulose-1,7-bisphosphatase (SBPase), aldolase and
transketolase [19-21]. Two enzymes, Rubisco and
SBPase, are predicted to have the greatest control over
carbon assimilation [21,22]. Rubisco is well known to
be highly abundant, containing 25% of leaf nitrogen
(N) [23] a nd may in some cases account for up to half
of leaf N [24]. All attempts to improve photosynthesis
by manipulating Rubisco expression, activity, or speci-
ficity have yielded poor results, in part because of
inherent tradeoffs between activity and specifi city of
the enzyme and limited capacity to add more of this
highly abundant protein [25-27]. An additional hurdle
to engineering “ bette r” Rubsico is that the functional
enzyme requires the coordinated assembly of eight
plastid encoded and eight nuclear encoded subunits to
form the large (rbcL) and small (rbcS) units of the
hexadecameric enzyme[28,29]. With the exception of
Rubisco, the other enzymes exerting the greatest con-
trol on photosynthesis all function in the RuBP regen-
eration portion of the PCR cycle. Thus, near term
future improvements in photosynthetic biochemistry in
C
3
plantsaremorelikelytobeachievedbyimproving
content or activity of enzymes other than Rubisco [e.g.,
[18,21,30,31]].
Sedoheptulose-1,7-bisphosphatase (SBPase) is positioned
at the branch point between regenerative (RuBP regenera-
tion) and assimilatory (starch and sucrose biosynthesis)
portions of the PCR cycle. It functions to catalyze the irre-
versible dephosphorylation of sedoheptulose1,7-bispho-
sphate (SBP) to sedoheptulose-7-phosphate (S7P).
Transketolase then catalyzes the transfer for a two carbon
ketol group from S7P to glyceraldehyde-3-phoshpate
(G3P) to yield xylulose-5-phosphate (X5P) or ribose-5-
phosphate (R5P) [32]. SBPase is therefore critical for main-
taining t he balance between the carbon needed for RuB P
regeneration and tha t leaving th e cycle for biosynth esis
[20].
Previous experiments have demonstrated that tobacco
transformants overexpressing SBPase accumulated more
biomass than WT in controlled environment chambers
at ambient C O
2
[16]. Smaller increases in biomass were
reported for mature SBPase overexpressing plants grown
in greenhouse conditions [16]. Additionally, overexpres-
sion of SBPase in rice did not increase biomass relative
to WT for plants grown at ambient CO
2
levels in two
controlled environments [33,34]. The variance in the
realized benefit of SBPase overe xpression coupled with
the fact that RuBP regeneration is highly sensitive to
environmental conditions underscores the need to test
the response of plants with this single gene manipula-
tion in agronomically relevant conditions [30]. More-
over, models predict that as atmospheric [CO
2
]
increases so will the benefit of increasing RuBP regen-
eration capacity in plants [1,21,35]. Therefore, we com-
pared WT and SBPase overexpressing plants under field
conditions at ambient and elevated (ca. 585 ppm) [CO
2
],
and we tested the prediction that transformants would
exhibit greater stimulation of photosynthesis and yield
than WT plants when grown under fully open air CO
2
fumigation.
Rosenthal et al. BMC Plant Biology 2011, 11:123
/>Page 2 of 12
Methods
Plant Material
Wild type tobacco (Nicotiana tabacum L. cv. Samsun)
and sense tobacco plants (T
5
generation Nicotiana taba-
cum L. cv. Samsun) overexpressing a full length Arabi-
dopsis thaliana SBPase cDNA, driven by CaMV 35S
promoter and the nopaline synthase termination
sequence [16], were germinated in Petri dishes and
transferred to soil when true leaves emerged. Sense
plants (hereafter referred to as ‘transformants’) were ger-
minated on hygromycin (30 ug/ml) medium. One indivi-
dual from each of two transgenic lines overexpressing
SBPase with varying SBPas e levels and several randomly
selected wild type (WT) individuals were selected for
the experiments. Individuals were subsequentl y cl onally
propagated by rooting cuttings in peat pots on misting
benches and then planted directly in the field at Soy-
FACE on July 7 2009.
SoyFACE site
The SoyFACE facility is located in the Experimental
Research Station of the University of Illinois a t Urbana-
Champaign [36]. Soybean (Glycine max)isgrownin
eight plots (rings 18 meters in diameter) l ocated within
a typically managed soybean field of ca. 40 hectares (ha).
Four rings are fumigated with pure [CO
2
] and four rings
are non-fumigated controls. Six cutting s of each SBPase
genotype (11 and 30) and six of WT were planted in
subplots within each ring.
Ambient atmospheric [CO
2
]atthebeginningofthe
2009 field season was ca. 385 ppm and the target
[CO
2
] for elevated rings in 2009 was 585 ppm [CO
2
].
In the fumigated rings, 89% of [CO
2
] values recorded
every ten minutes from June 19 to September 24,
2009, were within 10% of the target value of 585 ppm.
The mean daily [CO
2
] in elevated rings at Soyface dur-
ing that time was 586.6 ± 19.4 (sd) ppm. Elevated
rings were fumigated using a modification of the
method of Miglietta et al. [37].
Leaf protein and western blotting
Prior to planting, leaf discs were collected from cuttings
and immediately frozen in liquid nitrogen to confirm
that sense plants had greater SBPase content than WT.
Protein quantifications and western blots were per-
formed following [19]. Sample lanes were loaded on an
equal protein basis, separated using 10% (w/v) SDS-
PAGE, transferred to polyvinylidene difluoride mem-
brane, and probed using antibodies raised against
SBPase and transketolase. Antibody target proteins were
detected using horseradish peroxidase conjug ated to the
secondary antibody and ECL chemiluminescence detec-
tion reagent (Amersham, Bucks, UK). Western blots
were quantifi ed by densiometry using the molec ular
imaging Gel Doc XR system (Bio-Rad, Hercules, CA,
USA) and imaging software.
In situ measurements of gas exchange and
photosynthetic parameters
The diurnal course of photosynthesis at the SoyFACE
site was measured on two young fully expand leaves
from each genotype at ambient conditions at both nor-
mal (385 ppm) [CO
2
] and elevated (585 ppm) [CO
2
]at
five time points on two dates in August, 2009. To
ensure that each plant was measured in similar environ-
mental conditions, the LEDs of the controlled environ-
ment cuvettes of the gas exchange system (LI-6400, LI-
COR, Lincoln, Nebraska) were set to deliver the same
ambient light PPFD. Temperature and relative humidity
were similarly set to ambient conditions and kept con-
stant for the duration of each measurement period in
the diurnal course. To estimate the total daily carbon
gain (A’ ), photosynthesis was assumed to increase line-
arly from 0 μmol CO
2
m
-2
s
-1
at dawn (sunrise) to the
first measured value and decrease linearly from the last
measured values to 0 μmol CO
2
m
-2
s
-1
at dusk (sunset).
Sunrise and sunset data were determined using the US
Naval Observatory website: />docs/RS_OneYear.php. Dew on the leaves prevented us
from meas uring photosynthesis until about 10:00 h. We
estimated A’ for each block by integration using the tra-
pezoidal rule a nd then performed analyses on the inte-
grals [38].
In vivo values of three photosynthetic parameters:
maximum carboxylation capacity (V
c,max
), maximum lin-
ear electron transport through photosystem II (J
max
) and
respiration in the light (R
d
) were determined by measur-
ing the response of A to intercellular [CO
2
](Ci)on
August 1 and August 15 2009. A vs. Ci curves were
measured in situ on one young fully expanded leaf of
each genotype in all blocks of each treatment (n = 4)
with an open gas exchange system (LI-6400, LI-COR,
Lincoln, Nebraska). Initially, plants were allowed to
reach steady state photosynthesis at their growth [CO
2
]
(i.e., 385 ppm or 585 ppm [CO
2
]) at a saturating light
level of 1500 μmol m
-2
s
-1
. Mean leaf to air vapor pres-
sure deficit (VpdL) was 1.3 ± 0.26 (s.d.), and mean leaf
temperature was 26 ± 1°C (s.d.). Once steady state was
reached, photosynthetic [CO
2
]uptake rate (A) and chlor-
ophyll fluorescence parameters were recorded at the
growth [CO
2
]; then [CO
2
] was decreased in 4 or 5 uni-
form steps to 50 ppm, returned to growth [CO
2
], and
then increased in 4 or 5 uniform steps to 1500 ppm
[CO
2
]. A minimum of 11 data points were collected for
each plant following the methods outlined by Long and
Bernacchi [39]. Curves were measured in the morning
to avoid confounding treatment and genotype effects
with transient decreases in water potential, decreases in
Rosenthal et al. BMC Plant Biology 2011, 11:123
/>Page 3 of 12
chloroplast inorganic phosphate concentration or
decreases in maximum photosystem II (PSII) efficiency
(Fv’/Fm’).
Electron transport rate (ETR), the actual fl ux of
photons driving PSII, and Fv’/Fm’ were calculated using
fluorescence parameters, Fs, Fm’,Fo’,[40,41].Fluores-
cence parameters were estimated using a Licor 6400
integrated gas exchange system equipped with a fluores-
cence and ligh t source accessory (LI-6400, LI-COR, Lin-
coln, Nebraska). Fs is the steady state light adapted
fluorescence, Fm’ is the maximal fluorescence of a light
adapted leaf following a saturating light pulse, and Fo’ is
the minimal fluorescence of a light adapted leaf that is
darkened.
ETR =
Fm
− Fs
Fm
fIα
leaf
Where f, is the fraction of photons absorbed by PSII,
assumed be 0.5 for C
3
plants; I is the incident photon
flux density (μmol m
-2
s
-1
); and a is leaf absorptance
which was constant (0.87).
A vs. Ci curves were fitted using a biochem ical model
of photosynthesis [1] including the temperature
response functions determined by Bernacchi et al.
[42,43] and were solved for the parameters V
c,max
,J
max
and R
d
. The ki netic constants for Rubisco, Ko, Kc and
Γ* in tobacco are taken from [43]. Data below the
inflection point of the curve were used to solve for V
c,
max
and R
d
using the equation for Rubisco limited
photosynthesis [1] and following the method of [39].
Data above the inflection point of the A vs. Ci curve
were similarly used to solve for J
max
using the equation
for RuBP limited photosynthesis [1].
Leaf traits and final biomass
Leaf disks (ca. 1.9 cm
2
) were collected fr om plants on
August 15 during the midday gas exchange measurements.
Leaf disks were sealed in pre-cooled vials, placed in coolers
and disk fresh weights were determined the same after-
noon. Leaf disks were dried at 60°C for 48 hours and then
re-weighed. Dry and wet weights were used to determine
specific leaf area (SLA) and specific leaf weight (SLW).
These same disks were then ground to a fine powder and
used to determine leaf carbo n (C) and nitrogen (N) con-
tent by total c ombustion (Costech 4010, Valencia, CA,
USA).
Statistical analyses were performed using SAS (Ver-
sion 9.1, SAS institute, Cary, NC) and Jump (Version
4, SAS I nstitute, Cary NC). Tra it and parameter means
of SBPase transformant lines were statistically indisti n-
guishable so the lines were pooled for subsequent
ANOVAs. Simple effect tests as implemented in SAS
(LSMEANS/SLICE) were used to determine if there
were significant differences 1) between ty pes within
treatments (i.e., WT ambient vs. SBPase ambient) or 2)
between treatments within types (i.e., SBPase ambient
vs. SBPase elevated). The diurnals at SoyFACE were
analyzed as a re peated measures mixed model analysis
of variance (PROC MIXED,SAS). As above, SBPase
lines were statistically indistinguishable during the
time course and were pooled in ANOVAS. Type
(SBPase or WT), CO
2
concentration [CO
2
] (ambient or
elevated), and time of day (time) were fixed factors.
Each block contained one ambient and one elevated
CO
2
plot and was considered a random factor. As
there were only 4 blocks, significant probability was set
at p < 0.1 a priori to reduce the possibility of type II
errors [44,45].
Results
Protein Quantification
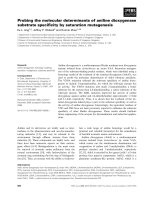
SBPase content was 150% (± 4.5) greater in transfor-
mants and more uniform relative t o WT plants (Figure
1a and 1b). SBPase overexpressing lines did not differ
from each other in t erms of the SBPase protein content
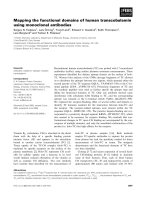
Figure 1 Western blot and protein quantification for WT and T5 SBPase transformants. Blots were probed using antibodies raised against
SBPase and transketolase. Proteins were detected using horseradish peroxidase conjugated to the secondary antibody. Gels were loaded on an
equal protein basis. a) Upper blot is SBPase and the lower is Transketolase (TK) as a loading control. Each lane is a separate individual. b)
Quantification for SBPase and TK is based on n = 6 transformants vs. n = 5 WT in ambient CO
2
.
Rosenthal et al. BMC Plant Biology 2011, 11:123
/>Page 4 of 12
(Figure 1a). Transketolase content was similar in WT
and transformants (Figure 1b).
Diurnal course of gas exchange and electron transport
rate
Diurnal trends of photosynthesis and fluorescence para-
meters were measured at their respective growth [CO
2
]
(i.e. 380 or 585 ppm) on July 31 and August 15, 2009
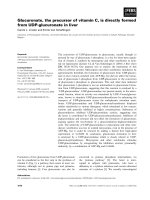
(Table 1). On July 31, photosynthetic rate (A) was signif-
icantly higher in transformants , due to significant differ-
ences around midday at elevated (585 ppm) [CO
2
]
(Figure 2a and 2b). On average, electron transport rate
(ETR) (Figure 2c and 2d) was significantly higher for
transformants at elevated [CO
2
](simpleeffecttest;F
1,12
= 8.43 p < 0.05). Differences in ETR between transfor-
mants and WT were driven by significantly lower values
for WT plants at midday in elevated [CO
2
] on July 31.
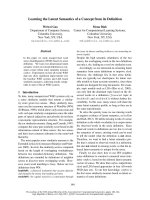
On August 14, A was significantly greater at elevated
CO
2
for both WT and transformants (Figure 3a and 3b,
Table 1), however, there were no detectable differences
in photosynthesis between WT and transformants. ETR
was similar for transformants and WT plants in ambient
and elevated CO
2
on August 14 (Figure 3c and 3d).
On July 31, elevating [CO
2
] increased A’ for WT and
transformants (F
1,12
= 15.93 p < 0.01). Transformants
had significantly greater A’ than WT in elevated [CO
2
]
(F
1,12
= 6.89 p = 0.01), but in ambient [CO
2
]theywere
not significantly different (compare Figure 2e and 2f).
On July 31, A’ increased 14% for transformants but
only 8% for WT. In contrast, on August 15, elevating
[CO
2
]increasedA’ by 6% for transformants but by
11% for WT (F1,12 = 6.79 p < 0.05). T here were no
detectable differences in A’ between transformants and
WT in ambient or elevated [CO
2
] on August 15 (Fig-
ure3eand3f).
Photosynthetic biochemical parameters
A vs. Ci curves were measured in the field the morning
following each diurnal (i.e. August 1 and August 15)
under similar meteorological conditions as the diurnals.
On August 1
st
V
c,max
tended to be lower in elevated
[CO
2
] (130.02 ± 5.9) than in ambient [CO
2
] (137.13 ±
5,7)butthetrendwasnotsignificant(Table2,Figure
4a). There was a type by [CO
2
] interaction for the
response of J
max
(Table 2). Further analysis revealed that
growth at elevated [CO
2
] significantly increased J
max
of
transformants but not WT (F1,1 6 = 8.24 p < 0.5)(Figure
4c) on August 1. Consequently, the ratio of V
c,max
to J
max
(V/J) was similar between WT and transformants at
ambient [CO
2
]. Elevating [CO
2
] significantly reduced V/J
in transformants (F
1,14
= 15.56 p < 0.01) but not in WT
plants on August 1 (Figure 4e). Growth at elevated [CO
2
]
significantly increased respiration in the light (R
d
,Table
2) and transformants had significantly higher R
d
than
WT in both ambient (F
1,14
7.78 p < 0.05) and elevated
[CO
2
](F
1,14
16.03 p < 0.01) (Figure 4g) on August 1.
On August 15, both V
c,max
and J
max
were significantly
lower for plants grown under elevated than ambient
[CO
2
](Table2;Figure4band4d).Transformantshad
significantly greater J
max
than WT at ambient [CO
2
]but
notinelevated[CO
2
](F
1,20
=3.87p=0.06).Elevating
[CO
2
] significantly decreased V/J in transformants and
WT (Table 2 Figure 4f). Elevating [CO
2
] significantly
increased R
d
for WT and transformants (Figure 4h).
Leaf traits and final biomass
Specific leaf area (SLA) was significantly lower at ele-
vated [CO
2
] compared to ambient, and transformants
had significantly lower SLA than WT plants (Table 3,
Figure 5a). Further analysis revealedthattransformant
SLA was lower than WT SLA in elevated [CO
2
](F
1,15
=
8.75 p < 0.01). Elevating [CO
2
] significantly decreased
leaf nitrogen content (%N); conseq uen tly, the carbon to
nitrogen ratio (C:N) of leaves increased significantly in
elevated [CO
2
] (Table 3, Figure 5b and 5c). Transfor-
mant C:N increased more than WT (F
1,15
=9.46p=
0.01). Above ground biomass (= yield in kg/Ha) was
great er for plants grown in elevated [CO
2
] and transfor-
mant biomass was greater than WT plants (Table 3).
Biomass increased more for transformants than WT fol-
lowing growth in elevated [CO
2
] (22% vs. 13%) (Figure
5d; F
1,15
= 6.37 p < 0.05).
Table 1 Repeated measures analysis of variance of diurnal
variation of photosynthesis (A) and linear electron flux
through photosystem II (ETR), for the main effects of
plant type (tranformants and WT), CO
2
concentration
(385 ppm, 585 ppm), and time of day (time)
31-Jul Photo ETR
df F PdfFP
type 1, 10.4 10.29 0.009 1, 9.11 9.16 0.014
CO
2
1, 10.4 28.93 0.0003 1, 9.11 2.04 0.187
type*CO
2
1, 10.4 1.99 0.188 1, 9.11 1.99 0.191
time 4, 73.7 21.83 <.0001 4, 79.9 16.04 <.0001
type*time 4, 73.7 0.41 0.804 4, 79.9 0.35 0.846
CO
2
*time 4, 73.7 5.75 0.000 4, 79.9 1.58 0.189
type*CO
2
*time 4, 73.7 0.65 0.627 4, 79.9 0.71 0.590
14-Aug Photo ETR
df F PdfFP
type 1, 12.4 0.98 0.342 1, 10.9 1.54 0.240
CO
2
1, 12.4 6.58 0.024 1, 10.9 2.66 0.131
type*CO
2
1, 12.4 0.44 0.521 1, 10.9 0 0.971
time 4, 104 29.48 <.0001 4, 102 135.52 <.0001
type*time 4, 104 0.92 0.453 4, 102 1.16 0.333
CO
2
*time 4, 104 2.73 0.033 4, 102 1.64 0.169
type*CO
2
*time 4, 104 0.4 0.806 4, 102 0.45 0.775
Diurnal measurements were collected on July 31 and August 14, 2009.
Rosenthal et al. BMC Plant Biology 2011, 11:123
/>Page 5 of 12
Discussion
The goal of our experiments was to test the hypothesis
that tobacco plants transformed to over express the
PCR cycle enzyme SBPase would exhibit greater stimu-
lation of carbon assimilation than WT plants when
grown at elevated [CO
2
] under field conditions [e.g.,
[17,30,31]].
Transformant biomass increases more than WT at
elevated [CO
2
]
When grown under fully open air CO
2
fumigation,
SBPase overexpressing pl ants displayed up to 14%
greater light saturated photosynthetic rates (A)andup
to 21% more linear electron flux through PSII (ETR)
than WT plants. Moreover, after 12 weeks of growth at
elevated [CO
2
], harvested biomass increased by 13% in
WT plants and more than 22% in transformants when
compared to plants grown in ambient [CO
2
]. In a prior
experiment, the same transformants grown in a green-
house under prevailing light conditions at ambient
[CO
2
](ca. 375 ppm) accumulated 12% more biomass
than WT plants (Lefebvre et al. 2005)[16]. Here, at
ambient [CO
2
] (ca. 385 ppm) under field conditions,
transformants also yielded 12% more biomass than WT
Figure 2 July 31
st
diurnal. Changes in photosynthetic rate (a and b) and electron transport rate (c and d), and the integr al diurnal
photosynthesis (E and F) for SBP and WT plants grown in the field at ambient (ca. 385 ppm) and elevated CO
2
(ca. 585 ppm) under fully open
air conditions at SoyFACE, Urbana, USA. Symbols are means for n = 3 replicate blocks (± se) for WT and SPBase plants per time point.
Rosenthal et al. BMC Plant Biology 2011, 11:123
/>Page 6 of 12
Figure 3 August 15
th
diurnal. Changes in photosynthetic rate (a and b) and electron transport rate (c and d), and the integral diurnal
photosynthesis (E and F) for SBP and WT plants grown in the field at ambient (ca. 380 ppm) and elevated CO
2
under fully open air conditions
at SoyFACE, Urbana, USA. Symbols are means for n = 4 replicate blocks (± se) for WT and SPBase plants per time point.
Table 2 ANOVA of photosynthetic paramaters V
c,max @ 25
, potential electron transport rate J
max @ 25
,V
c,max @ 25
/J
max @
25
(V/J), day respiration (R
d
), for WT and transformants (Type) at ambient and elevated [CO
2
]
1-Aug Vc,max Jmax V/J Rd
Df F pdfF pdfF pdfF p
type 1, 14.2 0.03 0.8661 1, 16 2.58 0.1276 1, 14 1.55 0.2329 1, 14 23.22 0.0003
CO
2
1, 14.2 0.76 0.3979 1, 16 2.44 0.1381 1, 14 5.86 0.0296 1, 14 17.87 0.0008
type*CO
2
1, 14.2 0.1 0.7524 1, 16 6.79 0.0191 1,14 2.81 0.116 1, 14 0.9 0.3592
15-Aug Vc,max Jmax V/J Rd
Df F pdfF pdfF pdfF p
type 1, 20 2.4 0.1371 1, 20 2.57 0.1243 1, 20 0 0.9702 1, 20 0.03 0.8753
CO
2
1, 20 73.72 <.0001 1, 20 18.18 0.0004 1, 20 40.21 <.0001 1, 20 14.98 0.001
type*CO
2
1, 20 0.3 0.5925 1, 20 1.38 0.2531 1, 20 0.87 0.3608 1, 20 2.5 0.1293
Parameters were derived from A vs [CO
2
] curves measured in the field see methods for details. Only three blocks could be measured on August 1.
Rosenthal et al. BMC Plant Biology 2011, 11:123
/>Page 7 of 12
Figure 4 Photosynthetic parameters derived from response of A to [CO
2
] using a biochemical model of photosynthesis (see methods).
Each day (August 1 and August 15) was analyzed separately with a mixed model ANOVA. Line 11 and line 30 differed only for V/J on aug 1
st
(*)
and were pooled for all other analyses and post hoc tests. Bars are means (± se) (August 1 n = 3) (August 15 n = 4). Bars with different capital
letters are significantly different see results for specific p values).
Rosenthal et al. BMC Plant Biology 2011, 11:123
/>Page 8 of 12
plants (see Figure 5) consistent with the Lefebvre et al
(2005)[16] greenhouse study. Taken together, these
results support our hypothesis and clearly show the ben-
efit of overexpressing SBPase in field grown plants at
both current and future levels of atmospheric [CO
2
].
WT biomass was 13% greater in elevated [CO
2
] when
compared to ambient grown WT plants, which is some-
what lower than the average increase in biomass for C
3
crops in FACE experiments [i.e. 19.8% in [46]]. Growth
at elevated [CO
2
] alters plant insect interaction and
incr eases palatability of crops [47-50]; thus it is possible
that yield stimulations wereslightlylowerbecauseof
aphid and hornworm herbivory (pers obs). In tobacco in
particular, aphid infestation significantly reduced the sti-
mulatory effect of [CO
2
] on biomass [51]. Nevertheless,
transformant biomass increased more than WT at ele-
vated [CO
2
](22.7%)andmorethantheaverageforC
3
crops in FACE experiments.
Lefebvre et al. (2005)[16] reported that the greatest
differences between transformants and WT photosyn-
thetic rates occurred prior to flowering in greenhouse
plants and during early development in chamber grown
plants. The differences be tween young expanding and
fully expanded leaves could not be accounted for by dif-
ferential SBPase activity (Lefebvre et al. 2005). We show
that in ambient and elevated [CO
2
] plots, carbon uptake
was enhanced more for transformants during the vege-
tativ e phase (i.e. July 31) than when plants were starting
to flower (August 15). When plants were beginning to
flower, differences between transformants and WT were
no longer detectable, yet carbon uptake was consiste ntly
stimulated for plants growing in elevated [CO
2
]. Ulti-
mately, even though the realized increase in A and A’
between WT and transformants falls well short of the
theoretical 40% increase in assimilation predicted if
plants were to reallocate 15% of photosynthetic
resource s from Rubisco to RuBP regeneration [e.g., [7]],
incr eases in the carbon uptake of transformants early in
growth and prior to flowering were sufficiently large to
increase final biomass.
Several studies demonstrate that changing expression
and activity level of SBPase directly impacts carbon
assimilation, growth, and biomass accumulation in
tobacco growing at current ambient [CO
2
](ca.385
ppm) [16,19,52-55]. While the positive relationship
between SBPase activity and carbon assimilation was
clearly shown in WT and transfo rmants [16,19], overex-
pression of SBPase in rice and tobacco has not always
increased biomass for plants grown at ambient [CO
2
]
levels in controlled environments [16, 33,34]. For
instance, Lefebvre et al. noted that no increase in photo-
synthesis or plant yield was evident for tobacco transfor-
mants grown in winter when days were shorter and light
levels were lower[16] (S. Lefebvre, J.C. Lloyd, and C.
Raines unpublished data). The observations of Lefebvre
et al. [16] and this study are also consistent with the
notion that SBPase exerts control over CO
2
fixation
under light saturating conditions. By definition, the
amount of SPBase would not affect the light limited rate
of photosynthesis which depends on the rate of produc-
tion of NADPH and ATP on the photosynthetic mem-
brane. Our diurnal measurements are consistent with
these expectations, as transforma nts with increased
SBPase activity showed the greatest increases in carbon
assimilation relative to wild type plants around midday
when light levels were highest. In contrast, there was no
difference in assimilation rates between the SBPase over-
expressing and wild type plants at the beginning or end
of the day (Figure 2).
Acclimation to [CO
2
] increases nutrient use efficiency
more for transformants than WT
Both WT an d transformants showed evidence of a simi-
lar decrease in V
c,max
afteramonthofgrowthatele-
vated [CO
2
],indicating photosynthetic acclimation via
down regulation of in vivo Rubisco capacity. Photosyn-
thetic acclimation to growth in elevated [CO
2
]ispre-
sumed to be a biochemical adjustment to optimize
nitrogen use [6]. As [CO
2
] increases so does the cataly-
tic rate of Rubisco, therefore less N needs to be invested
in Rubisco to fix carbon. Reallocation of N is then, for
instance, available to upregulate respiratory metabolism
in response to growth at elevated [CO
2
][56].SBPase
represents less than 1% of the N contained in the
enzymes of photosynthetic carbon metabo lism [21]. It is
therefore remarkable that ca. 50% increase in the
amount of this protein in transformants results in
detectable increases in CO
2
assimilation. The relatively
large increase in CO
2
assimilation at eleva ted [CO
2
] was
associated with a significant decrease in leaf N per unit
Table 3 Analysis of variance of the effects of [CO
2
] and plant type (WT vs. Transformant) on specific leaf area (SLA),
leaf nitrogen content (%N), leaf carbon to nitrogen ration (C:N) and final biomass (Kg/ha) for n = 3 blocks
SLA %N C:N Biomass
df F p F p F p F p
type 1,15 6.57 0.0217 1.22 0.2875 3.9 0.0671 4.05 0.0625
CO
2
1,15 16.69 0.001 29.65 <.0001 17.36 0.0008 5.03 0.0404
type*CO
2
1,15 2.63 0.1257 3.52 0.0809 5.65 0.0312 0.45 0.5121
Rosenthal et al. BMC Plant Biology 2011, 11:123
/>Page 9 of 12
mass (Figure 5). Thus for a small increase in protein,
transformants had a significantly greater increases in
nitrogen use efficiency than WT at elevated [CO
2
]. The
results are consistent with numerous other FACE stu-
dies showing that [CO
2
]will stimulate growth in spite of
photosynthetic acclimation and that growth at elevated
[CO
2
]increases nitrogen use efficiency [reviewed in [57]].
Transformants and WT plants grown in elevated
[CO
2
] tended to have higher respiration in the light (R
d
)
than plants in ambient [CO
2
]plots. Leaves of plants
grown under elevated [CO
2
] accumulate larger concen-
trations of non-structural carbohydrates (i.e. sugar and
starch) [46], and this may underlie higher respiration
[58]. Recently, Leakey et al. [56] demonstrated that the
acclimation response of respiration to elevated [CO
2
]
was mediated via transcriptional upregulation of respira-
tory enzymes. We speculate that the reportedly greater
sucrose and starch accumulation in transformants [16]
stimulates additional acclimation of respiration to e le-
vated [CO
2
] and may therefore also diminish the benefit
of overexpressing SBPase. Alternatively, higher R
d
in
transformants may be a result of the unregulated over-
expression of the enzyme. Either way, higher R
d
,the
requirementforhighlight,andunmeasurednatural
stresses all would contribute to a lower realized benefit
to overexpressing SBPase in the field.
Conclusion
The data presented in this paper have demonstrated that
transgenic tobacco plants with increased SBPase have the
potential for greater stimulation of photosynthesis and
biomass production relative to wild type tobacco when
grown at elevated [CO
2
]. Differences betwe en theoretical
and realized increases in carbon assimilation are to be
expected as studies of PCR cycle antisense plants have
demonstrated that the relative i mportance of any one
PCR cycle enzyme is not fixed and will vary accord ing to
environmental and developmental cond itions [[20], this
study,[59]]. Nevertheless, our findings are consistent with
the notion that elevating [CO
2
] increases the metabolic
control of RuBP-regeneration and decreases the control
exerted by Rubisco at light saturation [6,7]. Though
smaller than theoretically predicted, the increases in
photosynthetic stimulation at elevated [CO
2
]demon-
strated here are indicative that C
3
crop plants can be
engineered to meet a rapidly changing environment.
Acknowledgements
We thank Andrew Leakey for insightful discussion. We appreciate the help of
Nathan Couch, Vai Lor, and David Oh in the field experiment and the
assistance of Meghan Angley and Demat Fazil in the greenhouse. We also
thank Elie Schwartz for technical help in the lab. This work was supported in
part by USDA-ARS.
Figure 5 Plot means for specific leaf area (SLA), leaf nitrogen
(N), leaf carbon to nitrogen ratio (C:N), and final above ground
biomass for WT and transformants. Data for SLA, Leaf N and C:N
are from the same leaf disks. Therefore leaf N is presented on an
equal area basis. Bars with different capital letters are significantly
different (see results for specific p values).
Rosenthal et al. BMC Plant Biology 2011, 11:123
/>Page 10 of 12
Author details
1
Global Change and Photosynthesis Research Unit, United States
Department of Agriculture, Institute for Genomic Biology, 1206 West Gregory
Drive, Urbana, IL, 61801, USA.
2
Department of Plant Biology, Institute for
Genomic Biology, 1206 West Gregory Drive, University of Illinois, Urbana, IL,
61801, USA.
3
Department of Biological Sciences, University of Essex,
Wivenhoe Park, Colchester, UK, CO43SQ. Current address: Department of
Biology, University of Isfahan, Iran.
4
Department of Biological Sciences,
University of Essex, Wivenhoe Park, Colchester, CO43SQ, UK.
5
Department of
Plant Biology and Crop Sciences, Institute for Genomic Biology, 1206 West
Gregory Drive, University of Illinois, Urbana, IL, 61801, USA.
6
Global Change
and Photosynthesis Research Unit, United States Department of Agriculture,
Institute for Genomic Biology, 1206 West Gregory Drive, Urbana, IL, 61801,
USA; Department of Plant Biology and Crop Sciences, University of Illinois,
Urbana, IL, 61801, USA.
Authors’ contributions
DR Conceived and designed the experiment, acquired and analyzed the
data, and wrote the paper. AL aided in data acquisition and analysis, revised
the paper, and gave final approval of the manuscript. MK aided in data
acquisition, data analysis and gave final approval of the manuscript. CR
provided the transformants, provided technical support, revised the paper,
and gave final approval of the manuscript. SL and DO conceived and aided
in the design of the experiment, revised the manuscript, and gave final
approval of the manuscript.
Received: 10 May 2011 Accepted: 31 August 2011
Published: 31 August 2011
References
1. Farquhar GD, von Caemmerer S, Berry JA: A biochemical model of
photosynthetic CO
2
assimilation in leaves of C
3
species. Planta 1980,
149(1):78-90.
2. Sharkey TD: O2 insensitive photosynthesis in C3 plants -it’s occurence
and a possible explanation. Plant Physiology 1985, 78(1):71-75.
3. Cavagnaro TR, Gleadow RM, Miller RE: Plant nutrient acquisition and
utilisation in a high carbon dioxide world. Functional Plant Biology 2011,
38(2):87-96.
4. IPCC: Summary for Policy Makers. In Climate Change 2007: The Physical
Science Basis Contribution of Working Group 1 to the Fourth Assesment Report
of the Intergovernmental Panel on Climate Change. Edited by: Solomon S,
Quin D, Manning M, Chen Z, Marquis M, Averyt KB, Tignor M, Miller HL.
Cambridge, UK and New York, NY: Cambridge University Press; 2007:.
5. Le Quere C, Raupach MR, Canadell JG, Marland G, Bopp L, Ciais P,
Conway TJ, Doney SC, Feely RA, Foster P, et al: Trends in the sources and
sinks of carbon dioxide. Nature Geoscience 2009, 2(12):831-836.
6. Drake BG, Gonzalez-Meler MA, Long SP: More efficient plants: A
consequence of rising atmospheric CO
2
? Annual Review of Plant
Physiology and Plant Molecular Biology 1997, 48:609-639.
7. Long SP, Ainsworth EA, Rogers A, Ort DR: Rising atmospheric carbon
dioxide: Plants face the future. Annual Review of Plant Biology 2004,
55:591-628.
8. Long SP, Ainsworth EA, Leakey ADB, Nosberger J, Ort DR: Food for
thought: Lower-than-expected crop yield stimulation with rising CO
2
concentrations. Science 2006, 312(5782):1918-1921.
9. Zhu XG, Long SP, Ort DR: What is the maximum efficiency with which
photosynthesis can convert solar energy into biomass? Current Opinion in
Biotechnology 2008, 19(2):153-159.
10. Long SP, Zhu XG, Naidu SL, Ort DR: Can improvement in photosynthesis
increase crop yields? Plant Cell and Environment 2006, 29(3):315-330.
11. Long SP, Ort DR: More than taking the heat: crops and global change.
Current Opinion in Plant Biology 2010, 13(3):241-248.
12. Zhu XG, Long SP, Ort DR: Improving Photosynthetic Efficiency for Greater
Yield. Annual Review of Plant Biology 2010, 61:235-261.
13. Bruinsma J, (ed): World agriculture: towards 2015/2030: an FAO
perspective. London: Earthscan; 2003.
14. Lobell DB, Cassman KG, Field CB: Crop Yield Gaps: Their Importance,
Magnitudes, and Causes. Annual Review of Environment and Resources
2009, 34:179-204.
15. Bernacchi CJ, Morgan PB, Ort DR, Long SP: The growth of soybean under
free air CO
2
enrichment (FACE) stimulates photosynthesis while
decreasing in vivo Rubisco capacity. Planta 2005, 220(3):434-446.
16. Lefebvre S, Lawson T, Zakhleniuk OV, Lloyd JC, Raines CA: Increased
sedoheptulose-1,7-bisphosphatase activity in transgenic tobacco plants
stimulates photosynthesis and growth from an early stage in
development. (vol 138, pg 451, 2005). Plant Physiology 2005,
138(2):1174-1174.
17. Ainsworth EA, Ort DR: How do we improve crop production in a
warming world? Plant Physiology 2010, 154(2):526-530.
18. Yamori W, Takahashi S, Makino A, Price GD, Badger MR, von Caemmerer S:
The Roles of ATP Synthase and the Cytochrome b(6)/f Complexes in
Limiting Chloroplast Electron Transport and Determining Photosynthetic
Capacity. Plant Physiology 2010, 155(2):956-962.
19. Harrison EP, Willingham NM, Lloyd JC, Raines CA: Reduced sedoheptulose-
1,7-bisphosphatase levels in transgenic tobacco lead to decreased
photosynthetic capacity and altered carbohydrate accumulation. Planta
1998, 204(1):27-36.
20. Raines CA: The Calvin cycle revisited. Photosynthesis Research 2003,
75(1):1-10.
21. Zhu XG, de Sturler E, Long SP: Optimizing the distribution of resources
between enzymes of carbon metabolism can dramatically increase
photosynthetic rate: A numerical simulation using an evolutionary
algorithm. Plant Physiology 2007, 145(2):513-526.
22. Poolman MG, Fell DA, Thomas S: Modelling photosynthesis and its
control. Journal of Experimental Botany 2000, 51:319-328.
23. Quick WP, Schurr U, Scheibe R, Schulze ED, Rodermel SR, Bogorad L, Stitt M:
Decreased Ribulose-1,5-Bisphosphate Carboxylase-Oxygenase in
transgenic tobacco transformed with antisense rbcs. 1: impact on
photosynthesis in ambient growth conditions. Planta 1991,
183(4):542-554.
24. Spreitzer RJ, Salvucci ME: Rubisco: Structure, regulatory interactions, and
possibilities for a better enzyme. Annual Review of Plant Biology 2002,
53:449-475.
25. Suzuki Y, Miyamoto T, Yoshizawa R, Mae T, Makino A: Rubisco content and
photosynthesis of leaves at different positions in transgenic rice with an
overexpression of RBCS. Plant Cell and Environment 2009, 32(4):417-427.
26. Makino A, Sage RF: Temperature response of photosynthesis in
transgenic rice transformed with ‘sense’ or ‘antisense’ rbcS. Plant and Cell
Physiology 2007, 48(10):1472-1483.
27. Zhu XG, Portis AR, Long SP: Would transformation of C-3 crop plants with
foreign Rubisco increase productivity? A computational analysis
extrapolating from kinetic properties to canopy photosynthesis. Plant
Cell and Environment 2004, 27(2):155-165.
28. Roy H, Andrews TJ:
Rubiso Assembly and Metabolism. In Photosynthesis
Physiology
and Metabolism. Volume 9. Edited by: Leegood RC, Sharkey TD,
von Caemmerer S. Dordrecht: Kluwer; 2000:53-83.
29. Whitney SM, Sharwood RE: Construction of a tobacco master line to
improve Rubisco engineering in chloroplasts. Journal of Experimental
Botany 2008, 59(7):1909-1921.
30. von Caemmerer S, Evans JR: Enhancing C
3
Photosynthesis. Plant Physiology
2010, 154(2):589-592.
31. Raines CA: Transgenic approaches to manipulate the environmental
responses of the C
3
carbon fixation cycle. Plant Cell and Environment
2006, 29(3):331-339.
32. Martin W, Scheibe R, Schnarrenberger C: The Calvin Cycle and Its
Regulation. In Photosynthesis: Physiology and Metabolism. Edited by:
Leegood RC, Sharkey TD, von Caemmerer S. Boston: Kluwer Academic
Publishers; 2000:9-51.
33. Feng LL, Han YJ, Liu G, An BG, Yang J, Yang GH, Li YS, Zhu YG:
Overexpression of sedoheptulose-1,7-bisphosphatase enhances
photosynthesis and growth under salt stress in transgenic rice plants.
Functional Plant Biology 2007, 34(9):822-834.
34. Feng LL, Wang K, Li Y, Tan YP, Kong J, Li H, Li YS, Zhu YG: Overexpression
of SBPase enhances photosynthesis against high temperature stress in
transgenic rice plants. Plant Cell Reports 2007, 26(9):1635-1646.
35. von Caemmerer S: Biochemical Models of Leaf Photosynthesis.
Collingwood, Victoria, Australia: CSIRO Publishing; 2000.
36. Morgan PB, Bollero GA, Nelson RL, Dohleman FG, Long SP: Smaller than
predicted increase in aboveground net primary production and yield of
Rosenthal et al. BMC Plant Biology 2011, 11:123
/>Page 11 of 12
field-grown soybean under fully open-air [CO
2
] elevation. Global Change
Biology 2005, 11(10):1856-1865.
37. Miglietta F, Peressotti A, Vaccari FP, Zaldei A, deAngelis P, Scarascia-
Mugnozza G: Free-air CO
2
enrichment (FACE) of a poplar plantation: the
POPFACE fumigation system. New Phytologist 2001, 150(2):465-476.
38. Bernacchi CJ, Leakey ADB, Heady LE, Morgan PB, Dohleman FG,
McGrath JM, Gillespie KM, Wittig VE, Rogers A, Long SP, et al: Hourly and
seasonal variation in photosynthesis and stomatal conductance of
soybean grown at future CO
2
and ozone concentrations for 3 years
under fully open-air field conditions. Plant Cell and Environment 2006,
29(11):2077-2090.
39. Long SP, Bernacchi CJ: Gas exchange measurements, what can they tell
us about the underlying limitations to photosynthesis? Procedures and
sources of error. Journal of Experimental Botany 2003, 54(392):2393-2401.
40. Baker NR: Chlorophyll fluorescence: A probe of photosynthesis in vivo.
Annual Review of Plant Biology 2008, 59:89-113.
41. Genty B, Briantais JM, Baker NR: The relationship between quantum yield
of photosynthetic electron tranport and quenching of chlorophyll
fluorescence. Biochimica Et Biophysica Acta 1989, 990(1):87-92.
42. Bernacchi CJ, Pimentel C, Long SP: In vivo temperature response
functions of parameters required to model RuBP-limited photosynthesis.
Plant Cell and Environment 2003, 26(9):1419-1430.
43. Bernacchi CJ, Singsaas EL, Pimentel C, Portis AR, Long SP: Improved
temperature response functions for models of Rubisco-limited
photosynthesis. Plant Cell and Environment 2001, 24(2):253-259.
44. Scheiner SM: Theories, Hypotheses and Statistics. In Design and Analysis of
Ecological Experiments. Edited by: Scheiner SM, Gurevitch J. New York:
Oxford University Press; 2001:.
45. Sokal RR, Rohlf FJ: Estimation and Hypothesis Testing. Biometry. 3 edition.
New York: W.H. Freeman; 1995, 127-175.
46. Ainsworth EA, Long SP: What have we learned from 15 years of free-air
CO
2
enrichment (FACE)? A meta-analytic review of the responses of
photosynthesis, canopy properties and plant production to rising CO
2
.
New Phytologist 2005, 165(2):351-371.
47. Casteel CL, O’Neill BF, Zavala JA, Bilgin DD, Berenbaum MR, DeLucia EH:
Transcriptional profiling reveals elevated CO
2
and elevated O
3
alter
resistance of soybean (Glycine max) to Japanese beetles (Popillia
japonica). Plant Cell and Environment 2008, 31(4):419-434.
48. Dermody O, O’Neill BF, Zangerl AR, Berenbaum MR, DeLucia EH: Effects of
elevated CO
2
and O
3
on leaf damage and insect abundance in a
soybean agroecosystem. Arthropod-Plant Interactions 2008, 2(3):125-135.
49. Lau JA, Tiffin P: Elevated carbon dioxide concentrations indirectly affect
plant fitness by altering plant tolerance to herbivory. Oecologia 2009,
161(2):401-410.
50. Zavala JA, Casteel CL, DeLucia EH, Berenbaum MR: Anthropogenic increase
in carbon dioxide compromises plant defense against invasive insects.
Proceedings of the National Academy of Sciences of the United States of
America 2008, 105(13):5129-5133.
51. Fu X, Ye LF, Kang L, Ge F: Elevated CO
2
shifts the focus of tobacco plant
defences from cucumber mosaic virus to the green peach aphid. Plant
Cell and Environment 2010, 33(12):2056-2064.
52. Olcer H, Lloyd JC, Raines CA: Photosynthetic capacity is differentially
affected by reductions in sedoheptulose-1,7-bisphosphatase activity
during leaf development in transgenic tobacco plants. Plant Physiology
2001, 125(2):982-989.
53. Harrison EP, Olcer H, Lloyd JC, Long SP, Raines CA: Small decreases in
SBPase cause a linear decline in the apparent RuBP regeneration rate,
but do not affect Rubisco carboxylation capacity. Journal of Experimental
Botany 2001, 52(362):1779-1784.
54. Lawson T, Bryant B, Lefebvre S, Lloyd JC, Raines CA: Decreased SBPase
activity alters growth and development in transgenic tobacco plants.
Plant Cell and Environment 2006, 29(1):48-58.
55. Miyagawa Y, Tamoi M, Shigeoka S: Overexpression of a cyanobacterial
fructose-1,6-/sedoheptulose-1,7-bisphosphatase in tobacco enhances
photosynthesis and growth. Nature Biotechnology 2001, 19(10):965-969.
56. Leakey ADB, Xu F, Gillespie KM, McGrath JM, Ainsworth EA, Ort DR:
Genomic basis for stimulated respiration by plants growing under
elevated carbon dioxide. Proceedings of the National Academy of Sciences
of the United States of America 2009, 106(9):3597-3602.
57. Leakey ADB, Ainsworth EA, Bernacchi CJ, Rogers A, Long SP, Ort DR:
Elevated CO
2
effects on plant carbon, nitrogen, and water relations: six
important lessons from FACE. Journal of Experimental Botany 2009,
60(10):2859-2876.
58. Davey PA, Hunt S, Hymus GJ, DeLucia EH, Drake BG, Karnosky DF, Long SP:
Respiratory oxygen uptake is not decreased by an instantaneous
elevation of [CO
2
], but is increased with long-term growth in the field at
elevated [CO
2
]. Plant Physiology 2004, 134(1):520-527.
59. Stitt M, Schulze D: Does Rubisco control the rate of photosynthesis and
plant growth: an exercise in molecular ecophysiology. Plant Cell and
Environment 1994, 17(5):465-487.
doi:10.1186/1471-2229-11-123
Cite this article as: Rosenthal et al.: Over-expressing the C
3
photosynthesis cycle enzyme Sedoheptulose-1-7 Bisphosphatase
improves photosynthetic carbon gain and yield under fully open air
CO
2
fumigation (FACE). BMC Plant Biology 2011 11:123.
Submit your next manuscript to BioMed Central
and take full advantage of:
• Convenient online submission
• Thorough peer review
• No space constraints or color figure charges
• Immediate publication on acceptance
• Inclusion in PubMed, CAS, Scopus and Google Scholar
• Research which is freely available for redistribution
Submit your manuscript at
www.biomedcentral.com/submit
Rosenthal et al. BMC Plant Biology 2011, 11:123
/>Page 12 of 12