báo cáo khoa học: "Transcriptional analysis of cell growth and morphogenesis in the unicellular green alga Micrasterias (Streptophyta), with emphasis on the role of expansin" pot
Bạn đang xem bản rút gọn của tài liệu. Xem và tải ngay bản đầy đủ của tài liệu tại đây (12.49 MB, 17 trang )
RESEARCH ARTIC LE Open Access
Transcriptional analysis of cell growth and
morphogenesis in the unicellular green alga
Micrasterias (Streptophyta), with emphasis on the
role of expansin
Katrijn Vannerum
1,2,3
, Marie JJ Huysman
1,2,3
, Riet De Rycke
2,3
, Marnik Vuylsteke
2,3
, Frederik Leliaert
4
, Jacob Pollier
2,3
,
Ursula Lütz-Meindl
5
, Jeroen Gillard
1,2,3
, Lieven De Veylder
2,3
, Alain Goossens
2,3
, Dirk Inzé
2,3
and Wim Vyverman
1*
Abstract
Background: Streptophyte green algae share several characteristics of cell growth and cell wall formation with
their relatives, the embryophytic land plants. The multilobed cell wall of Micrasterias denticulata that rebuilds
symmetrically after cell division and consists of pectin and cellulose, makes this unicellular streptophyte alga an
interesting model system to study the molecular controls on cell shape and cell wall formation in green plants.
Results: Genome-wide transcript expression profiling of synchronously growing cells identified 107 genes of which
the expre ssion correlated with the growth phase. Four transcripts showed high similarity to expansins that had not
been examined previously in green algae. Phylogenetic analysis suggests that these genes are most closely related
to the plant EXPANSIN A family, although their domain organization is very divergent. A GFP-tagged version of the
expansin-resembling protein MdEXP2 localized to the cell wall and in Golgi-derived vesicles. Overexpression
phenotypes ranged from lobe elongation to loss of growth polarity and planarity. These results indicate that
MdEXP2 can alter the cell wall structure and, thus, might have a function related to that of land plant expansins
during cell morphogenesis.
Conclusions: Our study demonstrates the potential of M. denticulata as a unicellular model system, in which cell
growth mechanisms have been discovered similar to those in land plants. Additionally, evidence is provided that
the evolutionary origins of many cell wall components and regulatory genes in embryophytes preced e the
colonization of land.
Background
Although the form and function of plant cells are
strongly correlated, the processes that determine the cell
shape remain largely unknown. Plant cell morphogenesis
is regulated in a non-cell-autonomous fashion by the
surrounding tissues [1], hormone interference during
ontogenesis, and sometimes by polyploidy as a conse-
quence of endoreduplication [2,3]. In contrast, in unicel-
lular relatives of land plants, it is possible to study the
endogenous controls of cell morphogenesis without the
interference by interacting cells and to better
understand how these mechanisms ha ve evolved in the
green lineage.
The desmid Micrasterias denticulata is a member of
the conjugating green algae (Zygnematophyceae) that
comprise the closest extant unicellular relatives of land
plants [4-8]. M. denticulata cells consist of two bilater-
ally symmetrical flat semicells, notched deeply around
their perimeter into one polar lobe and four main lateral
lobes. Following cell division, each semicell builds a new
one th rough a process of septum bulging and symmetri-
cal local growth cessations to form the successive lobes
(Figure 1A). After completion of the primary wall (dur-
ing the doublet stage), a rigid cellulosic secondary cell
wall pierced by pores is deposited, followed by shedding
of it. This p eculiar grow th mechanism makes
* Correspondence:
1
Laboratory of Protistology and Aquatic Ecology, Department of Biology,
Ghent University, 9000 Gent, Belgium
Full list of author information is available at the end of the article
Vannerum et al. BMC Plant Biology 2011, 11:128
/>© 2011 Vannerum et al; licensee BioMed Central Ltd. This is an Open Access article distributed under the terms of the Creative
Commons Attribution License ( which permits unrestricted use, distribution, and
reproduction in any medium, provided the original work is properly cited.
Micrasterias an ideal model to study the spatial and
temporal patterning of cell wall biogenesis [9].
Ultimately, the plant cell morphology is determined by
the composition and structure of the cell wall that gov-
erns the c ell expansion direction and rate. As in land
plants, the primary cell wall of M. denticulata Bréb.
consists mainly of pectins [10,11], cellulose microfibrils
[12], hemicelluloses [13] and arabinogalactan proteins
(AGPs) [10,13]. The secondary cell wall owes it rigidness
to cellulose microfibrils originating from rosettes orga-
nized as hexago nal arrays [14,15], whereas mixed-linked
glucan is the dominant hemicellulose [13].
0
10
20
30
40
50
60
70
80
T1 T2 T3 T4 T5
% m orphogenesis
% doublet stage
50-8525-655-151-100
% lobe stage
015-2515-301-101-5
% bulge stage
05-1010-1510-151-5
dominating morphogenetic stages (cf fig. A)
10 9-102-92-31-2
relative time (hour)
97,552,50
sample
T5T4T3T2T1
D
C
B
doublet stage
lobe stage
9h 19h
9h
19h
9h
19h
refresh
medium
start prolonged
light period
cell divisions
begin
after 3-4
weeks
no divisions
anymore
bulge stage
RNA sampling
A
1
2
3
4
5
10
98
7
6
N
N
N
N
N
N
N
N
N
N
N
N
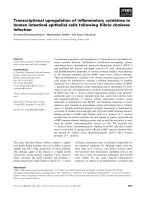
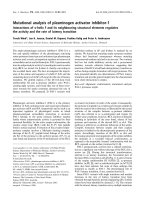
Figure 1 Morphogenesis of Micrasterias de nticulata and distribution of morph ogenetic stages in the synchronize d sample series.(A)
Morphogenesis of M. denticulata. (1) Vegetative cell. (2) During mitosis, a septum originating from the cell wall girdle grows inward centripetally,
taking 15-20 min. (3) Bulge stage; the septum bulges uniformly. (4) Development of the first pair of indentations (arrows), ~75 min after septum
completion. (5) Three-lobed stage. (6) Development of the second pair of indentations (arrows). (7) Five-lobed stage. (8) Doubling of the lateral
lobes (arrows). (9) Formation of further indentations and lobe tips, followed by the doublet stage. N, Nucleus. Note the migration of the nucleus
during cell growth. Scale bar = 100 μm. (B) Scheme of the synchronization protocol. After 3-4 weeks, a stationary culture is obtained and the
growth medium is refreshed, concomitantly with the reduction in cell density, shortly before the beginning of the light period of that day. The
majority of the cells divide in the second dark period afterward. This dark period is replaced by a light period and sampled. Black, dark period;
white, light period. (C), Distribution of morphogenetic stages in the RNA samples for cDNA-AFLP, replication 1. (D) Table representing the
characteristics of the samples used for cDNA-AFLP (replications 1 and 2) and real-time qPCR.
Vannerum et al. BMC Plant Biology 2011, 11:128
/>Page 2 of 17
In land plants, expansins are important regulators of
turgor-driven cell wall expansion. These cell wall p ro-
teins comprise a large multigene superfamily consisting
of four families (EXPA, EXPB, EXLA and EXLB) of
which the evolutionary relationships are well character-
ized [16,17]. They are unique i n their ability to loosen
the cell wall non-enzymatically by disrupting hydrogen
bonds that link the cellulose and hemicellulose wall
components [18-21]. Land plant expansins consist of
two domains and a secretion signal. The N-terminal
expansin domain 1 and the C-terminal expansin domain
2 are homologous to the catalytic domain of glycoside
hyd rolase family 45 (GH45) proteins and a domain pre-
sent in a family of grass pollen allergens, identified as a
putative cellulose binding site [22], respectively. Expan-
sinsplayaroleintissuedevelopment[23,24]andin
growth of suspension-cultured cells [25,26]. Although
genes encoding expansin-like proteins have been
recently identified in green algae transcriptomes [27],
their physiological function and phylogenetic relation-
ships with land plant expansins remain unknown.
Here, we explore the molecular basis of cell morpho-
genesis and cell wall formation in synchronized M. den-
ticulata cells by means of a cDNA-amplified fragment
length polymorphism (cDNA-AFLP)-based quantitative
transcriptome analysis [28]. Several cell wall-related
genes, among which expansins, were identified. Exami-
nation of the expansins provided the first structural,
phylogenetic and functional data on green algal homolo-
gues within this gene family.
Results
cDNA-AFLP expression profiling
First we developed a synchronization protocol to moni-
tor the cell morphogenesis-related gene expression in
M. denticulata. The protocol was based on the observa-
tion that the majority of the cells grown in a 14-h l ight/
10-h dark regime divided during the second dark period,
after the growth medium of a stationary culture
(obtained after 3-4 weeks) had b een refreshed and, con-
comitantly, the cell density reduced at the start of the
light period. Replacing the dark period by a light period
enhanced the amount of synchronically dividing cells
(Figure 1B). The effect of cell density on synchronization
was significant (GLM; F-test; P < 0.001), with an optimal
cell density below 80 ce lls mL
-1
. Following synchroniza-
tion, up to 85% of the cell population divided during an
8- to 9-h period, showing a sigmoid course (Figure 1C,
D; Additional file 1). By sampling t his period at five
consecutive time p oints we obtaine d samples wi th dif-
ferent proportions of cells at the major morphogenetic
stages (Figure 1A,C,D). cDNA-AFLP expression profiling
of these samples allowed th e assignment of differentially
expressed genes to either the onset of cell divisio n (Fig-
ure 1A2; Figure 2 (C1a and C1b)), the bulge (Figure
1A3; Figure 2 (C2)), the lobe (Figure. 1A4-A9; Figure 2
(C3)), or the doublet stage, during which the secondary
cell wall is formed (Figure 2 (C4 and C5)). In total, the
relative abundance was monitored of 4574 transcript-
derived fragments (TDFs) during the cell g rowth of M.
denticulata (Figure 3, Additional file 2), fo r which the
expression patterns were altered visibly across time in
1420 and significantly (P<0.009; Q<0.05) in 476 TDFs.
According to other studies [29,30], we estimate that
two-thirds of the mRNA population was sampled,
implying that the real number of gen es differentially
expressed during cell growth of M. denticulata could be
~2100. A high similarity (E-value < 1.E-01 and similarity
>50%) to database entries with assigned identities and
unknown or hypothetical genes was found for 107 and
22 TDFs, respectively, mostly with Embryophytes and
not with Chlorophyta. However, the majority of the
TDFs (324 o r 71.5%) showed no sequence similarity to
any database entry (Figure 3; Additional file 3). Plausible
explanations might be sequences too short to reveal any
significant identity, short sequences representing non-
conserved portions of genes, TDFs originating from the
3’ -untranslated region of a gene, or TDFs representing
genes specific to M. denticulata or streptophytic algae.
Of the 129 annotated genes, 118 clustered into six groups
(designated C1a, C1b, C2, C3, C4, and C5) (Figure 2)
according to the timing of their highest expression (Figure
1C,D). Except for one cluster consisting of six genes (clus-
ter C1b; Figure 2), the expression profiles were reproduci-
ble in the two independent sampling series. The few genes
not included in one of the described clusters typically
showed narrow temporal expression patterns.
Based on their annotation, the TDFs were classified
into 14 functional categories, named according to the
Gene Ontology terminology (eontology.
org) (Figure 3; Additional file 3). The association
between the fu nctional category and the TDF clustering
was not significant (c
2
test; p = 0.070). The major group
with a significant hit was involved in cell wall metabo-
lism. The second largest cat egory corresponded to
sequences sharing significant similarity to unknown or
hypothetical proteins.
Of 18 TDFs with similarity to genes involved in cell
wall biogenesis or cell pattern formation, the RNA sam-
ples of the second cDNA-AFLP replication series and
on an independently sampled series (Additional file 1)
were analyzed by real-time quantitative reverse-tran-
scription (qRT)-PCR. In general, the expression profiles
obtained by cDNA-AFLP and qRT-PCR (Additional file
4) correspo nded well (Additional file 5), confirming the
obtained expression results.
Vannerum et al. BMC Plant Biology 2011, 11:128
/>Page 3 of 17
Genes relevant for cell pattern formation
Seven TDFs could be identified that might be relevant for
cell pattern formation in M. denticulata,amongwhich
two members of the Rab GTPase cycle and two members
of the SNARE cy cle of membrane fusion reactions. R ab8,
similar to Md1852, is known to be involved in post-Golgi
transport to the plasma membrane, inducing the forma-
tion of new surface extensions and believed to be regu-
lated by a guanine nucleotide dissociation inhibitor [31]
possibly corresponding to Md08 18. Both Md1852 and
Md0818 belonged to cluster C1a and, thus, had increased
mRNA levels before the onset of mitosis. This observa-
tion might be related to the determination of the basic
symmetry of a M. denticulata cell before mitosis, indi-
cated by the development of a three-lobed semicell after
removal of the nucleus [32]. In contrast, the SNARE
cycle members were highly expressed in cluster C3,
pointing to a role in further differentiation during the
REP2control
REP1 T1
REP1 T3
REP2 T1
REP1 T2
REP1 T5
REP2 T2
REP2 T3
REP2 T4
REP2 T5
C1a
C1b
C3
C2
C4
C5
unclustered
REP1 T4
REP1control
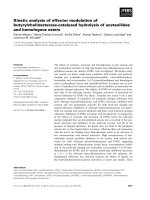
Figure 2 Adaptive quality-based clustering of annotated cell
growth-modulated TDFs. Each row represents the relative
transcript accumulation measured for each TDF across the two
replicated time series. Yellow and blue, transcriptional activation and
repression relative to the average expression level over the time
course, respectively; white, missing data. Cluster names (C1 to C5)
are indicated on the left.
30
22
12
12
8
6
5
5
5
4
4
4
2
2
0 5 10 15 20 25 30 35
cell wall metabolism
unknown
protein metabolic process
transmembrane transporter
signal transduction
fatty acid metabolic process
regulation of transcription
photosynthesis
membrane docking
generation of energy
translation
membrane protein
cytoskeleton-dependent intracellular transport
cell division
DNA replication
# TDFs
8
consƟtuƟvely,
2481
staƟonary,
673
annotated, 129
non-redundant
sequences, 453
isolated (476
significant), 847
differenƟally,
1420
A
B
Figure 3 Transcript derived fragments (TDFs) identified by
cDNA-AFLP analysis of Micrasterias denticulata cell growth. (A)
In total, 4574 TDFs were scored, of which 2481 were constitutively
expressed, 673 only in stationary cultures and 1420 displayed
altered expression patterns across time (476 significantly; P < 0.009;
Q < 0.05). Of the latter group, 847 were isolated from gel. From 453
non-redundant sequences, 129 could be annotated. (B) Functional
classification of the 129 annotated transcript-derived fragments
(TDFs) differentially modulated during cell growth.
Vannerum et al. BMC Plant Biology 2011, 11:128
/>Page 4 of 17
lobe stages for Md1404 (similar to plant syntaxin 32) and
Md1560 (similar to a regulatory AAA-type of ATPase).
Two TDFs were identified encoding putative glyco-
phosphatidylinositol (GPI) anchors: Md4071 and
Md4341, belonging to clusters C1a, and C4, respectively.
Among other properties, the function of a GPI anchor
might be its dominant targeting to a specific membrane
domain [33], possibly establishing a membrane template
for morphogenesis. Md4341 turned out to be a 179-
amino-acid protein containing a signal peptide and a
fasciclindomain(aputative cell adhesion domain) (E-
value 2.9E-07), with similarity to a fasciclin-like and an
AGP-like protein from Brachypodium sylvaticum
[CAJ26371.1] and Arabidopsis thaliana [AAM62616.1],
respectively (Additional file 6).
Md3533 (cluster C3), similar to a very-long-chain fatty
acid-condensing enzyme, might be involved in morpho-
genesis in accordance to the essential role in cell expan-
sion during plant morphogenesis of Arabidopsis [34].
Genes involved in cell wall metabolism
A total of 30 cell wall-related genes were identified. Six
TDFs operating in the monosaccharide metabolism,
evenly distributed over C1 and C3, could be identified
as UDP-pyrophosphorylases (Md1739, Md2333, and
Md2565), a phosphoglucomutase (Md2842), a rhamnose
synthase ( Md1089), and a GDP-mannose 3,5-epimerase
(Md3053). Nine polysaccharide synthesis enzymes all
nearly clustered in C3, among which two cellulose
synthases, Md0757 (see al so [35]) and Md3668, and one
cellulose synthase-like (CSL)geneoftheCSLC family,
Md2838. The exostosin family glycosyltransferases
Md0450, Md1114, Md2144, and the glycosyltransferase
Md0257 might synthesize the hemicellulosic or pecti-
nous part of the cell wall and mucilage as well that is
pectic in nature [11] and secreted simultaneously with
cell wall material during cell growth [36]. Md3598 was
the a-1,6-xylosyltransferase, typical of the hemicellulose
biosyntheti c pathway, whereas Md0888 was the xyloglu-
can endotr ansglycosylase/hydrolase (XET/XTH) that is a
xyloglucan-modifying enzyme. The open reading frame
(ORF) of Md0888 encoded a 277-amino-acid protein
with a signal peptide and a GH16-XET domain (E-value
6.10E-37) and therefore designated MdXTH1. The cata-
lytic site DEIDFEFLG, conse rved among GH16 f amily
members [37] and most seed p lant XTHs [38] was pre-
sent in MdXTH1 as xExDxEFxG and immediately fol-
lowed by a potential N-glycosylation site NxT/S [39]
(Additional file 7). The other 15 identified TDFs were
involved in wall assembly, reorganization, and selective
degradation. Four of them gave significant hits with
expansins: MdEXP1 (C4), MdEXP2 (C4), MdEXP3 (C3),
and MdEXP4 (C3) . Whereas MdEXP4 and MdEXP3
were expressed during the early morphogenetic stages
(C3), MdEXP1 and MdEXP2 were up-regulated during
later stages (C4) (Figure 4). Changes in the internal
structure of the cell walls, required for cell expansion,
might be achieved by the release of hydroxyl radicals
mediated by the class-III peroxidases Md0434 and
Md0493. Peroxidase-generated hydroxyl radicals could
cause non-enzyma tic wall loosening by cleava ge of var-
ious polysaccharides [40]. The ORF of Md0434 con-
tained a secretion signal peptide and a Pfam peroxidase
domain (E-value 2.50E-97) (Additional file 8). The H
2
O
2
substrate for the peroxidase activity was probably gener-
ated by the glyoxal oxidases Md0606, Md1709, and
Md3495. Hydrolytic enzymes included the pectinesterase
Md4415, the endo-b-1,6-galactanase Md1480, and two
members of cluster C5: the polygalact uronidase Md3500
and the b-glucosidase Md0559, possibly involved in
degradation of a connecting zone between the primary
and the secondary cell wall, thereby e nabling shedding
of the primary cell wall [41].
Phylogenetic relationship of M. denticulata expansin-
resembling proteins
As the involvement of expansins in cell growth of green
algae had not been examined previously, we concentrated
the experiments on this class of proteins. The full length
characteristics of the M. denticulata expansin-resembling
proteins (MdEXPs)aregiveninAdditionalfile9.
MdEXP1 and Md EXP4 exhibited the highest sequ ence
similarity (74% identity, 84% similarity) (Figure 5).
Phylogenetic analysis of the first dataset revealed that all
MdEXPs were recovered as a monophyletic group with
high support (BV = 99, PP = 1.00) (Figure 6A). Th e
0
2
4
6
8
10
12
14
16
18
-1500
-1000
-500
0
500
1000
1500
2000
CONTROL T1
T2
T3
T4
T5
% lobe-stage cells
normalized expression values
MdEXP4
MdEXP3
MdEXP1
MdEXP2
% lobe-stage cells
Figure 4 Normalized cDNA-AFLP expression values of
Micrasterias denticulata expansin-resembling proteins in
synchronized cultures in relation to the proportion of lobe-
forming cells in these cultures. The samples (T1-T5) are defined in
Figure 1D.
Vannerum et al. BMC Plant Biology 2011, 11:128
/>Page 5 of 17
Micrasterias and Spirogyra sequences fell within the
plant expansins and were most closely related to the
EXPA family, with which they formed a well supported
clade (BV = 86, PP = 1.00). The MdEXPs are recovered
sister to the EXPA clade and the Spirogyra sequences
form a paraphyletic assemblage, but the relationships
between the Micrasterias and Spirogyra expansins and
theEXPAcladearepoorlysupported.Thehigh
sequence divergence of expansins within and among
Micrasterias and Spirogyra is shown by the relatively
longer branches than those within the EXPA clade. In
the second dataset, the putative expansin sequences of
Chlorophyta formed a highly divergent clade, separated
from the plant expansins by a very long branch (Addi-
tional file 10). Although th e relationships between the
Chlorophyta clade, the Dictyostelium clade and the plant
expansin families were poorly resolved, the phylogenetic
position of the Micrasterias cl ade, closely allied to the
EXPA family, was well supported.
Domain organization of the M. denticulata expansin-
resembling proteins
The structural domain organization of the different
MdEXPs was compared with the characteristic structural
feat ures of plant expansins (Table 1, Figure 5, Figure 7).
A secretion signal peptide was present in all of them
(Figure 5, Figure 7, Table 1). While the pollen-allerg-1
domain occurred in all proteins, except MdEXP4, the
GH45 domain was found in MdEXP2 and MdEXP3
only, a lbeit with insignificant E-values. Nevertheless, in
all sequences, a DPBB-1 domain was presen t, a rare
lipoprotein A-like double-psi beta-barrel, to which
GH45 belongs, and even twice in MdEXP2 (Additional
file 11). The eight cystenyl residues forming disulfide
bridges in f ungal GH45 enzymes and maint aining their
folded structure [16] were conserved in the expansin
domain 1 of some of the plant expansin groups [22] and
also in the MdEXPs (Figure 5). In M. denticulata,the
GGACGY motif was present as GGSCGY/F, whereas
MdEXP4 MARLALALALAFLSPLLFSSPASA SKMVATI 31
MdEXP1 MARLAFFLALVMTSAIILFSPVSS LQLVATI 31
MdEXP2 MKIGIIHALSLLLTSPVIVFVHG AIPTRDGLGTLS 35
MdEXP3 MDTSLVAIALLCSLLGASGQVVGNVAGKPVVKKVTPIVIPPAAAKLFNRPAYGFTASYYG 60
AtEXPA1 MALVTFLFIATLGAMT SHVNGYAGGGWVNAHA
T
F
Y
GGGDA 40
AtEXPB1 MQLFPVILPTLCVFLHLLISGSGS TPPLTHSNQQVAATRWLPATA
T
W
Y
GSAEG 53
C C C C C
MdEXP4 GQVTGGSCGYIN FPPSSILVTGFSEVLYRKGAMCGACFKVKCINDTKCIPNRYVNVM 88
MdEXP1 GQVAGGSCGYTN FPPPLYMVTGFSEVIYRGGAMCGSCFRVQCFNDRNCIRGRAVNVM 88
MdEXP2 GVEKGGSCGFANN FPAPGVFTAGVSAAIYGNGAACGACFVATCANSPQCTANR-VFFT 92
MdEXP3 GQTDGGSCGYGSAQ-QSGYGVATASASTPLYAAGLNCGACFTMSCQGSQRCLPGNTPMLT 119
AtEXPA1 SGTMGGACGYGNLY-SQGYGTNT
AA
LSTALFNNGLSCGACFEIRCQNDGKWCLPGSIVVT 99
AtEXPB1 DGSSGGACGYGSLVDVKPFKARVGAVSPILFKGGEGCGACYKVRCLDKT-ICSKRAVTII 112
. **:**: . . . * :: * **:*: * .
MdEXP4 VTSVCQS TNGTDVCKTGNKALNLDPRAWDLIVSTRAVGSVP IEVYAAGC 137
MdEXP1 VTSICQS TNGTDVCNTGNMALNLDPRAWDLIVSTRAVGSVP VAIYAVSC 137
MdEXP2 VTNQCLG ENSTSPCVTGRSGVALQPQAFDVIATSRAPGIVP VKFTQVPC 141
MdEXP3 VTNLCKA ATG PCSGNKRSWSLAPDVWNGIAVNPNVGVVP VRVTRVPC 166
AtEXPA1 ATNFCPPNNALPNNAGGWCNPPQQ
H
F
D
LSQPVFQRIAQYR-AGIVP VAYRRVPC 152
AtEXPB1 ATDQSPS GPSAKAKHT
H
F
D
LSGAAFGHMAIPGHNGVIRNRGLLNILYRRTAC 164
.*. . . . * .: :. * : : . *
MdEXP4 PKMDGGVVFNVSV-ASASYMQVVVQNVGG WAGSLAS-RLPPM 177
MdEXP1 PQMVGGVQFNVSV-ASVAYMQVLIQNVGGMGRLTQVFASADGV-KFFPMYRNYGSVWAIN 195
MdEXP2 -RTAGGVQFVVQS-GNQYYFAVLIQNVGGPGSLQAVAVSTNGR-TFQLMTRSYGAVWQVS 198
MdEXP3 QRAGG-VQFKVLV-GNPYYLEVLISNVAGSVDLAKVEVLVQGVGYWQPMKHDYGAVYSIS 224
AtEXPA1 VRRGG-IRFTIN GHSYFNLVLITNVGGAGDVHSAMVKGSRT-GWQAMSRNWGQNWQ-S 207
AtEXPB1 KYRGKNIAFHVNAGSTDYWLSLLIEYEDGEGDIGSMHIRQAGSKEWISMKHIWGANWCIV 224
: * : . : ::: * *
MdEXP4 ECVSTKCSG-TGDQCGP 193
MdEXP1 NVNFLKRAVTFKLVD-MNQRALTIPAALPANWGLGGYITRQNWRV 239
MdEXP2 NFDIRRASLHFRLTG-NDGQQLTILNALPANWVAKRIYSSLTNFALVRRTTPERILVAAK 257
MdEXP3 GTNLANVNFSFRLTSGYYRESIVIPNAISGMYEPGVVLDTNVNFKLAAPRP VVLRGRK 282
AtEXPA1 NSYLNGQSLSFKVTT-SDGQTIVSNNVANAGWSFGQTFTEAVRERGMIVIWSFLSIEVNL 266
AtEXPB1 EG-PLKGPFSVKLTTLSNNKTLSATDVIPSNWVPKATYTSRLNFSPVL 271
. : .
MdEXP4
MdEXP1
MdEXP2 IPARRVPAVLGPSH 271
MdEXP3 IMEESTNATLLISE
296
AtEXPA1 KRSGASSA
274
AtEXPB1
C C C
W W W
W
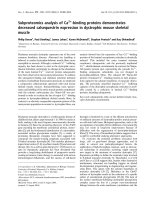
Figure 5 Alignment of the amino acid sequence of the Micrasterias denticulata expansin-resembling proteins Alignment of the amino
acid sequence of the M. denticulata expansin-resembling proteins MdEXP2, MdEXP1, MdEXP4, and MdEXP3 with the Arabidopsis thaliana EXPA1
[NP_001117573] and EXPB1 [NP_179668]. The C-terminal extension of MdEXP2 is omitted (see Additional file 11). Dark-shaded white characters
represent N-terminal sorting signals. Dark gray and white boxes below the alignment indicate the expansin domains 1 and 2, respectively.
Conserved Cys (C) and Trp (W) residues are indicated above the alignment. The key residues of the GH45 catalytic site that are conserved in
domain 1 of the EXPA and EXPB expansin families are shown in bold. Conserved expansin residues and motifs are lightly shaded. Asterisks mark
identical residues; colons and periods indicate full conservation of strong and weak groups, respectively.
Vannerum et al. BMC Plant Biology 2011, 11:128
/>Page 6 of 17
AtEXPA12
AtEXPA17
AtEXPA11
OsEXPA4
AtEXPA8
AtEXPA15
OsEXPA32
PpEXPA8
AtEXPA4
PpEXPA1
PpEXPA12
PpEXPA27
PpEXPA26
PpExpA6
AtEXPA13
AtEXPA22
AtEXPA7
Md3497
Md2820
Md3604
Md1418
GW600008
GW602842
GW602186
GW601561
GW600257
GW601930
AtEXPB2
OsEXPB15
AtEXPB3
OsEXPB16
PpEXPB1
PpEXPB2
AtEXLB1
AtEXLA2
AtEXLA1
DdEXPL2
DdEXPL1
DdEXPL6
DdEXPL5
DdEXPL3
68
100
78
99
100
100
60
86
82
70
94
100
99
100
80
86
99
99
100
0.2 subst/site
EXPA
Micrasteria
s
Spirogyra
EXPB
EXL
Dictyostelium (outgroup)
1.00
.97
1.00
1.00
.98
1.00
1.00
.94
1.00
1.00
1.00
1.00
1.00
1.00
1.00
1.00
1.00
1.00
1.00
.99
A
vascular plants
mosses
Micrasterias
Spirogyra
EXPA EXPB
Coleochaete
no expanins found in EST library
EXPA’
EXPA’’
EXPA
EXPB
Zygnematophyceae
Land plants
B
EXP (a)
EXPA (a)
EXPB/EXL (a)
EXPA (a)
EXPB/EXL (a)
EXPB
EXL
EXPB/EXL (a)
EXPA (a)
EXL
EXPB/EXL (a)
EXPA (a)
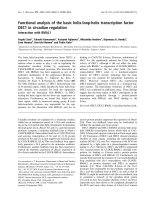
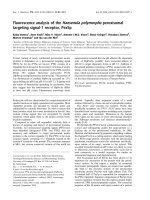
Figure 6 Maximum likelihood phylogeny of the plant expansin gene family (A) Maximum likelihood (ML) phylogeny of the plant expansin
gene family, showing the phylogenetic position of the Micrasterias and Spirogyra genes. Numbers at nodes indicate ML bootstrap values (top)
and Bayesian posterior probabilities (bottom); values below 50 and 0.9, respectively, are not shown. Dd, Dictyostelium discoideum (outgroup); Pp,
Physcomitrella patens; Os, Oryza sativa; At, Arabidopsis thaliana. (B) Possible events hypothetically explaining the distribution of expansin gene
families in land plants and Zygnematophyceae. The organismal tree is based on multigene phylogenetic analyses [5,6] and only includes taxa in
which expansins have been found, along with Coleochaete that apparently lacks expansins based on transcriptome analyses [27]. The dotted line
in the tree indicates phylogenetic uncertainty. “(a)” marks ancestral gene families, EXPA’ and EXPA’’ represent the EXPA-related genes found in
Micrasterias and Spirogyra respectively.
Vannerum et al. BMC Plant Biology 2011, 11:128
/>Page 7 of 17
the GxxCGxCF/Y motif in the same expansin domain 1
was fully conserved. A third motif characteristic for this
domain, the Y/F RRVPC motif, varied among the
MdEXPs (Table 1). The key residues of the GH45 cata-
lytic site, conserved among EXPA and EXPB proteins
(see Figure 5, indicated in b old), were absent. In land
plant expansins, the pollen-allergen domain contains
four conserved tryptophan residues that form part of
the hydrophobic core of this domain [42] (Figure 5). In
the MdEXPs up to two of these residues occurred and
were fully conserved, when the structurally related
amino acids phenylalanine and tyrosine are taken into
account (Figure 5, Table 1). Although the highly con-
served HATFYG motif near the N-terminus is charac-
teristic of EXPA proteins [22], this motif could not be
found in the MdEXPs. The EXPA and EXPB proteins
were distinguished by the presence or absence of short
stretches of amino acids at conserved positions at either
side of the HFDL motif in the GH45 active site (a-and
b-insertions) [16,43]. According to the phylogeny, the
MdEXPs contained an a-insertion characteristic of
EXPAs, but they lacked the four h ighly conserved N-
terminal residues ‘GWCN’ found in o ther EXPAs [16].
OftheHFDLmotif,onlytheleucineresiduewascon-
served (Figure 5). However, the long C-terminal exten-
sion of MdEXP2 was typical for EXLA proteins [22].
Although MdEXPs were heterogeneous and divergent,
they clearly shared several characteristics of the EXPA
protein domains, supporting our phylogenetic results.
Subcellular localization of the expansin-resembling
MdEXP2 and phenotypic changes due to its
overexpression
The ORF of the M. denticulata expansin-resembling
protein with the highest mRNA levels during cell
growth, namely MdEXP2, was cloned into an overe x-
pression vector to allow C-terminal fusions to the green
fluorescence protein (GFP) [35]. As observed by confo-
cal laser scanning microscopy of transiently MdEXP2-
GFP-overexpressing interphase cells, the MdEXP2-GFP
fluorescence occurred as motile cytoplasmic dots (Figure
8; Additional file 12) but could not be observed in the
secondary cell wall itself, probably because o f quenching
due to a low apoplast pH [44]. Therefore, MdEXP2-
Table 1 Characteristics (domains and motifs) of the Micrasterias denticulata expansin-resembling proteins
Characteristic MdEXP1 MdEXP2 MdEXP3 MdEXP4
Signal peptide 1-24 1-23 1-19 1-24
GH45 domain No 39-180 52-211 No
Eight conserved cysteines Yes Yes Yes Yes
GGACGY motif GGsCGY GGsCGf GGsCGY GGsCGY
GxxCGxCF/Y motif Yes Yes Yes Yes
Y/FRRVPC motif IYAVSC FTQVPC VTRVPC VYAAGC
Catalytic site key residues No 1 A 1 A No
DPBB_1 domain 51-132 56-136; 302-385 82-161 51-132
Pollen_allerg_1 domain 144-223 147-226 172-253 No
Four conserved tryptophan (W) residues (* structurally related residues) 2(W) 1(F*) 1(Y*) 2(W) 1(F*) 1(Y*) 2(W) 2(Y*) No
HATFYG motif (A) No No No No
a-insertion (A) Yes Yes Yes Yes
b-insertion (B) No No No No
HFDL motif (A, B) Only L Only L Only L Only L
CDRC motif (LA) No No No No
Long carboxy terminal extension (LA) No Yes No No
When a domain is present, its position is given (starting from the first methionine). A, unique characteristic of the EXPA family; B, unique characteristic of the
EXPB family; LA, unique characteristic of the EXLA famil y; LB, unique characteristic of the EXLB family
DPBB 1
DPBB 1
Pollen
allergen 1
1100
MdEXP4
MdEXP3
Pollen
allergen 1
DPBB 1
MdEXP1
Pollen
allergen 1
DPBB 1
Pollen
allergen 1
Pollen
allergen 1
DPBB 1DPBB 1
DPBB 1DPBB 1DPBB 1
DPBB 1
Pollen
allergen 1
DPBB 1DPBB 1
Pollen
allergen 1
Pollen
allergen 1
110011002001100
DPBB 1 DPBB 1
Pollen
allergen 1
MdEXP2
DPBB 1 DPBB 1
Pollen
allergen 1
DPBB 1 DPBB 1
Pollen
allergen 1
DPBB 1DPBB 1 DPBB 1DPBB 1
Pollen
allergen 1
Pollen
allergen 1
Figure 7 Schematic representation of the domains with
significant E-value in the Micrasterias denticulata expansin-
resembling proteins MdEXP2, MdEXP1, MdEXP4, and MdEXP3.
The black line indicates the signal peptide. DPBB1, a rare lipoprotein
A-like double-psi beta-barrel domain. The pollen allergen 1 domain
is similar to expansin domain 2. Scale gives length in amino acids.
Vannerum et al. BMC Plant Biology 2011, 11:128
/>Page 8 of 17
GFP-overexpressing interphase cells were processed for
transmission electron microscopy (TEM) and stained
with GFP antibodies and protein A-gold to invest igate
whether the MdEXP2-GFP protein localizes into the
secondary cell wall. Indeed, a positive signal was
observed in the secondary cell wall, albeit not abun-
dantly (Figure 9A,B), probably due to the instability of
the GFP protein in this acid compartment [44]. In addi-
tion, mucilage vesicles still attached to distal Golgi cis-
ternae (Figure 10A) and some released from the
dictyosome (Figure 10C,D) were stained. This immuno-
gold labelling indicated that the punctate pattern of the
GFP fluorescence (Figure 8A) could correspond to
Golgi-derived mucilage vesicles and that the fusion pro-
tein was directed to the wall via the endoplasmic reticu-
lum-Golgi secretory pathway. No staining was observed
in experiments for specificity control consisting of sec-
tions treated with protein A-gold alone (Figure 10B). In
control sections of transgenic cells produc ing the fre e
GFP, labelling occurred in the cytoplasm and was absent
from the cell wall and cell organelles (Figure 9C,D).
Next, 26 independent transient transgenic cells were iso-
lated and f urther analysed (Additional file 13). A group
of cells lost the GFP-fl uorescence within a few days and
divided, resulting in normal daughter cells, while the
majority of the cells died, possibly because of strong
MdEXP2 overexpression as indicated by their bright
GFP fluorescence. However, in eight independent cell
lines, a range of phenotypes related to MdEXP2 overex-
pression during cell division and growth could be
observed. Line 11 exhibited strong lobe elon gation with-
out loss of growth polarity after the first cell division
(Figure 8B). The lobes were stretched and rounded
instead of flattened at their tips. After the second cell
division of line 11 and in all other cases ( lines 6, 7, 8,
12, 13, 18, 19), the growth polarity was altered. Line 13
lost its planarity upon cell division and, thus, had the
most severe phenotype. New semicells, without the
characteristically lobed morphology, but almost without
indentations, grew o ut three-dimensionally. Upon a new
cell division of one of the daughter cells, the same phe-
notype was observed, whereas the newly formed semi-
cells were also fused with each other (Figure 8F-I). In
lines 6, 7, 8, 11 (from the second cell division onwards),
12, 18, and 19 axial but not radial elongation was
impaired, resulting in semicells with a stunted p olar
lobe and fused lateral lobes (Figure 8C-E). Sometimes,
the second division gave rise to a similar morphology
Figure 8 Phenotypes of Micrasterias denticulata cells transiently overexpressing MdEXP2-GFP observed by confocal fluorescence
microscopy. Merged transmission light and GFP fluorescence single optical sections (B-I) or projection (A). Initial semicells not formed under
MdEXP2-GFP overexpression marked by asterisk. (A) Undivided MdEXP2-GFP overexpressing cell. (B-I) Phenotypes of M. denticulata cells transiently
overexpressing MdEXP2-GFP arranged according to phenotype severity. (B) Cell line 11. Upper semicell formed after the first cell division,
exhibiting stimulated lobe elongation. The lobes are stretched and rounded instead of flattened at their tips. (C-E) Elongation growth is reduced,
lateral lobes are fused. (C) Cell line 6. Lower semicell formed after the second, upper semicell after the third cell division. (D) Cell line 7. Lower
semicell formed after the first, upper semicell after the second cell division. (E) Cell line 18. Upper semicell resulting from the first cell division,
after which the cell died. (F-I) Cell line 13. Loss of growth polarity and planarity upon cell division. (G, H) Other focal sections of (F) showing that
there are three growth planes instead of one. (I) Semicells fused upon the second cell division. Scale bar = 50 μm.
Vannerum et al. BMC Plant Biology 2011, 11:128
/>Page 9 of 17
(Figure 8D), but in most cases the phenotype was lost
over one to t wo subsequent generations (Figure 8C).
That all phenotypes still had the GFP signal and none
of the m resulted from control experiments with trans-
genic cells expressing only the GFP [35] suggests that
they were related to the expression of the transgene.
Discussion
Genome-wide expression anal ysis revealed a role for Rab
and SNARE cycles in membrane fusions and for AGP-like
proteins in cell pattern establishment. A GPs, differing in
composition from land plants, had recently been found to
be present in the growing primary cell wall of Micrasterias
Figure 9 Immunogold labelling with anti-GFP antibody of high pressure-freeze fixed Micrasterias denticulata interphase cells. (A) and
(B) Positive signal present in the secondary cell wall (arrows) and absent from the cytoplasm in MdEXP2-GFP-overexpressing cells. Detachment of
the wall from the cytoplasm is a preparation artefact. (C) and (D) Label present in the cytoplasm and absent from the cell wall in cells
overproducing the free GFP. (D) Inset of (C). SW, Secondary cell wall. Scale bar = 1 μm (A, B, D) and 2 μm (C).
Vannerum et al. BMC Plant Biology 2011, 11:128
/>Page 10 of 17
[13]. Our analysis further suggests an involvement of class-
III peroxidases, XTH and expansins in cell wall growth.
Class-III peroxidases had been considered absent in green
algae [45], although a (partial) mRNA occurred in the des-
mid Closterium [46]. Here, a full length algal class-III per-
oxidase is linked to cell growth. Furthermore, despite their
supposed lack of xyloglucans [47], XET activity was found
in the streptophyte Chara and the chlorophyte Ulva [48].
Recently, the (1®3, 1®4)-b-glucan (mixed linked glucan,
MLG) has been determined as the main constituent of the
secondary cell wall of Micrasterias [13] and in this study,
the first algal XTH was identified.
Figure 10 Immunogold labelli ng with anti-GF P antibody of hi gh pressure-freeze fi xed transiently MdEXP2-GFP-overexpressing
Micrasterias denticulata interphase cells. (A) No staining of dictyosomal cisternae, fine staining of vesicles attached to the dictyosome
(arrows). (B) Control staining with protein A-gold alone. No signal. SW, Secondary cell wall. (C, D) Staining of a mucilage vesicle released into the
cytoplasm. Arrows indicate the label. Scale bar = 1 μm.
Vannerum et al. BMC Plant Biology 2011, 11:128
/>Page 11 of 17
The green algae Valonia (Chlorophyta) and Nitella
(Streptophyta) exhibit acid-induced wall extension, but
this response is seemingly not mediated by proteins
[49,50]. Contrary to the assumption of a land plant spe-
cific mechanism [20], four genes with significant similar-
ity to expansins were up-regulated during cell growth of
Micrasterias, in agreement with a pre sumed ancient
evolutionary origin [16]. Based on significant BLAST
sim ilarities with the expansin domain s [22], global pair-
wise alignment and phylogeny, and structural features
like the presence of a secretion signal, MdEXP2,
MdEXP1, and MdEXP3 are considered expansins, but
considerably diverge in gene architecture from embryo-
phytic expansins, as indicated by both domain analysis
and phylogeny. These results add to the evidence that
expansins are not stro ngly conserved through e volution
[17]. The key residues of the GH45 domain catalytic site
and the HFDL motif, which are present in land plants
and Spirogyra, do not occur in Micrasterias.TheHFDL
motif is prese nt in mos t groups of plant expansins, but
is absent in a few plant E XPA and EXPB proteins [16].
The eight N-terminal cysteines required for protein
folding [16] and the four C-terminal tryptophans or
related residues inv olved in cellul ose binding [42] are
conserved between Micrasterias, Spirogyra and land
plants and can be considered as key characteristics of
plant expansins. The GGxCGY/F and the GxxCGxCF/Y
motifs in the GH45 domain are conserved as well. The
only constant difference in the conserved amino acid
residues in Micrasterias when compared to land plants
is the occurrence of a serine residue instead of an ala-
nine residue in the GGACGY motif of the GH45
domain. As expansins disrupt noncovalent bonding
between cellulose microfibrils and matrix glucans that
stick to the microfibril [18], we hypothesize that the
characteristics of the MdEXPs might be related to the
dominant MLG in the secondary cell walls of Micraster-
ias [13] instead of the (1®4)-b-glucan backbone present
in dicotyledonous plants. The occurrence of MLG in
lichens [51], fungi [52], green algae (Micrasterias )[13],
horsetails [53], and Poales [54] has been suggested to
result from convergent evolution [55], whereas the
occurrence of distinct MdEXPs might be connected to
two different (primary and secondary) cell wall types,
implied by their different temporal expression patterns.
Based on the present expansin phylogeny, combined
with current hypotheses on the evolution of the closest
relatives to land plants [6,56], expansins can fairly be
assumed to have evolved before the origin of land
plants. However, the unresolved relationships between
Embryophytes and the streptophyte lineages Zygnemato-
phyceae, Coleochaetophyceae and Charophyceae [57]
ham per a solid reconstruction of expansin gene history.
Assuming that t he Zygnematophyceae form the closest
living relatives to land plants [8], a possible scenario
would be that expansins evolved into two lineages
(EXPA and EXPB + EXL) i n a common ancestor of
Embryophytes and Zygnematophyceae (Figure 6B). The
apparent lack of EXPB and E XL in Micrasterias and
Spirogyra might be due to gene loss, early in the e volu-
tion of the Zygnematophyceae. It should be emphasized
however, that the ancient relationships among expansin
families are difficult to resolve. Therefore the phyloge-
netic positions of the green algal expansin-resembling
genes should be interpreted with care, hinting at a com-
plete divergence of the plant expansin families wit hin
the embryophytic lineage.
Distinct differences in gene architecture between
Micrasterias and embr yophytic expansins have raised
the question whether the biochemical functions of
MdEXPs and embryophytic expansins are similar. To
this end, we studied functionally MdEXP2,theMdEXP
with the highest expression levels during growth,
through localization and overexpression. A GFP anti-
body detecting the MdEXP2-GFP fusion protein was
used, because the sequence conservation was too low
for the available plant expansin antibodies. Unfortu-
nately, currently, because only transient genetic transfor-
mation of Micrasterias is possible [35], immunoelectron
microscopic detection in the growing cell walls is unfea-
sible. Nevertheless, the ectopically produced protein was
targeted to the fully-grown secondary cell wall. In addi-
tion, the phenotypic results obtained from its overex-
pression suggest that MdEXP2 can alter the cell wall
shape, but this effect on growth cannot be excluded to
result from saturation or bloc kage of the membrane
trafficking of other essential proteins. The phenotypes
were remarkably variable, whereby the phenotype sever-
ity did not seem to directly correlate with expansin
abundance (as in ferred from MdEXP2-GFP fluorescence
intensity), as reported previously [58-62]. Although a
phenotype could be observed corresponding to the
expected enhanced wall extensibility due to increased
expansin levels [19], the elongation growth impaired in
most cases, but not the lateral expansion, resulting in
the fusion of the lateral lobes. A number of factors
might explain the reduced growth of tomato (Solanum
lycopersicum) overexpressing an expansin [59]. All
together, the growth phase-specific expression, the accu-
mulation in the cell walls, and i ts overexpression pheno-
type, allow us to to hypothesize that MdEXP2 might
have a biochemical function related to that of land plant
expansins.
Conclusions
Our study provides novel data on gene expression dur-
ing morphogenesis and cell gr owth in the desmid
Micrasterias denticulata and adds to our understanding
Vannerum et al. BMC Plant Biology 2011, 11:128
/>Page 12 of 17
of the evolution of genes involved in cell wall formation
in green algae and land plants.
Cell walls have played crucial roles in the colonization
of land by plants [63,64]. For a detailed understanding
of how cell walls have evolved, cell wall components
and cell wall-related genes in land plants and their clo-
sest relatives, the streptophyte green algae need to be
analyzed comprehensive ly. Although some cell wall
components appear to be adaptations of land plants, cell
wall evolution after the colonization of land is seemingly
characterized by the elaboration of a pre -existing set of
genes and polysaccharides rather than by substantial
innovations [65-68]. The data add to the growing body
of evidence that the evoluti onary origins of many cell
wall components and regulating genes in embryophytes
antedate the colonization of land.
Methods
Culture conditions, synchronization and sampling
AclonalMicrasterias denticulata culture was grown in
twofold diluted Desmidiaceae medium [69] at 23°C and
120-140 μmol photons.m
-2
.s
-1
under a 14-h light/10-h
dark regime.
Two independent cultures were synchronized by repla-
cing the growth medium of a stationary culture, diluting
the density, and extending the light period to 24 h. Cells
were sampled from synchronized cultures for RNA
extraction at five consecutive time points during growth
(T1 to T5) that were chosen to include for each time
point a different proportion of cells at different morpho -
genetic stages (bulge, lobe, and doublet stage) (Figure 1C,
D). Two independent stationary cultures served as con-
trol samples. Cells were concentrated by centrifugation
for1minat4°Cand4000rpmandwashedwithphos-
phate buffered saline (PBS). Cell pellets were snap-frozen
in liquid nitrogen and stored at -70°C.
RNA extraction and cDNA-AFLP analysis
Total RNA was isolated from approximately 80,000 fro-
zen cells at each time point as described [70] with slight
modifications. Instead of b-mercaptoethanol, 2 M stock
solution of the anti-RNase agent dithiothreitol was
added to the extraction buffer to a final concentration
of 50 mM [71]. Cells were disrupted and homogenized
in a bead mill (Retsch) (5 min at frequency 30 s
-1
)with
silicone-carbide sharp particles (Biospec Products) after
the cell pellet had been thawed and suspended in the
extraction buffer. Phytopure resin (GE-Healthcare) was
added during the first chloroform:isoamylalcoho l extrac-
tion to eliminate mucilage contamination of the RNA
[72]. RNA samples were controlled qualitatively with the
RNA 6000 Nano kit of the Bioanalyze r 2100 (Agilent
Technologi es) and quantified with the ND-1000 UV-Vis
Spectrophotometer (Nanodrop).
Starting from 2 μ g of total RNA, cDNA synth esis and
cDNA -AFLP analysis with BstYI and MseI as restriction
enzymes were done according to the procedures as
described [28]. For the selective amplification, BstYI +
C/T + 1/MseI + 2 primer pairs were used, resulting in
128 primer combinations. The cDNA-AFLP fingerprints
were visualized with an autoradiography platform (Phos-
phorImager 445 SI; Molecular Dynamics).
Scanned gel images were quantitatively a nalyzed with
the AFLP-QuantarPro image analysis software (Keygene
N.V.). Expression values per gen e were normalized for
replicate effects by subtracti ng the replicate mean value
(Additional file 2). A verage linkage hierarchical cluster-
ing with the TMeV v4 software ()
and adaptive quality-based clustering (minimum two
tags in a cluster, 0.95 significance level) [73] of the nor-
malized expression data were carried out.
To assess the effect of the various cell division stages
(T1-T5) on the gene expression during synchronized
growth, a linear regression model of the form y = μ +
rep + time + ε was fitted to the data, where y represents
the raw expression value s, rep and time the fixed repli-
cate and time effects, respectively, and ε the random
error. For all TDFs, a F-statistic was calculated, P -values
were assigned to the main term time and subsequently
transformed into false discovery rates, and Q-values [74]
(Additional file 2). Besides the TDFs with a significant
(Q<0.05) differ ential expression across the five time
points, TDFs that were clearly absent in the stationary
cultures but present during the synchronized growth,
were excised from the dried gels, irrespective the signifi-
cance of their differential expression across the five
stages, followed by amplification and subsequent
sequencing [28].
The TDFs were designated by Md (for M. denticulata)
followed by a number corresponding to the AFLP frag-
ment. After mutual alignment of the sequences, only the
longest one of a group of identical sequences was
retained, except when the TDFs displayed different
expression profiles. Each sequence was identified by a
similarity search against the public databases with the
Blast2GO v1.7.2 program ()
[75]. In addition to hits displaying an E-value < 1.E-03,
hits with E-values between 1.E + 00 and 1.E-03 and a
similarity > 50% were retained for further analysis.
Real-time qRT-PCR assay
Primers (Additional fil e 14) were designed with the Bea-
con Designer 7.0 (PREMIER Biosoft International) and
the Oligo PerfectTM Designer (Invitrogen). Isolated
RNA was treated with DNaseI (GE-Healthcare). An ali-
quot of 1 μg of total RNA from each sample was used
for cDNA synt hesi s. The reverse tra nscr ipti on was c ar-
ried o ut with oligo-dT primers and the Sup erscriptTM
Vannerum et al. BMC Plant Biology 2011, 11:128
/>Page 13 of 17
II reverse transcriptase (Invitro gen) according to the
manufacturer’s instructions.
A s et of reference genes was selected, based on their
constitutive expression patter n during morphogenes is,
to serve as a normalization factor in quantitative
reverse-transcription-(qRT)-PCR analysis. Their expres-
sion stability (M) was analyzed with the geNormTM
program [76]. Among 10 constitutively expressed TDFs,
Md0789 (similar to a reticulon of Arabidopsis thaliana)
and Md1473 (similar to peroxiredoxin 6 of Norway rat
[Rattus norvegicus ]) (M value = 0.421 and 0.489, respec-
tively) were the two most stably expressed genes, fol-
lowed by Md0386 (similar to the unknown gene of A.
thaliana at5g13390 t22n19_4 0). To determine the num-
ber of internal control genes necessary for reliable data
normalization, the pairwise var iation value between two
sequential normalization factors V
2/3
was calculated
with geNormTM and turned out to be 0.151 under our
experimental conditions, slightly higher than the cut-off
value of 0.15. The inclusion o f a fourth internal control
gene resulted in an increa se of the pairw ise variation,
yielding a V
3/4
value of 0.129. As a result, the use of the
two or three most stably expressed genes was c onsid-
ered to be suffici ent for reliable data normalization [ 76].
PCR fragments were amplified in triplicate on the Light-
cyclerTM 480 (Roche Applied Science) platform with
SYBRTM Green QPCR Master Mix (Stratagene),
according to the manufacturer’ s instructions with
cycling conditions of 10 min preincubation at 95°C and
45 cycles at 95°C for 10 s, 58°C for 15 s, and 72°C for
15 s. Amplicon dissociation curves were recorded by
heating from 65°C to 95°C. qBaseTM [77] was used for
relative quantification.
RACE PCRs, protein domain identification, sequence
alignment and phylogenetic analyses
The ends of the cDNAs were obtained by rapid amplifi-
cation of cDNA ends (RACE) PCRs with plasmid DNA
from a cDNA library of growth-synchronized M. denti-
culata (purchased from Invitrogen) as template. For
MdEXP1, MdEXP3,andMd0434 only 5’ RACE PCR
was done, because the TDF contained the stopcodon
and a part of the 3’ untranslated region. For Md4341,
MdXTH1, MdEXP2,andMdEXP4 bo th 5’ RACE and 3’
RACE were necessary. Gene-specific primers were
designed with the eprimer3 program [78] and used in
combination with vector-specific (pDONR222.1) primers
(Additional file 15) in a PCR consisting of 1 min pre-
incubation at 95°C and 30 cycles at 95°C for 30 s, 54°C
for 30 s and 72°C for 2 min 30 s, followed by 1 cycle at
72°C for 5 min.
Protein domains in th e ORF sequences were identified
with the SMART tool ( bl-heidelberg.de/)
[79,80]. Signal sequences were confirmed with the
SignalP 3.0 Server ( />nalP) [81,82] and iPSORT prediction (.
jp/) [83].
Similar seque nces were retrieved from GenBank
(htt p://w ww.ncbi.nlm.nih.gov) using protein BLAST and
tblastx [84] (Additional file 16). The sequences were
ali gned using MUSCLE [85]. To remov e signal peptides
and C-terminal extensions, the alignmen t was trimmed
from a c onserved tryptophan near the N-term inus to a
conserved phenylalanine near the C-terminus [17].
Two sets of alignments were considered for the phylo-
genetic a nalyses. The first dataset consisted of the four
M. denticulata expansin-resembling proteins (MdEXPs),
26 land plant expansins representing the 17 orthologous
clades within the four land plant expan sin families [22],
and six EST sequences of the streptophyte green alga
Spirogyra prat ensis that showed significant similarity to
land plant expansins [27]. Five expansin-like sequences
of the social amoeba, Dictyostelium discoideum,were
selected as outgroup based on their inferred relationship
with land plant expansins [16,86]. This alignment was
227 amino acids long (Additional file 17). The second
dataset included all sequences of the first alignment plus
nine putative expansin genes found in four species of
Chlorophyta (the sister clade of the Streptophyta) (322
amino acids long; Additional file 18) and was used to
assess the phylogenetic position of other putative expan-
sin sequences of green algae.
Models of protein evolution were selected with Prot-
Test 1.4 [87]. Maximum likelihood (ML) and Bayesian
phylogenetic inference (BI) were analyzed under a WAG
model of amino acid substitution with among site rate
heterogeneity (gamma distribution with eight categories)
for all datasets with PhyML v2.4.4 [88] and non-para-
metric bootstrapping (1000 replicates) to assess statisti-
cal support of internal branches with MrBayes 3.1.2
[89], respectively. Two par alle l runs, ea ch consisting of
four incrementally heated chains were run f or 2 x10
6
generations, sampling every 1000 generations. Conver-
gence of log-likelihoods was assessed in Tracer v1.4
[90]. A burn-in sample of 500 trees (well beyond the
point at which convergence of parameter estimates had
taken place) was removed before the majority r ule con-
sensus trees were constructed.
Overexpression of MdEXP2 and microscopy
The ORF of MdEXP2 was cloned into the SpeIrestric-
tion site (
ACTAGT) of the vector pSA405A under the
control of the chlorophyll a/b-binding protein encoding
gene of the desmid Closterium and was C-terminally
fused to the green fluorescence protein gene (GFP) [35].
Primers were: forward primer 5’-ATG
ACTAGTAT-
GAAAATCGGCATAATCCA-3’ and reverse primer 5’-
GGA
ACTAGTTAGGCACCCATTAACGGC-3’ .The
Vannerum et al. BMC Plant Biology 2011, 11:128
/>Page 14 of 17
PCR was 2 min preincubation at 94°C and 5 cycl es at
94°C for 45 s , 45°C for 45 s, a nd 68°C for 3 min, fol-
lowed by 30 cycles at 94°C for 45 s, 55°C for 45 s, and
68°C for 2 min, and by 1 cycle at 72°C for 5 min. The
recombined plasmid was introduce d into M. denticulata
by microparticle bombardment [35].
For confoca l microscopy, a 100M microscope (Zeiss)
was used, equipped with the LSM510 software version
3.2. Sa mples were scanned with a 20x (numerical aper-
ture of 0.5) and a 63x water corrected objective (numer-
ical aperture of 1.2). GFP fluorescence was visualized
with argon laser illumination at 488 nm and a 500 to
530 nm band emission filter.
For transmission electron microscopy (TEM), a GFP
antibody (Rb, (ab6556) Abcam) compatible protocol was
followed to prepare the samples. MdEXP2-GFP-overex-
pressing M. denticulata cells were embedded in a yeast
paste in a me mbrane carrier (Lei ca) and frozen immedi-
ately in a high-pressure freezer (EM PACT; Leica
Microsystems). Freeze substitution was carried out in a
Leica EM AFS instrument. Samples were infiltrated at 4°
C stepwise in LR-W hite, hard grade (London Resin
Company Ltd.) and embedded in capsules. Ultrathin
sections of gol d inter ference color were cut with an EM
UC6 u ltrami crotome (Leica) and collected on formvar-
coated copper mesh grids. Grids were floated on block-
ing solution followed by incubation in a 1:25 and 1:10
dilution(in1%bovineserumalbumininPBS)ofpri-
mary antibodies (GFP antibody, (Rb , (ab6556) Abcam)
for 60 min. The grids were labelled with protein A-10-
nm gold (PAG10nm) (Cell Biology Department, Utrecht
University). Control experiments consisted of treating
sections with PAG10nm alone. Sections wer e post-
stained in an automatic contrasting instrument (EM
AC20; Leica Microsystems GmbH) for 30 min in uran yl
acetate at 20°C and for 7 min in lead stain at 20°C.
Grids were viewed with a 1010 transmission electron
microscope (JEOL) operating at 80 kV.
Newly obtained sequence data wer e deposited in Gen-
Bank; the transcript derived fragments under accession
numbers HE578289 to HE578716, the reference genes
under accession numbers HE580226 to HE580228, and
the open reading frames under accession numbers
HE578717 to HE578726.
Additional material
Additional file 1: Distribution of morphogenetic stages in the RNA
samples used for cDNA-AFLP, replication 2, and real-time qRT-PCR.
Additional file 2: Expression values of all scored TDFs.
Additional file 3: Similarities of cDNA-AFLP fragments to database
sequences.
Additional file 4: Raw real-time qRT-PCR expression values.
Additional file 5: Comparison of the expression profiles of selected
TDFs obtained by cDNA-AFLP and qRT-PCR for the samples of
replication 2.
Additional file 6: Full-length deduced amino acid sequence of
Md4341 aligned with its relevant BLAST hits.
Additional file 7: Full-length deduced amino acid sequence of
MdXTH1 (Md0888) aligned with its relevant BLAST hits.
Additional file 8: Full-length deduced amino acid sequence of
Md0434 aligned with its relevant BLAST hits.
Additional file 9: Characteristics of the expansin-resembling genes
from Micrasterias denticulata.
Additional file 10: Unrooted maximum likelihood phylogeny
showing the relationship of putative chlorophytan expansin
sequences (with significant similarity to plant expansins in tblastx
searches) with the plant expansin gene family.
Additional file 11: Protein BLAST alignment of MdEXP2 with its best
hit, showing the expansin-like C-terminal extension.
Additional file 12: Confocal GFP fluorescence time lapse images (30
s apart) illustrating the motility of the MdEXP2-GFP containing
intracellular compartments.
Additional file 13: Features of transgenic cell lines overexpressing
the MdEXP2-GFP fusion gene.
Additional file 14: Primer sequences of selected Micrasterias
denticulata TDFs used for real-time qRT-PCR assay.
Additional file 15: Primers used for RACE PCR and cloning.
Additional file 16: Accession numbers of the sequences used to
construct the phylogenetic trees and additional Physcomitrella
patens sequences.
Additional file 17: Nexus file with the MUSCLE alignment used in
this study for phylogenetic analyses of expansins.
Additional file 18: Nexus file of the MUSCLE alignment used in this
study for phylogenetic analyses of expansins including sequences
of the Chlorophyta.
Acknowledgements
The authors thank Debbie Rombaut and Sofie D’hondt for assistance with
the cDNA-AFLP analysis, Andy Vierstraete and Wilson Ardilez-Diaz for
sequencing, Filip Waumans for constructing a database for the sequences
identified in this study, Klaas Vandepoele for help with bioinformatics,
Mansour Karimi for cloning advice, Ellen Cocquyt for phylogenetic advice,
Daniel Cosgrove for nomenclatural advice, and Martine De Cock for help in
preparing the manuscript. This work was supported by the Interuniversity
Attraction Poles Programme (UIAP VI/33), initiated by the Belgian State,
Science Policy Office, the Research Foundation-Flanders (postdoctoral
fellowship grants to F.L. and L. D.V.), and the Agency for Innovation by
Science and Technol ogy in Flanders ("Strategisch Basisonderzoek” project
SBO040093 and predoctoral fellowships to K.V., M.J.J.H., and J.G.).
Author details
1
Laboratory of Protistology and Aquatic Ecology, Department of Biology,
Ghent University, 9000 Gent, Belgium.
2
Department of Plant Systems Biology,
VIB, 9052 Gent, Belgium.
3
Department of Plant Biotechnology and
Bioinformatics, Ghent University, 9052 Gent, Belgium.
4
Phycology Research
Group, Department of Biology, Ghent University, 9000 Gent, Belgium.
5
Plant
Physiology Division, Cell Biology Department, University of Salzburg, 5020
Salzburg, Austria.
Authors’ contributions
KV carried out the molecular genetic studies and drafted the manuscript.
MJJH participated in the real-time qRT-PCR assay and genetic transformation.
RDR carried out the immunoelectron microscopy. MV designed the cDNA
AFLP study and performed the statistical analyses. FL carried out the
phylogenetic analysis. JP and AG participated in the RACE PCRs. UL-M
Vannerum et al. BMC Plant Biology 2011, 11:128
/>Page 15 of 17
participated in the synchronization and RNA-extraction and in the
interpretation of the data. JG and LDV participated in the design of the
experiments. DI and WV conceived and supervised the study. WV, FL, LDV
and MH helped to draft the manuscript. All authors read and approved the
final manuscript.
Received: 5 May 2011 Accepted: 25 September 2011
Published: 25 September 2011
References
1. Dupuy L, Mackenzie J, Haseloff J: Coordination of plant cell division and
expansion in a simple morphogenetic system. Proc Natl Acad Sci USA
2010, 107:2711-2716.
2. Yang Z, Fu Y: ROP/RAC GTPase signaling. Curr Opin Plant Biol 2007,
10:490-494.
3. Kryvych S, Nikiforova V, Herzog M, Perezza D, Fisahn J: Gene expression
profiling of the different stages of Arabidopsis thaliana trichome
development on the single cell level. Plant Physiol Biochem 2008, 46:160-173.
4. Karol KG, McCourt RM, Cimino MT, Delwiche CF: The closest living
relatives of land plants. Science 2001, 294:2351-2353.
5. Turmel M, Pombert JF, Charlebois P, Otis C, Lemieux C: The green algal
ancestry of land plants as revealed by the chloroplast genome. Int J
Plant Sci 2007, 168:679-689.
6. Rodríguez-Ezpeleta N, Philippe H, Brinkmann H, Becker B, Melkonian M:
Phylogenetic analyses of nuclear, mitochondrial, and plastid multigene
data sets support the placement of Mesostigma in the Streptophyta. Mol
Biol Evol 2007, 24:723-731.
7. Finet C, Timme RE, Delwiche CF, Marlétaz F: Multigene phylogeny of the
green lineage reveals the origin and diversification of land plants. Curr
Biol 2010, 20:2217-2222.
8. Wodniok S, Brinkmann H, Glockner G, Heidel A, et al: Origin of land plants:
Do conjugating green algae hold the key? BMC Evol Biol 2011, 11:104.
9. Meindl U: Micrasterias cells as a model system for research on
morphogenesis. Microbiol Rev 1993, 57:415-433.
10. Lütz-Meindl U, Brosch-Salomon S: Cell wall secretion in the green alga
Micrasterias. J Microsc 2000, 198:208-217.
11. Eder M, Lütz-Meindl U: Pectin-like carbohydrates in the green alga
Micrasterias characterized by cytochemi cal analysis and energy filtering
TEM. J Microsc 2008, 231:201-214.
12. Giddings TH Jr, Brower DL, Staehelin LA: Visualization of particle
complexes in the plasma membrane of Micrasterias denticulata
associated with the formation of cellulose fibrils in primary and
secondary cell walls. J Cell Biol 1980, 84:327-339.
13. Eder M, Tenhaken R, Driouich A, Lütz-Meindl U: Occurrence and
characterization of arabinogalactan-like proteins and hemicelluloses in
Micrasterias (Streptophyta). J
Phycol 2008, 44:1221-1234.
14. Kim NH, Herth W, Vuong R, Chanzy H: The cellulose system in the cell
wall of Micrasterias. J Struct Biol 1996, 117:195-203.
15. Nakashima J, Heathman A, Brown RM Jr: Antibodies against a Gossypium
hirsutum recombinant cellulose synthase (Ces A) specifically label
cellulose synthase in Micrasterias denticulata. Cellulose 2006, 13:181-190.
16. Li Y, Darley CP, Ongaro V, Fleming A, Schipper O, Baldauf SL, McQueen-
Mason SJ: Plant expansins are a complex multigene family with an
ancient evolutionary origin. Plant Physiol 2002, 128:854-864.
17. Carey RE, Cosgrove DJ: Portrait of the expansin superfamily in
Physcomitrella patens: comparisons with angiosperm expansins. Ann Bot
2007, 99:1131-1141.
18. McQueen-Mason S, Durachko DM, Cosgrove DJ: Two endogenous proteins
that induce cell wall extension in plants. Plant Cell 1992, 4:1425-1433.
19. McQueen-Mason SJ, Cosgrove DJ: Expansin mode of action on cell walls:
Analysis of wall hydrolysis, stress relaxation, and binding. Plant Physiol
1995, 107:87-100.
20. Cosgrove DJ: Expansive growth of plant cell walls. Plant Physiol Biochem
2000, 38:109-124.
21. Cosgrove DJ: Loosening of plant cell walls by expansins. Nature 2000,
407:321-326.
22. Sampedro J, Cosgrove DJ: The expansin superfamily. Genome Biol 2005,
6:242.
23. Pien S, Wyrzykowska J, McQueen-Mason S, Smart C, Fleming A: Local
expression of expansin induces the entire process of leaf development
and modifies leaf shape. Proc Natl Acad Sci USA 2001, 98:11812-11817.
24. Cho HT, Cosgrove DJ: Regulation of root hair initiation and expansin
gene expression in Arabidopsis. Plant Cell 2002, 14:3237-3253.
25. Link BM, Cosgrove DJ: Acid-growth response and α-expansins in suspension
cultures of Bright Yellow 2 tobacco. Plant Physiol 1998, 118:907-916.
26. Wang CX, Wang L, McQueen-Mason SJ, Pritchard J, Thomas CR: pH and
expansin action on single suspension-cultured tomato (Lycopersicon
esculentum)
cells. J Plant Res 2008, 121:527-534.
27. Timme RE, Delwiche CF: Uncovering the evolutionary origin of plant
molecular processes: comparison of Coleochaete (Coleochaetales) and
Spirogyra (Zygnematales) transcriptomes. BMC Plant Biol 2010, 10 :96.
28. Vuylsteke M, Peleman JD, van Eijk MJT: AFLP-based transcript profiling
(cDNA-AFLP) for genome-wide expression analysis. Nat Protocols 2007,
2:1399-1413.
29. Milioni D, Sado PE, Stacey NJ, Roberts K, McCann MC: Early gene
expression associated with the commitment and differentiation of a
plant tracheary element is revealed by cDNA-amplified fragment length
polymorphism analysis. Plant Cell 2002, 14:2813-2824.
30. Breyne P, Dreesen R, Cannoot B, Rombaut D, Vandepoele K, Rombauts S,
Vanderhaeghen R, Inzé D, Zabeau M: Quantitative cDNA-AFLP analysis for
genome-wide expression studies. Mol Genet Genomics 2003, 269:173-179.
31. Schwartz SL, Cao C, Pylypenko O, Rak A, Wandinger-Ness A: Rab GTPases
at a glance. J Cell Sci 2007, 120:3905-3910, [Err. J Cell Sci 121, 246 2008)].
32. Kallio P, Heikkilä H: On the effect of elimination of nuclear control in
Micrasterias. In Plant Cells. Edited by: Bonotto S, Goutier R, Kirchmann K,
Maisin JR. New York, Academic Press; 1972:167-192.
33. Takos AM, Dry IB, Soole KL: Detection of glycosyl-phosphatidylinositol-
anchored proteins on the surface of Nicotiana tabacum protoplasts. FEBS
Lett 1997, 405:1-4.
34. Zheng H, Rowland O, Kunst L: Disruptions of the Arabidopsis enoyl-CoA
reductase gene reveal an essential role for very-long-chain fatty acid
synthesis in cell expansion during plant morphogenesis. Plant Cell 2005,
17:1467-1481.
35. Vannerum K, Abe J, Sekimoto H, Inzé D, Vyverman W: Intracellular
localization of an endogenous cellulose synthase of Micrasterias
denticulata (Demidiales, Chlorophyta) by means of transient genetic
transformation. J Phycol 2010, 46:839-845.
36. Oertel A, Aichinger N, Hochreiter R, Thalhamer J, Lütz-Meindl U: Analysis of
mucilage secretion and excretion in Micrasterias (Chlorophyta) by means
of immunoelectron microscopy and digital time lapse video microscopy.
J Phycol 2004, 40:711-720.
37. Henrissat B, Coutinho PM, Davies GJ: A census of carbohydrate-active
enzymes in the genome of Arabidopsis thaliana. Plant Mol Biol 2001,
47:55-72.
38.
Nishitani K: The role of endoxyloglucan transferase in the organization of
plant cell walls. Int Rev Cytol 1997, 173:157-206.
39. Shakin-Eshleman SH, Spitalnik SL, Kasturi L: The amino acid at the X
position of an Asn-X-Ser sequon is an important determinant of N-
linked core-glycosylation efficiency. J Biol Chem 1996, 271:6363-6366.
40. Passardi F, Longet D, Penel C, Dunand C: The class III peroxidase
multigenic family in rice and its evolution in land plants. Phytochemistry
2004, 65:1879-1893.
41. Brook AJ: The Biology of Desmids. Oxford, Blackwell Scientific; 1981,
Botanical Monographs, Vol. 16
42. Toone EJ: Structure and energetics of protein-carbohydrate complexes.
Curr Opin Struct Biol 1994, 4:719-728.
43. Wu Y, Meeley RB, Cosgrove DJ: Analysis and expression of the α-expansin
and β-expansin gene families in maize. Plant Physiol 2001, 126:222-232.
44. Ward WW: Biochemical and physical properties of green fluorescent
protein. In Green Fluorescent Protein: Properties, Applications and Protocols.
Edited by: Chalfie M, Kain SR. New York, Wiley; 2005:39-66, Methods of
Biochemical Analysis, Vol. 47.
45. Passardi F, Penel C, Dunand C: Performing the paradoxical: how plant
peroxidases modify the cell wall. Trends Plant Sci 2004, 9:534-540.
46. Sekimoto H, Tanabe Y, Takizawa M, Ito N, Fukumoto Rh, Ito M: Expressed
sequence tags from the Closterium peracerosum-strigosum-littorale
complex, a unicellular charophycean alga, in the sexual reproduction
process. DNA Res 2003, 10:147-153.
47. Popper ZA, Fry SC: Primary cell wall composition of bryophytes and
charophytes. Ann Bot 2003, 91 :1-12.
48. Van Sandt VST, Stieperaere H, Guisez Y, Verbelen JP, Vissenberg K: XET
activity is found near sites of growth and cell elongation in bryophytes
Vannerum et al. BMC Plant Biology 2011, 11:128
/>Page 16 of 17
and some green algae: new insights into the evolution of primary cell
wall elongation. Ann Bot 2007, 99:39-51.
49. Taiz L: Plant cell expansion regulation of cell wall mechanical properties.
Annu Rev Plant Physiol 1984, 35:585-657.
50. Tepfer M, Cleland RE: A comparison of acid-induced cell wall loosening in
Valonia ventricosa and in oat coleoptiles. Plant Physiol 1979, 63:898-902.
51. Olafsdottir ES, Ingólfsdottir K: Polysaccharides from lichens: structural
characteristics and biological activity. Planta Med 2001, 67:199-208.
52. Pettolino F, Sasaki I, Turbic A, Wilson SM, Bacic A, Hrmova M, Fincher GB:
Hyphal cell walls from the plant pathogen Rhynchosporium secalis
contain (1,3/1,6)-β-D-glucans, galacto- and rhamnomannans, (1,3;1,4)-β-
D-glucans and chitin. FEBS J 2009, 276:3698-3709.
53. Fry SC, Nesselrode BHWA, Miller JG, Mewburn BR: Mixed-linkage (1→3,1→4)-
β-D-glucan is a major hemicellulose of Equisetum (horsetail) cell walls.
New Phytol 2008, 179:104-115.
54. Trethewey JAK, Campbell LM, Harris PJ: (1℮3),(1→4)-β-D-glucans in the cell
walls of the Poales (sensu lato): an immunogold labeling study using a
monoclonal antibody. Am J Bot 2005, 92:1660-1674.
55. Popper ZA, Tuohy MG: Beyond the green: understanding the
evolutionary puzzle of plant and algal cell walls. Plant Physiol 2010,
153:373-383.
56. Lemieux C, Otis C, Turmel M: A clade uniting the green algae Mesostigma
viride and Chlorokybus atmophyticus represents the deepest branch of
the Streptophyta in chloroplast genome-based phylogenies. BMC Biol
2007, 5:2.
57. Leliaert F, Verbruggen H, Zechman FW: Into the deep: new discoveries at
the base of the green plant phylogeny. BioEssays 2011, 33:683-692.
58. Caderas D, Muster M, Vogler H, Mandel T, Rose JKC, McQueen-Mason S,
Kuhlemeier C: Limited correlation between expansin gene expression
and elongation growth rate. Plant Physiol 2000, 123
:1399-1413.
59. Rochange SF, Wenzel CL, McQueen-Mason SJ: Impaired growth in
transgenic plants over-expressing an expansin isoform. Plant Mol Biol
2001, 46:581-589.
60. Lee Y, Kende H: Expression of β-expansins is correlated with internodal
elongation in deepwater rice. Plant Physiol 2001, 127:645-654.
61. Choi D, Lee Y, Cho HT, Kende H: Regulation of expansin gene expression
affects growth and development in transgenic rice plants. Plant Cell
2003, 15:1386-1398.
62. Obembe OO, Jacobsen E, Visser R, Vincken JP: Expression of an expansin
carbohydrate-binding module affects xylem and phloem formation. Afr J
Biotechnol 2007, 6:1608-1616.
63. Kenrick P, Crane PR: The origin and early evolution of plants on land.
Nature 1997, 389:33-39.
64. Graham LE, Cook ME, Busse JS: The origin of plants: body plan changes
contributing to a major evolutionary radiation. Proc Natl Acad Sci USA
2000, 97:4535-4540.
65. Popper ZA, Tuohy MG: Beyond the green: Understanding the
evolutionary puzzle of plant and algal cell walls. Plant Physiol 2010,
153:73-383.
66. Sørensen I, Domozych D, Willats WGT: How have plant cell walls evolved?
Plant Physiol 2010, 153:366-372.
67. Popper ZA, Michel G, Hervé C, Domozych DS, Willats WGT, Tuohy MG,
Kloareg B, Stengel DB: Evolution and diversity of plant cell walls: From
algae to flowering plants. Annu Rev Plant Biol 2011, 62:567-590.
68. Sørensen I, Pettolino FA, Bacic A, Ralph J, Lu F, O’Neill MA, Fei Z, Rose JKC,
Domozych DS, Willats WGT: The Charophycean green algae provide
insights into the early origins of plant cell walls. The Plant Journal 2011.
69. Schlösser UG: Sammlung von Algenkulturen. Ber Dtsch Bot Ges 1982,
95:181-276.
70. Chang S, Puryear J, Cairney J: A simple and efficient method for isolating
RNA from pine trees. Plant Mol Biol Rep 1993, 11:113-116.
71. Pearson G, Lago-Leston A, Valente M, Serrão E: Simple and rapid RNA
extraction from freeze-dried tissue of brown algae and seagrasses. Eur J
Phycol 2006, 41:97-104.
72. Kiefer E, Heller W, Ernst D: A simple and efficient protocol for isolation of
functional RNA from plant tissues rich in secondary metabolites. Plant
Mol Biol Rep 2000,
18:33-39.
73. De Smet F, Mathys J, Marchal K, Thijs G, De Moor B, Moreau Y: Adaptive
quality-based clustering of gene expression profiles. Bioinformatics 2002,
18:735-746.
74. Storey JD, Tibshirani R: Statistical significance for genome wide studies.
Proc Natl Acad Sci USA 2003, 100:9440-9445.
75. Conesa A, Götz S, García-Gómez JM, Terol J, Talón M, Robles M: Blast2GO: a
universal tool for annotation, visualization and analysis in functional
genomics research. Bioinformatics 2005, 21 :3674-3676.
76. Vandesompele J, De Preter K, Pattyn F, Poppe B, Van Roy N, De Paepe A,
Speleman F: Accurate normalization of real-time quantitative RT-PCR
data by geometric averaging of multiple internal control genes. Genome
Biol 2002, 3, research 0034.1-0034.11.
77. Hellemans J, Mortier G, De Paepe A, Speleman F, Vandesompele J: qBase
relative quantification framework and software for management and
automated analysis of real-time quantitative PCR data. Genome Biol 2007,
8:R19.1-R19.14.
78. Rice P, Longden I, Bleasby A: EMBOSS: the European Molecular Biology
Open Software Suite. Trends Genet 2000, 16:276-277.
79. Schultz J, Milpetz F, Bork P, Ponting CP: SMART, a simple modular
architecture research tool: identification of signaling domains. Proc Natl
Acad Sci USA 1998, 95:5857-5864.
80. Letunic I, Doerks T, Bork P: SMART 6: recent updates and new
developments. Nucleic Acids Res 2009, 37:D229-D232.
81. Nielsen H, Engelbrecht J, Brunak S, von Heijne G: Identification of
prokaryotic and eukaryotic signal peptides and prediction of their
cleavage sites. Protein Eng 1997, 10:1-6.
82. Bendtsen JD, Nielsen H, von Heijne G, Brunak S: Improved prediction of
signal peptides: SignalP 3.0. J Mol Biol 2004, 340 :783-795.
83. Bannai H, Tamada Y, Maruyama O, Nakai K, Miyano S: Extensive feature
detection of N-terminal protein sorting signals. Bioinformatics 2002,
18:298-305.
84. Altschul SF, Madden TL, Schäffer AA, Zhang J, Zhang Z, Miller W,
Lipman DJ: Gapped BLAST and PSI-BLAST: a new generation of protein
database search programs. Nucleic Acids Res 1997, 25:3389-3402.
85. Edgar RC: MUSCLE: multiple sequence alignment with high accuracy and
high throughput. Nucleic Acids Res 2004, 32:1792-1797.
86. Ogasawara S, Shimada N, Kawata T: Role of an expansin-like molecule in
Dictyostelium morphogenesis and regulation of its gene expression by
the signal transducer and activator of transcription protein dd-STATa.
Dev Growth Differ 2009, 51:109-122.
87. Abascal F, Zardoya R, Posada D: ProtTest: selection of best-fit models of
protein evolution. Bioinformatics 2005, 21:2104-2105.
88. Guindon S, Gascuel O: A simple, fast, and accurate algorithm to estimate
large phylogenies by maximum likelihood. Syst Biol 2003, 52:696-704.
89. Ronquist F, Huelsenbeck JP: MrBayes 3: Bayesian phylogenetic inference
under mixed models. Bioinformatics 2003, 19:1572-1574.
90. Rambaut A, Drummond AJ: Tracer v1.4. 2007 [ />doi:10.1186/1471-2229-11-128
Cite this article as: Vannerum et al.: Transcriptional analysis of cell
growth and morphogenesis in the unicellular green alga Micrasterias
(Streptophyta), with emphasis on the role of expansin. BMC Plant Biology
2011 11:128.
Submit your next manuscript to BioMed Central
and take full advantage of:
• Convenient online submission
• Thorough peer review
• No space constraints or color figure charges
• Immediate publication on acceptance
• Inclusion in PubMed, CAS, Scopus and Google Scholar
• Research which is freely available for redistribution
Submit your manuscript at
www.biomedcentral.com/submit
Vannerum et al. BMC Plant Biology 2011, 11:128
/>Page 17 of 17