báo cáo khoa học: " Mapping QTLs for oil traits and eQTLs for oleosin genes in jatropha" ppsx
Bạn đang xem bản rút gọn của tài liệu. Xem và tải ngay bản đầy đủ của tài liệu tại đây (2.63 MB, 9 trang )
RESEARCH ARTICLE Open Access
Mapping QTLs for oil traits and eQTLs for oleosin
genes in jatropha
Peng Liu, Chun Ming Wang
*
, Lei Li, Fei Sun, Peng Liu and Gen Hua Yue
*
Abstract
Background: The major fatty acids in seed oil of jatropha, a biofuel crop, are palmitic acid (C16:0), stearic acid
(C18:0), oleic acid (C18:1) and linoleic acid (C18:2). High oleic acid and total oil content are desirable for jatropha
breeding. Until now, little was known about the genetic bases of these oil traits in jatropha. In this study,
quantitative trait locus (QTL) and expression QTL analyses were applied to identify genetic factors that are relevant
to seed oil traits in jatropha.
Results: Composite interval mapping identified 18 QTL underlying the oil traits. A highly significant QTL qC18:1-1
was detected at one end of linkage group (LG) 1 with logarithm of the odd (LOD) 18.4 and percentage of variance
explained (PVE) 36.0%. Interestingly, the QTL qC18:1-1 overlapped with qC18:2-1, controlling oleic acid and linoleic
acid compositions. Among the significant QTL controlling total oil content, qOilC-4 was mapped on LG4 a relatively
high significant level with LOD 5.0 and PVE 11.1%. Meanwhile, oleosins are the major composition in oil body
affecting oil traits; we therefore developed SNP markers in three oleosin genes OleI, OleII and OleIII, which were
mapped onto the linkage map. OleI and OleIII were mapped on LG5, closing to QTLs controlling oleic acid and
stearic acid. We further determined the expressions of OleI, OleII and OleIII in mature seeds from the QTL mapping
population, and detected expression QTLs (eQTLs) of the three genes on LGs 5, 6 and 8 respectively. The eQTL of
OleIII, qOleIII-5, was detected on LG5 with PVE 11.7% and overlapped with QTLs controlling stearic acid and oleic
acid, implying a cis- or trans-element for the OleIII affecting fatty acid compositions.
Conclusion: We identified 18 QTLs underlying the oil traits and 3 eQTLs of the oleosin acid genes. The QTLs and
eQTLs, especially qC18:1-1, qOilC-4 and qOleIII-5 with contribution rates (R
2
) higher than 10%, controlling oleic acid,
total oil content and oleosin gene expression respectively, will provide indispensable data for initiating molecular
breeding to improve seed oil traits in jatropha, the key crop for biodiesel production.
Background
Jatropha curcas is becoming one of the world’ skey
crops for biodiesel production [1]. Oil containing a high
amount of unsaturated fatty acid can find an application
as biodiesel feed stock. To make the production of jatro-
pha profitable and sustainable, genetic improvement of
oil yield and quality is demanded. However, oil traits
cannot be evaluated until the seeds are harvested and
analyzed in laboratory, and detailed selective breeding
has not been carried out. Meanwhile molecular breeding
in jatropha has not been started due to lack of molecu-
lar bases of economically important traits such as seed
yield, seed oil traits, biotic or abiotic stress resistance.
Most economically important traits are quantitative
and determined by many genes and gene complex
where are described a s quantitative trait loci (QTLs).
Traditional methods of genetic improvement of quanti-
tative traits have relied mainly on phenotype and pedi-
gree information [2], which are easily influenced by
environmenta l fac tors. To co nduct marker assisted
selection (MAS) for genetic improvement of oil yield
and quality in jatropha, the molecular b ases of seed oil
traits need to be understood by identifying genomic
regions that contain favorite loci, i.e. QTL analysis. QTL
analysis has been performed to detect the genetic bases
of important agronomic or physiological traits, providing
valuable information for trait improvement. Genetic
markers have made it possible to detect QTLs that are
significantly associated with traits, and made selection
* Correspondence: ;
Molecular Population Genetics Group, Temasek Life Sciences Laboratory, 1
Research Link, National University of Singapore, 117604 Singapore
Liu et al. BMC Plant Biology 2011, 11:132
/>© 2 011 Liu et al; licensee BioMed Central Ltd. This is an Open Access article distributed under the terms of the Creative Commons
Attribution License (http://creativecom mons.org/licenses/by/2.0), which permits unrestricted use, distribution, and reproduction in
any medium, provided the original work is properly cited.
more effective [3]. Genetic response can be improved by
including the QTLs in marker-assisted selection, which
is a method of selection that m akes use of phenotypic,
genotypic and pedigree data [4]. Moreover, MAS for oil
traits improvement will be much advantageous com-
pared to traditional bre eding because seed oil traits can-
notbemeasuredatearlystageorinfield.Theuseof
DNA markers for selection in jatropha can greatly
reduce breeding scale. By using MAS, decisions can be
made at the nursery stage, regarding which individuals
should be retained as breeding stock, and which should
be removed.
To conduct QTL analysis, most appropriate crosses
need to be selected to genera te sufficient genetic v aria-
tions both on DNA and phenotype levels. QTL analyses
of total oil content h ave been made in a number of
crops, including oilseed rape[5], soybean[6], maize[7],
and sunflower[8]. Recent surveys have shown large var-
iations in content and fatty acid composition of seed oil
of Arabidopsis, suggesting populations derived from
selected crosses will be useful for investigating these
traits [9].
Diversity in gene expression is one of the mechanisms
underlying phenotypic diversity among individuals and
regarded as one of quantitative traits [10]. Analysis of
determinants of candidate gene expression not only
helps in understanding the mechanisms for phenotypic
variation but also provides an approach to improve phe-
notypes via the modulation of gene expression[10]. With
advances in gene expression profiling, an approach
named “genetical genomics” has been put forward to
identify the determinants of gene expression [11]. This
approach treats mRNA expression levels as quantitative
traits in a segregating population and maps expression
QTL (eQTL) that c ontrol expression levels in vivo. For
almost any g ene analyzed i n a segregating population,
eQTL analysis can identify the genomic regions influen-
cing its expression level. eQTL t hat map to the same
genetic location as the gene whose transcript is being
measured generally indicate the presence of a cis-acting
regulatory polymorphism in the gene (cis-eQTL). eQTL
that map distant to the location of the gene being
assayed most likely identify the location of trans-acting
regulat ors (trans-eQTL) that may control the expression
of a number of genes elsewhere in the genome. The
genetical genomics approach has been employed for
identifying eQTL regulating gene expression [10,12].
Recently, we established a first generation genetic link-
age map of jatropha using 506 microsatellite and S NP
markers covering 11 linkage groups [13], thus providing
a necessary tool for a whole genome scan for QTLs and
eQTLs affecting economically important traits including
seed oil traits. Among the fatty acid present in the jatro-
pha seed oil, linoleic acid (18:2), oleic acid (18:1),
palmi tic acid (16:0) and stearic acid (18:0) are dominant
compositions. O leic and linoleic acids are the major
constituents of jatropha oil [14]. The breeding goal for
jatropha seed oil trait improvement is to increase total
oil co ntent and oleic acid, and decrease palmitic content
[15]. In this paper, we describe the genetic bases of
these seed fatty acid c omposition and content traits
through QTL mapping w ith a backcrossing population
consisting 286 individuals. On the other hand, seed oil
is stored in subcellular organelles called oil bodies. Pro-
teome composition of the jatropha oil bodies revealed
oleosins as the major component affecting oil traits [16].
Threejatrophaoleosingenes,namelyOleI, OleII and
OleIII, were isolated [17]. Here, we developed SNPs of
the three oleosin genes in the QTL mapping population,
which were subsequently ma pped onto the linkage map.
We determined expr ession variations of the three genes
in the QTL mapping population, conducted an eQTL
analysis on oleosin gene expressions and provided new
information for possible modulation of oleosin genes to
improve oil traits in jatropha.
Results
Trait analysis
Fatty acid composition, total oil content of jatropha
seeds and gene expression levels of oleosin genes were
measured in the QTL mapping population. The fre-
quency distributions of the traits showed a continuous
distribution (data not show n), revealing complex genetic
bases of these traits. As expected for an interspecific
cross, distribution of phenotypic values in the progeny
showed bi-directional transgressive segregations for all
traits (Table 1). C18:1 in J. curcas is higher than in J.
integerrima, while total oil content in J. integerrima is
51.04%, much higher than in J. curcas. The data implied
that J. integerrima germplasm could be applied for
hybrid breeding to improve agronomic traits such as
total oil content.
Correlation analysis among these traits was per-
formed (Table 2). C18:2 showed a significantly negative
correlation with C18:1 and C16:0. Especially the C18:1
correlated with C18:2 wit h a high coefficient -0.962,
implying that there could be common genetic factors
affecting these two compositions. The expression levels
of OleI, OleII and OleIII showed a highly positive cor-
relation with each other. OleI expression level was sig-
nificantly correlated with C16:0. The correlation
coefficients between expression levels of oleosin genes
and total oil content were low but significant. The sig-
nificant but low values of correlation coefficients
implied genetic bases of fatty acid composition and
total oil content were complex, and oleosin genes
could be involved the multiple genetic factors affecting
these oil traits.
Liu et al. BMC Plant Biology 2011, 11:132
/>Page 2 of 9
QTL and eQTL mapping
The linkage map, covering 663.0 cM of the genome,
converged into 11 linkage grou ps consisting of 95 DNA
markers. The average distance between markers was 7.0
cM. Most of the linkage groups were consistent with
those described previously [13].
QTL analyses were performed on the means of fatty
acid composition, total oil content and expression levels
of OleI, OleII and OleIII (Tab le 3; Fi gure 1). We
detected 18 QTLs and 3 eQTLs for all traits examined.
Indiv idual eQTL or QTL were detected with percentage
of variation explained (PVE or r
2
)2.3%to36.0%,and5
of them had PVE exceedin g 10%. QTLs or e QTLs with
positive and negative allelic effects were identified, with
a positive effect implying a higher value for the trait
conferred by the allele from PZM16 and vice versa (Fig-
ure 2).
QTLs for fatty acid composition and total oil content
Eighteen QTL s were identified dispersed among all the
linkage groups except LGs 3 and 11. A QTL of highly
significant effect was determined to be located on LG1
explaining 36% of variation of C18:1 composition, a nd
was found to be associated with C18:2 compositions
(Figure 2). Interestingly, another QTL on LG10
explained 5.9% o f variation of C18:1 composition was
also associated with C18:2 compositions. Higher values
for C18:1 were conferred by the allele from PZM16,
while higher values for C18:2 from Hybrid CI7041.
Four QTLs were detected underlying total oil content.
At the three QTLs on LGs 1, 2 and 4 respectively, the
alleles from hybrid CI7041 contributed high total oil
content. The most effective QTL was spotted on LG4
explaining 11.1% of the variation, whose higher value for
total oil content was conferred by the allele from hybrid
CI7041.
Favorite allele’s effects
There were strong QTLs for C18:1 and total oil content
detected on LGs 1 and 4, respectiv ely. Mean phenotypic
values of each trait were calculated for those progeny
with the alternate alleles of the microsatellite markers,
inherited from the J. integerrima (aa) or J. curcas (AA).
A two-way ANOVA w as performed on the progen y
using two allelic combinations (AA, Aa) from markers
linked to QTLs in order to investigate associations
between phenotypic traits and genotypes of the QTLs.
The phenotype values o f each allelic combination of the
QTLs are listed in Figure 3. Significant differences of
phenotype means among different allelic combinations
were identified, revealing the effects of alternative alleles
inherited from the parents.
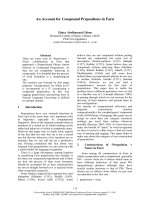
Progenies with AA genotype at the marker Jcuint057
located in qC18:1- 1, showed the higher C18:1 content
(43.0%) than Aa (30.9%). By contrast, progeny w ith Aa
genotype at the marker Jatr872 located in qOilC-4,
showed the higher total o il content (38.0%) than AA
(33.7%) (Figure 3). These results suggested the effect of
Table 1 Descriptive statistics on phenotype data of the QTL mapping population and parents (J.curcas PZM16 and J.
integerrima S001)
Traits Mean SD Min Max PZM16(Mean ± SD) S001(Mean ± SD)
C16:0 (%) 12.6 2.54 7.95 21.51 18.88 ± 5.7 7.89 ± 0.25
C18:0 (%) 6.28 1.44 2.89 10.42 6.02 ± 1.01 5.13 ± 0.31
C18:1 (%) 37.72 9.41 18.44 61.77 42.42 ± 0.54 30.83 ± 3.64
C18:2 (%) 43.39 9.96 20.57 66.22 32.7 ± 5.23 56.14 ± 3.58
Total oil content (%) 35.4 8 13.3 57.1 30.59 ± 0.70 51.04 ± 2.39
OleI expression (ΔΔC
T
) -0.32 3.63 -9.89 8.97 0 -0.42
OleII expression (ΔΔC
T
) 2.13 3.78 -6.03 11.33 0 2.54
OleIII expression (ΔΔC
T
) -3.4 4.05 -12.1 3.63 0 0.98
Table 2 Correlation coefficients and significance of correlations among fatty acid composition, total oil content,
oleosin gene expressions in a jatropha QTL mapping population
Traits C16:0 C18:0 C18:1 C18:2 Total oil content OleI expression OleII expression
C18:0 -0.147
C18:1 0.038 0.05
C18:2 -0.270** -0.155 -0.962**
Total oil content -0.087 -0.02 -0.003 0.028
OleI expression 0.216** -0.029 -0.013 -0.038 0.161*
OleII expression 0.139 -0.047 -0.074 0.043 0.191* 0.696**
OleIII expression 0.132 -0.005 0.136 -0.157 0.170* 0.790** 0.697**
P values are as follows: * P < 0.05, ** P < 0.01.
Liu et al. BMC Plant Biology 2011, 11:132
/>Page 3 of 9
thetwoQTLsareoppositeonthesetwokeyoiltraits
and favorite alleles were differentially from J. curcas and
J. integerrima.
eQTLs for oleosin genes
SNP markers were developed in OleI, OleII and OleIII
genes (Table 4), which were mapped on LGs 5, 3 and 5
respectively (Figure 2).
OleI and OleIII were mapped on LG5 where the QTLs
qC18:0-5, qC18:1-5 and qOleIII underlying C18:0, C18:1
and OleIII expression clustered. Negative additive effect
value of qOleIII-5 indicat ed that J. curcas alleles were
positive for OleIII ex pressions, of which LOD score was
3.1. This eQTL of OleIII was l ocalized near OleIII gene
and overlapped with t he QTLs controlling C18:0 and
C18:1, revealing a cis- or trans-element for OleIII which
subsequently controlling the C18:0 and C18:1.
One eQTL on LG8 qOleI-8 was detected underlying
OleI expression with LOD 1.9 (Table 3; Figures 1 and
2). Additive effect value of qOleI-8 was positive, indicat-
ing that J. integerrima alleles were positive for Ol eI
expressions. To find as many putative QTLs (eQTLs) as
possible, and to obtain a clearer understanding of the
relationships among examined traits, a threshold e QTL
of 1.9 for d eclaring a suggestive eQTL was employed.
Low thresholds may not be useful in plant breeding pro-
grams but they have been shown to help in understand-
ing relationships among traits [18].
OleII was located on LG3. One eQTL for OleII was
detected on LG6 with LOD 2.6, which closed to qC18:0-
6. It is suggested that a trans-element for OleII could
harbor in this region which co ntrolling the C18:0. Addi-
tive effect values indicated that J. curcas alleles were
negative, indicating that the effect of J. curcas alleles was
positive for OleII expressions.
Discussion
Development of inter-specific populations
To broaden the ge netic diversity of cultivated crops and
to identify QTLs associated with beneficial traits, such
as yield, grain quality and disease resistance, develop-
ment of inter-specific populations is a feasible strategy
[19]. We d eveloped around 500 SSR markers in jatro-
pha, but very low polymorphism was detected within J.
Table 3 QTLs for seed oil traits and eQTLs for OleI, OleII and OleIII expressions in jatropha
Trait QTL
a
Linkage Marker Position
b
LOD R
2c
Additive
(eQTL) Group cM Peak
(%)
Effects
d
C16:0 (%) qC16:0-2 2 Jcuint143 47.4 2.6 0.1 1.36
qC16:0-7 7 Jatr802 52.1 3.1 7.4 1.42
qC16:0-9 9 Jatr859 15 2.6 7.2 1.39
C18:0 (%) qC18:0-2 2 curcin2 52.6 2.6 5.3 -0.69
qC18:0-5 5 Jatr746 37.3 6.9 13 1.15
qC18:0-6 6 Jcuint036 64 3.9 7.1 -0.84
qC18:0-7 7 Jatr883 40.3 2.3 4 0.59
qC18:0-9 9 Jatr859 0 9.2 17.9 1.26
C18:1 (%) qC18:1-1 1 Jcuint057 0 18.4 36 11.69
qC18:1-5 5 Jatr739 45.1 2.3 3.4 -3.77
qC18:1-10 10 Jcuint180 15.2 4 5.9 4.75
C18:2 (%) qC18:2-1 1 Jcuint057 0 16.5 34.1 -12.07
qC18:2-6 6 Jatr301 15 2.4 3.8 4.3
qC18:2-10 10 Jcuint180 15.2 3 4.6 -4.4
Total oil content (%) qOilC-1 1 Jatr722 55.1 2.3 4.6 -3.72
qOilC-2 2 Jcuint143 47.4 2.5 4.9 -3.74
qOilC-4 4 Jatr872 29.6 5 11.1 -5.56
qOilC-9 9 Jatr698 18.6 2.5 5.2 3.74
OleI expression (ΔΔC
T
) qOleI-8 8 Jcuint277 58.2 1.9 5.3 1.71
OleII expression (ΔΔC
T
) qOleII-6 6 Jatr152 93.4 2.6 6.4 -2.38
OleIII expression (ΔΔC
T
) qOleIII-5 5 Jatr739 46.2 3.1 11.7 -3.06
a
QTL (eQTL): starting with “q,” followed by an abbreviation of the trait name, the name of the linkage group, and the number of QTLs (eQTLs) affecting the trait
on the linkage group. OleI, OleI expression level; OleII, OleII expression level; C16:0, C18:0,18:1 and C18:2, fatty acid compositions of palmitic acid (C16:0), stearic
acid (C18:0), oleic acid (C18:1) and Linoleic acid (C18:2); OilC: Total oil content
b
Position from the first marker on each linkage group.
c
Proportion of phenotypic variance (R
2
) explained by a QTL (eQTL).
d
Estimated phenotypic effect of substituting J. integerrima alleles with J. curcas alleles at QTL (eQTL).
Liu et al. BMC Plant Biology 2011, 11:132
/>Page 4 of 9
curcas, indicating the genetic variation was very limited
within J. curcas.Thereby,wesuccessfulconstructeda
QTL/eQTL mapping popula tion by crossing J. curcas to
J. integerrima and generating a backcrossing population,
and observed enhanced genetic diversity on DNA, RNA
and phenotype levels, which was the prerequisite for
QTL and eQTL detection.
For oil trait improvement, t he interspecific hybridiza-
tion approach is also viewed as a viable method to intro-
gress the traits of interest, i.e. namely more liquid olein
in oil palm [ 20]. With MAS, selection can be carried
out in segregating generations of interspecific hybrids
and their backcrosses more discriminately using molecu-
lar markers linked to the specific fatty acids. We investi-
gated effects of the QTLs on oil traits and found that
favorite alleles were originated from not only J. curcas
but also J. integerrima. C18:1 in J. curcas was higher
than in J. integerrima, while total oil content in J. inte-
gerrima was 51. 04%, mu ch high er than in J. curcas
(Table 1). Consistent to this result, qC18:1-1 and qOilC-
4, controlling C18:1 and total oil content respectively,
were detecte d with the favorite alleles origina ted from J.
curcas and J. integerrima respectively. Therefore, the
QTL mapping population will be very useful for trans-
ferring favorite alleles form the two parents by further
backcrossing and marker assisted selection.
Various germplasms were successfully utilized for
development of chromosome segm ent substitution lines
for studies on pest and disease resistance an d other
agronomic triats in rice [21-23]. Here we generated
backcross populations for map construction and QTL
mapping, which required less time to be developed and
being ‘ immortal’ for future QTL mapping due to jatro-
pha’s perennial life cycle. Meanwhile, the specific adva n-
tage of backcross populations is t hat, the populations
can be further utilized to develop chromosome segment
substitution lines for marker-assisted backcross breed-
ing. The chromosome segment substitution lines will
provide a valuable tool for jatropha germplasm enhance-
ment, and can be expected to reveal the genetic basis of
traits specific to the donor J. integerrima.
Linkage or pleiotropic effect of genes in QTL cluster
Several chromosomal regions were associated with more
than two tra its indicating either linkage or pleiotropic
effect. We detected a QTL cluster controlling C18:1 and
C18:2 contents on the same region, i.e. closed to marker
Jcuint057 on LG1 and Jcuint180 on LG10 with the addi-
tive value of C18:1 oppo site to that of C18:2. This could
explain the strong negative correlation between C18:1
and C18:2 (Table 2), which was consistent to the fact
that linoleic acid is desaturated from oleic acid. Espe-
cially on LG1, the QTL was detected with a highly sig-
nificant effect, accounting for 36.0% of the variation. It
is revealed that either certain genes coexisted in these
QTLs or a certain gene with pleiotropic effect in fatty
acid metabolism pathway by modulating both C18:1 and
C18:2 c onten ts simultaneously. It will be meaningf ul to
conduct fine mapping of these QTLs, isolate the target
genes, and understand whether linkage or pleiotropic
effect. The QTL regions were still distant to the flanking
markers with linkage distance larger than 2 cM. Fine
mapped QTL will speed up genetic improvement
through MAS [3]. Construction of a high-resolution
gen etic linkage map of jatropha is underway, which will
lay a solid foundation for a variety of future genetic and
genomic studies, i ncluding QTL fine mapping and mar-
ker assisted selection.
eQTL analysis of oleosin genes
To examine the function and modulation of oleosin
genes in jatropha, we determined the expression levels
of OleI, OleII and OleIII in the QTL mapping popula-
tion, and conducted analysis with an approach named
“genetical genomics” for identifying the genomic regions
influencing gene expression [12,24] . The correlation of a
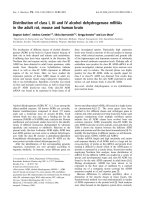
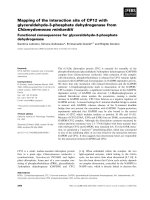
Figure 1 Whole genome scan for QTL for oil traits and Oleosin
gene expression in jatropha. A QTL scans of oil traits on linkage
maps. Horizontal line indicates 5% LOD significance thresholds (2.5)
based on permutation. B QTL scans of OleI, OleII and OleIII
expressions on linkage maps. Horizontal line indicates LOD
significance threshold (2.0).
Liu et al. BMC Plant Biology 2011, 11:132
/>Page 5 of 9
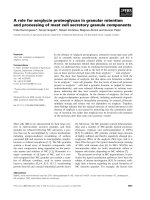
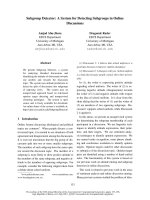
Figure 2 Summary of QTL (eQTL) locations detected on the genome of jatropha. QTLs (eQTLs) represented by bars are shown on the left
of the linkage groups, close to their corresponding markers. The lengths of the bars are proportional to the confidence intervals of the
corresponding QTLs (eQTLs) in which the inner line indicates position of maximum LOD score.
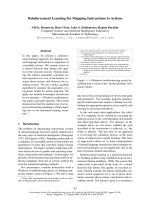
Figure 3 C18:1 composition (left) and total oil content (right) of plants with different genotypes. Favorite alleles for C18:1 composition
are AA from J. curcas, and those for total oil content are Aa from hybrid of J. integerrima and J. curcas (right).
Liu et al. BMC Plant Biology 2011, 11:132
/>Page 6 of 9
structural gene’s map position and its eQTL provides an
indication of its reg ulation [24]. If the positi on of one
gene and its eQTL are congruent, cis-regulation could
be inf erred, which means that the allelic polymorphism
of the gene i tself, or closely linked regulatory elements,
directly impact the gene’s expression. In this study, the
eQTL for oleosin genes do not colocalize with these
gene. This result suggests thattheobserveddifferences
in oleosin gene expressions could be the consequences
of trans-regulation, which means that gene expression is
mainly regulated by trans-acting factors. A similar phe-
nomenon has been observed for a set of genes involved
in the biosynthesis of lignin in Eucalyptus. Most of
these genes were significantly influenced by two eQTLs
on LGs 4 and 9, whereas the structural genes were dis-
tributed throughout the entire genome [25].
The significant but low correlations were observed
between oil traits and the expressions of oleosin genes.
Similar phenomenon was reported by Yin et al [10].
They reported that the significant correlation between
the expression of both GmRCAa and GmRCAb and
Rubisco initial activity, photosynthetic rate, and seed
yield indicated that these genes could play a role in
incr easing photosynthetic capacity and seed yield. How-
ever, the correlation coefficients between gene expres-
sion and Rubisco initial activity, photosynthetic rate, and
seed yield were relatively small. This was also reflected
by the fact that no coincident QTL (eQTL) was found
between gene expression levels and the other three
traits. Thus, they concluded that factors other than
GmRCAa and GmRCAb limited photosynthetic capacity
and seed yield. In our study, significant but low correla-
tions between oil traits and the expressions of oleosin
genes indicated that these genes could affect fa tty acid
composition and content; meanwhile, there should be
other complex factors together with oleosin genes affect-
ing oil traits.
The three eQTLs will provide possible approaches to
oil trait improvement beyond previous QTL mapping
results. Interestingly, OleIII gene, eQTL of OleIII
qOleIII-5 and QTL of qC18:0-5 and qC 18:1-5 were cl us-
tered on the same region on LG5. To furt her address
whether a cis- or trans-element for OleIII harbored on
LG5 subsequently controls the fatty acid compositions,
fine mapping the two loci is still needed. Only eQTL of
OleIII was coincident with QTL for oil composition, this
result could be resulted from function differentiation of
oleosin genes.
Conclusions
In conclusion, we identified 18 QTLs underlying the oil
traits and 3 eQTLs of the oleosin acid genes. Among
them, qC18:1-1, qOilC-4 and qOleIII -5, controlling oleic
acid, total oil content and oleosin gene expression
respecti vely, were detec ted with relatively high contribu-
tion rates (R
2
) and could be expected to be applied in
MAS by integrating mo re markers i n these region.
These data represents the first successful d etection of
QTLs/eQTLs underlying key agronomic traits in
jatropha.
Methods
Plant material and plant growth conditions
J. curcas PZM16 was crossed to J. integerima S001 and
hybrids CI7041 were generated. Then a backcrossing
(BC) population was constructed con sisting 286 indivi-
duals derived from the backcross PZM16 × CI7041. The
population and parental lines were planted under stan-
dard growth conditions in experimental field of Lim
Chu Kang farm, Singapore.
Isolation of genomic DNA and synthesis of cDNA
Total DNA from leaves was extracted and purified using
the DNeasy plant mini kit (QIAGEN, Germany). Oil
bodies are located inside the cells of mature seeds. Total
oil content and fatty acid composition in mature seeds
are agronomic traits of importance. To investigate
expressions of oleosin genes in mature seeds which are
used for oil extraction, total RNA was isolated from
mature seeds using plant RNA purification reagent
(Invitrogen). Poly(A) tails were then added to the 3’ end
of the RNAs by poly(A) polymerase (Ambion), and the
polyadenylated RNAs were reverse transcribed by Super-
Script II reverse transcriptase (Invitrogen) with the olig o
(dT) 3’-RACE adaptor (Ambion).
Trait measurement and data collection
Each sample of QTL mapping population was grinded
with liquid nitro gen, divi ded into 3 copies. Every sample
consists of 3 mature seeds collected randomly from the
same tree. Fatty acid compositions w ere analyzed by
Gas chromatography (GC). Total lipid, extracted from
100 mg mature seeds, was transmethylated with 3 N
methanolic-HCl (Sigma, St. Louis, MO, USA) plus 400
μL 2,2,-dimethoxypropane (Sigma, St. L ouis, MO, USA).
Oil was extracted using solvent (hexane) extraction fol-
lowed by esterification to transfer from oil to methyl
ester. The fatty acid methyl esters (FAME) was anal yzed
by GC using GC Agilent 6890 (Palo Alto, CA, USA)
employing helium as the carrier gas and DB-23 columns
for components separation. The GC analytical method
was performed at 140°C for 50 s and a 30°C min
-1
ramp
to 240 °C, and the final temperature was maintained for
50sforatotalruntimeof32min.FAcomposition
value included in the analyses was calculated based on
peak area.
To amplify the mRNA from the reverse transcribed
cDNAs and determine expression levels, real-time PCR
Liu et al. BMC Plant Biology 2011, 11:132
/>Page 7 of 9
was conducted with Real-Time PCR machine (I-Cycle,
BioRad). Each reactio n contained 2 00 ng of first-strand
cDNAs, 0.5 μL of 10 mmol L
-1
gene-specific primers, and
12.5 μL of real-time PCR SYBR MIX (iQ™ SYBR
®
Green
Supermix, Bio-Rad). Amplification conditions were 95°C
for 5 min followed by 40 cycles of 95°C for 15 s and 60°C
for 60 s. The jatropha 18S rRNA was selected as the
endogenous reference was used as a control to test for
sample-to-sample variation in the amount of cDNA.
cDNA from mature seeds of jatropha PZM16 was used
as the calibrator on each real-time PCR plate. Two tech-
nical replicates of each reaction were performed. Nor-
malized expression for each line was calculated as
described in [10], i.e . ΔΔC
T
=(C
T, Target
-C
T, 18S
)
genotype
-(C
T, Target -
C
T, 18S
)
calibrator
.LowerΔΔC
T
value means
stronger gene expression and vice versa. Five mature
seeds from each plant of QTL mapping population were
used to determine the r elative expression levels of OleI,
OleII and OleIII. The results presented are means of the
biological replicates for each plant.
DNA markers and genotyping
Ninety-five markers almost eve nly covering the 11 LGs
were selected from a first-generation linkage map of
jatropha [13]. One primer of each pair was labeled
with FAM or HEX fluorescent dyes at the 5’ end. The
PCR program for microsatellite amplifications on PTC-
100 PCR machines (MJ Research, CA, USA) consisted
of the following steps: 94°C for 2 min followed by 37
cycles of 94°C for 30 s, 55°C for 30 s and 72°C for 45
s, then a final step of 72°C for 5 min. Each PCR reac-
tion consisted of 1× PCR buffer (Finnzymes, Espoo,
Finland) with 1.5 mM MgCl
2
, 200 n M of each PCR
primer, 50 μM of each dNTP, 10 ng ge nomic DNA
and one unit of DNA-polymerase (Finnzymes, Espoo,
Finland). Products were analyzed using a DNA sequen-
cer ABI3730xl, and fragment sizes were determined
against the size standard ROX-500 (Applied Biosys-
tems, CA, USA) with software GeneMapper V3.5
(Applied Biosystems, CA, USA) as described previously
[26].
Statistical analysis and QTL (eQTL) mapping
QTL (eQTL) analysis allows the genetic basis of variation
of quantitative traits of inter est to be dissected . S cori ng
every individual of a mapping populatio n fo r the trait of
interest and establishing a genetic linkage map for that
pop ulation are two pr erequisites f or QTL (eQTL) det ec-
tion. In this study, expression level data of fatty acid com-
position and content, and OleI, OleII an d OleIII expression
levels of the backcross population consisting of 286 indivi-
duals were collected with 3 replications. Pearson phenoty-
pic correlations among traits were calculated by SAS
PROC CORR. The 95 markers were genotyped in the
QTL mapping population. SNP ma rkers for mappi ng the
three genes and primer pairs for determining expression
levels by real-time PCR were listed in Table 4.
Linkage map was constructed using the software
CRIMAP 3.0 to detect linkage and build map [27]. All
multipoint distances were calculated using the Kosambi
function. MapChart 2.2 software was used for graphical
visualization of the linkage groups [28]. QTL (eQTL)
analysis was performed using QTL Cartographer version
2.5 [29]. Model 6 of composite interval mapping was
deployed for mapping QTLs (eQTLs) and estimating
the ir effects. The genome was scanned at 2 cM interv als,
and the forward regression method was se lected. The log
of the odds (LOD) score for declaring a significant QTL
(eQTL) by permutation test analyses (1,000 permuta-
tions, 5% overall error level) as described previously. To
find as many putative QTLs (eQTLs) as possible, and to
obtain a clearer understanding of the relationships
among examined traits, a threshold eQTL analysis of
oleosin genes in of 2.0 for declaring a QTL (eQTL) was
employed. Low thresholds may not b e useful in plant
breeding programs but they have been shown to help in
understanding relationships among traits [18].
The maximum LOD score along the interval was
taken as the position of the QTL (eQTL), and the region
in the LOD score wit hin 1 LO D unit of maximum was
taken as the confidence interval. Additive effects of QTL
(eQTL) detected were estimated from composite interval
mapping results as the mean effect of replacing hybrid
Table 4 SNP markers and real time PCR primer pairs for OleI, OleII and OleIII genes
Gene Forward primer (5’-3’)
Reverse primer (5’-3’)
PCR product length
(bp)
For SNP or Real time PCR use
OleI CATTGCGCTAGCTGTTGCGACTCC 207 SNP and Real time PCR
CGCCGCTTTGCCATTTCCATCT
OleII GGGGCTATGGGGCTCACAG 313 SNP and Real time PCR
GTTGAGTTGGTTTATGGGGGATCT
OleIII ACAGCCACGATCCCACCAAGTAGT 443 SNP
GGACAGAGCTGAGCAGTTTGGACA
OleIII TGGTGCCGACGGTTATCAC 216 Real time PCR
TACATGCTGTCCAAACTGCTCAG
Liu et al. BMC Plant Biology 2011, 11:132
/>Page 8 of 9
(CI7041)’ s alleles at the locus of interest by J. curcas
(PZM16) al leles. Thus, at a QTL (eQTL) having a posi-
tive effect, the alleles of J. curcas will increase the trait
value. The contribution of each identified QTL (eQTL)
to total phenotypic variance (r
2
) was estimated by var-
iance component analysis. QTL (eQTL) nomenclature
was a dapted as following: starting with “q,” followed by
an abbreviation of the trait name, the name of the link-
age group and the number of QTL (eQTL) affecting the
trait on the linkage group.
In order to investigate associations between phenotypic
traits and genotypes of two QTLs on LGs 1 and 4, mean
phenotypic values of traits were calculated for those pro-
geny with the alternate alleles of the microsatellite mar-
kers, inherited from the J. integerrima (aa), alleles
inherited from the J. curcas (AA). A two-way ANOVA
was performed on the progeny using two allelic combina-
tions (AA, Aa) from markers linked to QTLs. This was
conducted by using the general linear model (GLM) pro-
cedure of SAS (SAS Institute) and the Bonferroni method
of multiple comparisons with a < 0.01.
Acknowledgements
The work is part of the project “Genetic Improvement of Jatropha” initiated
and coordinated by Professor Nam-Hai Chua. We thank Drs Hong Yan and
Yi Chengxin from JOIL Pte, for providing the plant material J. integerrima in
mapping population construction. We thank Dr Bu Yunping for her help in
GC analysis. We also thank our sequencing facility for helping DNA
sequencing and genotyping. This project is financially supported by JOIL Pte
Limited and the internal fund of the Temasek Life Sciences Laboratory,
Singapore.
Authors’ contributions
PL and CMW performed the experiments for collecting genotype and
phenotype data. CMW designed the experiments, analyzed the data and
drafted the manuscript. GHY supervised the project on jatropha molecular
breeding and revised the manuscript. LL measured the oil traits; FS extracted
DNA and RNA of the QTL mapping population; FS and PL participated in
laboratory and field work for data collection. All authors read and approved
the final manuscript.
Received: 14 June 2011 Accepted: 29 September 2011
Published: 29 September 2011
References
1. Chikara J, Jaworsky G: The little shrub that could–maybe. Nature 2007,
449:652-655.
2. Falconer DS, Mackay TFC, Frankham R: Introduction to Quantitative
Genetics. Trends in Genetics , 4 1996, 12(7):280.
3. Wang CM, Bai ZY, He XP, Lin G, Xia JH, Sun F, Lo LC, Feng F, Zhu ZY,
Yue GH: A high-resolution linkage map for comparative genome analysis
and QTL fine mapping in Asian seabass, Lates calcarifer. BMC Genomics
2011, 12(1):174.
4. Varshney RK, Tuberosa R: Genomics-assisted Crop Improvement:
Genomics applications in crops. Springer; 20072.
5. Burns M, Barnes S, Bowman J, Clarke M, Werner C, Kearsey M: QTL analysis
of an intervarietal set of substitution lines in Brassica napus:(i) Seed oil
content and fatty acid composition. Heredity 2003, 90(1):39-48.
6. Csanadi G, Vollmann J, Stift G, Lelley T: Seed quality QTLs identified in a
molecular map of early maturing soybean. TAG Theoretical and Applied
Genetics 2001, 103(6):912-919.
7. Alrefai R, Berke T, Rocheford T: Quantitative trait locus analysis of fatty
acid concentrations in maize. Genome 1995, 38(5):894-901.
8. Leon AJ, Andrade FH, Lee M: Genetic analysis of seed-oil concentration
across generations and environments in sunflower. Crop Sci 2003,
43:135-140.
9. O’Neill C, Gill S, Hobbs D, Morgan C, Bancroft I: Natural variation for seed
oil composition in Arabidopsis thaliana. Phytochemistry 2003,
64(6):1077-1090.
10. Yin Z, Meng F, Song H, Wang X, Xu X, Yu D: Expression quantitative trait
loci analysis of two genes encoding rubisco activase in soybean. Plant
Physiol 2010, 152(3):1625.
11. Jansen R, Nap J: Genetical genomics: the added value from segregation.
Trends Genet 2001, 17(7):388-391.
12. Sladek R, Hudson TJ: Elucidating cis-and trans-regulatory variation using
genetical genomics. Trends Genet 2006, 22(5):245-250.
13. Wang CM, Liu P, Yi C, Gu K, Sun F, Li L, Lo LC, Liu X, Feng F, Lin G: A first
generation microsatellite-and SNP-based linkage map of jatropha. PloS
one 2011, 6(8):e23632.
14. Costa GGL, Cardoso KC, Del Bem LEV, Lima AC, Cunha MAS, de Campos-
Leite L, Vicentini R, Papes F, Moreira RC, Yunes JA: Transcriptome analysis
of the oil-rich seed of the bioenergy crop Jatropha curcas L. BMC
genomics
2010, 11(1):462.
15. Chhetri AB, Tango MS, Budge SM, Watts KC, Islam MR: Non-edible plant
oils as new sources for biodiesel production. International Journal of
Molecular Sciences 2008, 9(2):169-180.
16. Popluechai S, Froissard M, Jolivet P, Breviario D, Gatehouse AMR,
O’Donnell AG, Chardot T, Kohli A: Jatropha curcas oil body proteome and
oleosins: L-form JcOle3 as a potential phylogenetic marker. Plant Physiol
Biochem 2010.
17. Popluechai S: Molecular characterisation of Jatropha Curcas: towards an
understanding of its potential as a non-edible oilseed-based source of
biodiesel. 2010.
18. Thumma BR, Naidu BP, Chandra A, Cameron DF, Bahnisch LM, Liu C:
Identification of causal relationships among traits related to drought
resistance in Stylosanthes scabra using QTL analysis. J Exp Bot 2001,
52(355):203.
19. Tanksley SD, McCouch SR: Seed banks and molecular maps: unlocking
genetic potential from the wild. Science 1997, 277(5329):1063.
20. Singh R, Tan SG, Panandam JM, Rahman RA, Ooi LCL, Low ETL, Sharma M,
Jansen J, Cheah SC: Mapping quantitative trait loci(QTLs) for fatty acid
composition in an interspecific cross of oil palm. BMC Plant Biol 2009,
9(1):114.
21. Wang CM, Su CC, Zhai HQ, Wan JM: Identification of QTLs underlying
resistance to a virulent strain of Xanthomonas oryzae pv. oryzae in rice
cultivar DV85. Field Crops Res 2005, 91(23):337-343.
22. Yasui H, Yamagata Y, Yoshimura A: Development of chromosome
segment substitution lines derived from indica rice donor cultivars DV85
and ARC10313 in the genetic background of japonica cultivar Taichung
65. Breeding Science 2010, 60(5):620-628.
23. Wang CM, Yasui H, Yoshimura A, Zhai H, Wan J: Inheritance and QTL
mapping of antibiosis to green leafhopper in rice. Crop Sci 2004,
44(2):389-393.
24. Potokina E, Prasad M, Malysheva L, Röder M, Graner A: Expression genetics
and haplotype analysis reveal cis regulation of serine carboxypeptidase I
(Cxp1), a candidate gene for malting quality in barley (Hordeum vulgare
L.). Functional & integrative genomics 2006, 6(1):25-35.
25. Kirst M, Myburg AA, De Leon JPG, Kirst ME, Scott J, Sederoff R: Coordinated
genetic regulation of growth and lignin revealed by quantitative trait
locus analysis of cDNA microarray data in an interspecific backcross of
eucalyptus. Plant Physiol 2004, 135(4):2368.
26. Wang CM, Zhu ZY, Lo LC, Feng F, Lin G, Yang WT, Li J, Yue GH: A
microsatellite linkage map of Barramundi, Lates calcarifer. Genetics 2007,
175(2):907.
27. Green P, Falls K, Crooks S: Documentation for CRI-MAP, version 2.4.
Washington University School of Medicine, St Louis, MO 1990.
28. Voorrips R: MapChart: software for the graphical presentation of linkage
maps and QTLs. J Hered 2002, 93(1):77.
29. Wang S, Basten C, Zeng Z:
Windows QTL Cartographer V2. 5. 2005.
WQTLCart htm [ />doi:10.1186/1471-2229-11-132
Cite this article as: Liu et al.: Mapping QTLs for oil traits and eQTLs for
oleosin genes in jatropha. BMC Plant Biology 2011 11:132.
Liu et al. BMC Plant Biology 2011, 11:132
/>Page 9 of 9