báo cáo khoa học: "Transcriptomics of shading-induced and NAAinduced abscission in apple (Malus domestica) reveals a shared pathway involving reduced photosynthesis, alterations in carbohydrate transport and signaling and hormone crosstalk" pptx
Bạn đang xem bản rút gọn của tài liệu. Xem và tải ngay bản đầy đủ của tài liệu tại đây (1.69 MB, 20 trang )
RESEARC H ARTIC L E Open Access
Transcriptomics of shading-induced and NAA-
induced abscission in apple (Malus domestica)
reveals a shared pathway involving reduced
photosynthesis, alterations in carbohydrate
transport and signaling and hormone crosstalk
Hong Zhu
1,3
, Chris D Dardick
2*
, Eric P Beers
3
, Ann M Callanhan
2
, Rui Xia
1,3
and Rongcai Yuan
1,3
Abstract
Background: Naphthaleneacetic acid (NAA), a synthetic auxin analogue, is widely used as an effective thinner in
apple orchards. When applied shortly after fruit set, some fruit abscise leading to improved fruit size and quality.
However, the thinning results of NAA are inconsistent and difficult to predict, sometimes leading to excess fruit
drop or insufficient thinning which are costly to growers. This unpredictability reflects our incomplete
understanding of the mode of action of NAA in promoting fruit abscission.
Results: Here we compared NAA-induced fruit drop with that caused by shading via gene expression profiling
performed on the fruit abscission zone (FAZ), sampled 1, 3, and 5 d after treatment. More than 700 genes with
significant changes in transcript abundance were identified from NAA-treated FAZ. Combining results from both
treatments, we found that genes associated with photosynthesis, cell cycle and membrane/cellular trafficking were
downregulated. On the other hand, there was up-regulation of genes related to ABA, ethylene biosynthesis and
signaling, cell wall degradation and programmed cell death. While the differentially expressed gene sets for NAA
and shading treatments shared only 25% identity, NAA and shading showed substantial similarity with respect to
the classes of genes identified. Specifically, photosynthesis, carbon utilization, ABA and ethylene pathways were
affected in both NAA- and shading-induced young fruit abscission. Moreover, we found that NAA, similar to
shading, directly interfered with leaf photosynthesis by repressing photosystem II (PSII) efficiency within 10 minutes
of treatment, suggesting that NAA and shadi ng induced some of the same early responses due to reduced
photosynthesis, which concurred with changes in hormone signaling pathways and triggered fruit abscission.
Conclusions: This study provides an extensive transcr iptome study and a good platform for further investigation of
possible regulatory genes involved in the induction of young fruit abscission in apple, which will enable us to
better understand the mechanism of fruit thinning and facilitate the selection of potential chemicals for the
thinning programs in apple.
Background
Most apple trees tend to bear more fruit than they can
support to maturity. While such over-cropping may
help ensure reproductive success, it can lead to branch
damage, low quality fruit and drastic reductions in
cropping in the following year. Consequently, over-crop-
ping is an undesirable trait. Although a self-thinning
process known as the “June drop” can help alleviate the
negative impact of excessive fruit bearing, apple growers
often find it necessary to apply chemical thinners to
remove excess fruit at an early stage of fruit develop-
ment. Naphtha leneacetic acid (NAA) is one of the most
commonly used chemical thinners, but its efficacy varies
* Correspondence: a.gov
2
Appalachian Fruit Research Station, United States Department of
Agriculture, Agricultural Research Service, Kearneysville, WV, 25430, USA
Full list of author information is available at the end of the article
Zhu et al. BMC Plant Biology 2011, 11:138
/>© 2011 Zhu et al; licensee BioMed Central Ltd. This is an Open Access article distributed under the terms of the Creative Commons
Attribution License ( which permits unrestricted use, distribution, and reproduction in
any medium, provided the original work is properly cited.
among different varieties and is affected by environmen-
tal conditions following the application.
The physiological mechanisms by which NAA pro-
motes the abscission of young apple fruitlets have been
discussed [1-3]. Principal among these mechanisms is a
reduction in carbohydrate availability to the developing
fruit either by interference with photosynthesis [4,5] or
by reduced translocation of metabolites, including
photosynthates, from leaves to the fruit [6]. The impor-
tance of photosynthesis and photosynthate translocation
in fruit retention is further i llustrated by experiments
involving shading or removal of leaves, two treatments
that cause e xtensive apple fruit abscission [7,8]. More-
over, normal fruitlet abscission, which can occur both
shortly after anthesis and during the “June drop”,has
been at least partly attributed to the competition for
carbohydrates among young fruit and between fruit and
vegetative shoots [7,9]. Together these findings indicate
that photosynthesis is critical for fruit development and
treatments that alter the levels of carbohydrates avail-
able for translocation to the developing fruit can influ-
ence the fruit set of apple trees.
In addition to its effects on carbohydrate levels, NAA
application apparently enhances apple fruitlet abscission
through increased ethylene production [10-13]. Applica-
tion of ethephon, which releases ethylene, effectively
promoted the abscission of young fruit in apple [14],
while aminoethoxyvinylglyci ne (AVG), a strong inhibitor
of ethylene biosynthesis, reduced fruit ethylene produc-
tion and young fruit abscission in apple [13,15]. The
NAA-induced increase in ethylene production is posi-
tively correlated with changes in the expression of ethy-
lene biosynthesis and signal transduction genes,
including five ACC synthase genes (MdACS), one ACC
oxidasegene(MdACO), four ethylene receptor genes
(MdETR and MdERS) and one ethylene signal transduc-
tion gene (MdCTR1) [12,13,16]. It has been reported
that apple fruitlet abscission is preceded by a stimula-
tion of ethylene biosynthesis and an acquisition in the
sensitivity to ethylene [12]. Also, a recent microarray
analysis of the abscission-related transcriptome in
tomato flower abscission zone (AZ) revealed a link
between the acquisition of ethylene sensitivity in the AZ
and altered expression of auxin-regulated genes due to
auxin depletion [17].
Cell wall breakdown and cell separation are required
within the fr uit abscission zone (FAZ) for fruit abscis-
sion. Cell wall remodeling genes are induced in the FAZ
[18,19] and the activities of cell wall remodeling and
degrading enzymes, including expansin, pectate lyase,
polygalacturonase and b-1,4-glucanase, have been shown
to markedly increase, concomitant with increased ethy-
lene production, catalyzing the loosening and break-
down of the cell wall and promoting fruit drop [20-23].
The findings summarized above suggest that abscis-
sion-associated carbohydrate-, ethylene- and auxin-
responsive signaling pathwa ys engage in crosstalk with
each other and with other signaling pathw ays to coordi-
nate abscission. Increasin g knowledge of changes in
gene expression associated with abscission will aid in
the development of strategies for more predictable thin-
ning results and set the stage for the development of
improved thinners. Moreover, the identification of regu-
latory networks that are central to apple fruit abscission
will enhance our basic understanding of organ abscis-
sion, which is a fundamental aspect of plant develop-
ment. In this study, we compared NAA and shading-
induced abscission, through transcriptome analysis, to
reveal the mo lecular mechanism controlling the induc-
tion of apple fruitlet abscission. Results show that NAA,
likeshading,imposesastress signal through photo-
synthesis impairment and causes altered hormone sig-
naling and triggers fruit abscission.
Results
Effects of NAA and shading on young fruit abscission and
ethylene production by young fruit and leaves
A comparison of the relative effectiveness of NAA and
shading as inducers of fruit abscission revealed significant
treatment-specific differences in abscission rates and
totals. For example, while both treatments promoted
detectable increases in abscission rates within the first 7 d
post-treatment, the NAA-induced abscission rate
remained essentially unchanged from 7 to 13 d, whereas
shading resulted in a relatively steady increase in the rate
of fruit abscission for the same period (Figure 1A). By 15
d, however, similar rates of abscission were observed for
both treatments and rates were near or below control
rates by 19 d for both treatments. Ultimately, shading was
significantly more effective in promoting fruit drop, caus-
ing 98% of the fruit to abscise within the 19-d period of
the study, compared to a 75% loss in the same period fol-
lowing NAA treatment. Interestingly, the pattern of abscis-
sion exhibited by controls roughly mirrored that of treated
trees but resulted in less than 10% of the fruit being shed,
indicating that the NAA and shading treatments were able
to act additively or synergistically with the endogenous
early fruit abscission program (Figure 1B).
Previous studies have documented t he link between
NAA- and shading-induced abscission and ethylene pro-
duction. We confirmed that the major increases in ethy-
lene production preceded the onset of fruit abscission
(Figure 2A compared with Figure 1A). The maximum
level of NAA-induced fruit ethylene production was
detected at 1 d and had decreased t o control level by 7
d after treatment. Shaded fruit also released higher
levels of ethylene relative to the control between 1 and
5 d, but levels reached only 50% of those from NAA-
Zhu et al. BMC Plant Biology 2011, 11:138
/>Page 2 of 20
treated fruit (Figure 2A). A similar pattern of ethylene
release was detected for leaves, where the ethylene pro-
duction of both shaded and NAA-treated leaves peaked
at1d,butdecreasedtocontrollevelby5and7dafter
treatment, respectively. However, at its peak rate, mea-
sured at 1 d, almost 70-fold more ethyl ene was released
by leaves compared to fruit (Figure 2B).
Expression profiling of young fruit abscission induced by
NAA and shading
To identify genes whose expression patterns correlated
with the fruit abscission induced by NAA and shading,
gene expression profiling was performed using the FAZ
at three time points (D1, D3 and D5), a period spanning
the earliest phase of the treatment-dependent increase
in abscission above control levels (Figure 1). For each
time point, labeled cDNA from the FAZ of NAA- or
shading-treated trees was hybridized to reference cDNA
from the FAZ of non-treated trees for the same time
point, so as not to confound the changes in gene
expression caused by treatments with those occurring
during fruit development.
Seven-hundred-twenty-two genes from NAA-treated
sample hybridizations and 1057 genes from shading-
treated sample hybridizations showed statistically signifi-
cant changes in expression (Additional file 1, Table S1).
Of these genes, 168 were differentially expressed in
FAZs from both NAA- and shading-treated samples,
and 86% (145) of those displayed similar expression pat-
terns, indicating that NAA- and shading-induced abscis-
sion share some common signaling pathways.
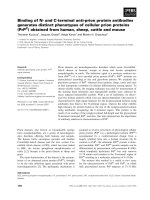
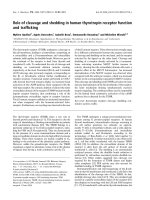
Figure 1 Effect of NAA and shading treatments on fruit abscission of ‘Golden Delicious’ apples. (A) NAA and shading increase fruit
abscission rate. (B) NAA and shading treatment also increase the percentage of total fruit drop. Results represent the mean (± SE) of three
replicates. Different letters indicate significant differences among means according to Duncan’s multiple range test (P ≤ 0.05).
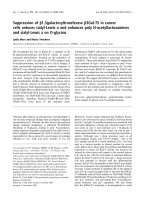
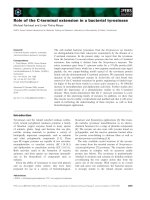
Figure 2 Effect of NAA and shading treatments on ethylene
production of ‘Golden Delicious’ apples. (A) NAA and shading
induce ethylene in young fruit. (B) NAA and shading also induce
ethylene in leaves. Results represent the mean (± SE) of three
replicates.
Zhu et al. BMC Plant Biology 2011, 11:138
/>Page 3 of 20
Time points and selected genes were grouped accord-
ing to expression pattern by hierarchical cluster analysis
(Additional file 2, Figure S1). Following NAA treatment,
the largest number of differentially expressed genes was
detected at 3 d, followed by 5 and 1 d after NAA treat-
ment, suggesting that NAA caused a t ransient effect
during the abscission inductio n. In contrast, shading led
to a sustained increase in the number of differentially
expressed genes from 1 to 5 d. For both treatments,
there were approximately equal numbers of genes show-
ing upregulation or downregulation by 1 d, but induced
genes outnumbered repressed genes for 3 and 5 d.
The two array datasets were further analyzed using K-
means clustering (KMC) for genes whose expression
pattern was correlated with the induction of fruit abscis-
sion (Additional file 3, Table S2). The cluster names
were assigned upregulated (u), unchanged (o)ordown-
regulated (d) for each time point. NAA-responsive genes
were classified into 8 main clusters. As shown in Addi-
tional file 4 (Figure S2), the largest group (comprised of
clusters 2 and 6) of differentially regulated genes was
detected at 3 d. Shading-responsive genes were divided
into 10 clusters. Similar to the NAA dataset, most clus-
ters reflected either up- or down-regulation at one or
two time points. In contr ast to the NAA treatment, two
clusters in the shading dataset (2 and 7) showed a per-
sistent repression or induction at all three time points,
and one cluster (5) comprised 51 genes that were first
downregulatedat1d,butlaterupregulatedat5dafter
treatment (Additional file 4, Figure S2).
We examined gene expression patterns to identify
functional categories correlated with fruit abscission.
Genes probed by the apple array have both annotation
and gene ontology (GO) information. However, as some
annotations and GO categories do not provide detailed
informationonthebiological mechanisms, additional
manual annotations and literature validations were con-
ducted for the entire list of differentially expressed
genes. The resulting 15 functional categories included
eight categories (photosynthesis, metabolism, mem-
brane/cellular trafficking, cell cycle, hormone response,
cell wall modification, protein metabolism and transcrip-
tion factors) that accounted for over 70% of all the dif-
ferentially expressed genes for both treatments (Figure
3A-B). After furth er gene ca tegoriz ation, we found that
some categories and their subcategories showed trends
where most members were either up- or downregulated
by one or both treatments. To determine if such expres-
sion trends were statistically significant or just occurred
by chance, c
2
and Fisher’s exact tests were performed
on these categories and their subcategories, showing
most, but not all categories and subcategories with non-
random expression trends. A similar approach was used
by Dardick et al (2007) for the enrichment analysis [24].
Those statistically significant categories and subcate-
gories were shown in Figure 3C. All the resulting classi-
fications were d isplayed in Additional file 5 ( Table S3)
and used for the subsequent analysis.
Photosynthesis-related genes
The chloroplast is the site of the energy transduction
and Calvin Cycle phases of photosynthesis and starch
metabolism. Reductions in chloroplast function in
response to shading have been reported previously [7]
and were consistent with our transcript profiles from
shading-treated trees. We found that NAA treatment
also led to strong reductions in photosynthesis-related
gene expression, which supported a previous report [4].
Although shading downregulated a larger number of
photosynthesis-related genesthanNAA,inbothtreat-
ments over 90% of the differentially expressed genes
related to chloroplast function were repressed (Addi-
tional file 5, Table S3). The affected genes function in
light-harvesting, oxygen evolution, electron transport
and carbon fixa tion. Shading-repressed genes were also
involved with chlorophyll biosynthesis, chloropl ast DNA
binding, thylakoid formation and carbon utilization.
However, only a small overlap was observed between
this latter group of shading-repressed genes and those
repressed by NAA, indicating that NAA and shading
repress photosynthesis-related processes through par-
tially distinct mechanisms.
Carbohydrate metabolism and sugar sensing
Not surprisingly, the repression of photosynthesis-
related gene expression caused by both treatments was
linked with changes in the expression of genes in the
metab olism category, with the largest subset of differe n-
tially expressed genes belonging to carbohydrate meta-
bolism. Affected ge nes within this category include
those associated with glycolysis, the cleavage of glycosi-
dic bonds, sugar phosphorylation and signal transduc-
tion. Thirty-eight carbohydrate metabolism genes
showed significantly altered expression in response to
NAA, while 149 genes were regulated by shading (Addi-
tional file 5, Table S3). NAA-induced genes included
those involved with glycolysis and starch degradation,
such as pyruvate kinase, alcohol dehydrogenase, amylase
and limit dextrinase. Similarly, shading treatment
induced genes associated with glyc olysis, but also led to
changes in the expression of genes for carbohydrate
active enzymes, i.e., induction of beta-glycosidases and
glycosyltransferase and repression of alpha-glycosidases.
Genes related to sucrose metabolism, e.g., sucrose phos-
phate synthase (SPS) and sucrose phosphate phospha-
tase (SPP), were inversely regulated by the two
treatments: NAA repressed SPS and induced SPP,while
shading induced SPS and repressed SPP.Agroupof
Zhu et al. BMC Plant Biology 2011, 11:138
/>Page 4 of 20
genes identified as cytosolic and cell wall invertases were
induced by shading in the FAZ, indicating a possible
increase in sucrose breakdown in the FAZ. These same
invertases were not differentially regulated by NAA,
however. The expression of three distinct putative alka-
line/neutral invertase genes w as reduced after bo th
NAA and shading treatments. Sorbitol dehydrogenase
(SDH)wasrepressedbybothNAAandshading,while
NADP-dependent D-sorbitol-6-phosphate dehydrogen-
ase (S6PDH) was induced by NAA but repressed by
shading. Many ADP/UDP-glucose pyrophosphorylase
genes responsible for starch synthesis were downregu-
lated by shading, but none was differentially r egulated
by NAA.
Sugar signals are generated from various source
organs in response to stresses and changes in metabolic
fluxes [25]. Hexokinase (HXK) senses glucose levels and
SNF-related protein kinases (SnRKs) are important to
metabolic reprogramming in response to changes in car-
bohydrate levels [26]. Shading altered the expression of
var ious carbohydrate kinases, but HXK was upregulated
by NAA only in the FAZ.
Trehalose serves as a storage carbohydra te and stress
protectant, which usually accumulates during starvation
conditions [25,27]. Trehalose metabolism genes were
downregulated by shading but not by NAA treatment.
Specifically, genes encoding trehalose-6-phosphate
synthase (TPS) and trehalose-6-phosphate phosphatase
(TPP) were repressed in the shading-treated FAZ, sug-
gesting a decreased trehalose level in the FAZ resulted
from shading.
Transport
A large group of transporters for sugars, lipids, amino
acids and metal ions were differentially expressed in
response to both treatments. The expression of all sorbi-
tol/suc rose trans porter genes was consistently repressed
by both treatments, while shading downregulated more
genes relate d to general sugar transport, such as hexose
transporters. A class of genes related to membrane and
Figure 3 Functional categories of statistically significant genes. (A) Differentially expressed genes are categorized from NAA-treated FAZ. (B)
Differentially expressed genes are categorized from shading-treated FAZ. The functional categorization is based on the annotation and GO
information. Category names are indicated near each pie slice, along with the proportion of each category. (C) Functional categories showing
non-random expression trends. Statistically significant values are highlighted (P ≤ 0.05).
Zhu et al. BMC Plant Biology 2011, 11:138
/>Page 5 of 20
cytoskeleton function, including microtubule, vesicle-
mediated membrane transporter and cell adhesion
genes, were found exclusively repressed by NAA. In all,
twice as many transport-related genes were affected by
shading compared to NAA, among which several ion
transporters, especially for calcium and potassium, were
significantly upregulated by shading while others for
water transport were downregulated. Another group of
transporters, ATP-binding cassette transpo rters (ABC
transporters), were induced by both treatments.
Cell cycle-related genes
Similar numbers of cell cycle genes were identified in
the two datasets of differentially expressed genes, includ-
ing two classes of regulatory genes, cyclin and cyclin-
dependent kinase (CDK), being repressed by both NAA
and shading. Several cell division control proteins w ere
also downregulated while one CDK inhibitor was upre-
gulated in the FAZ.
Hormone synthesis and signaling
Many genes involved in different hormone synthesis and
signaling pathways showedsignificantexpression
changes in response to both treatments. ABA has been
implicated as a regulator of stress-induced senescence
[28,29]. In this study, NAA appeared to have limited
effect on ABA-related genes in that it only upregulated
three 9-cis-epoxycarotenoid dioxygenase (NCED) genes
and a zeaxanthin epoxidase gene, which encode key
enzymes in ABA biosynthesis. In contrast, shading
altered 26 ABA-related genes involved in biosynthesis,
including NCED, short chain dehydrogenase/reductase
(SDR) and abscisic aldehyde oxidase (AAO), and several
genes related to ABA si gnaling, including protein phos-
phatase type 2C and ABA responsive elements-binding
factors.
A divergence in auxin-related gene expression was
noted for shading- versus NAA-treated trees. Only two
auxin-induced SAUR-like and two auxin transport genes
showed significant changes in response to shading.
However, 21 auxin-related genes were differentially
altered by NAA and the se genes included IAA-amido
synthase, auxin-amidohydrolase, AUX/IAA proteins and
various auxin response factors (ARFs). Genes related to
auxin polar tran sport were also affected by NAA, with
auxin influx carriers induced and efflux carriers largely
repressed. The latter effect diverged from that observed
for shading-treated trees, where the same auxin efflux
carrier genes were induced (Additional file 5, Table S3).
In response to both treatments, genes for ethylene
biosynthesis and perception were upregulated, including
1-aminocyclopropane-1-carboxylate synthase (ACS)and
oxidase (ACO) and two classes of ethylene receptors
(ERS and ETR). Coinciding with the increased ethylene
biosynthesis (Figure 2), the expression of spermidine
synthase gene, a key gene related to polyamine biosynth-
esis, was consistently reduced by both treatments.
Genes involved with cytokinin and gibberellic acid
(GA) signaling pathways were downregulated by shading
and NAA. Also, shading increased the expression of a
GA2-oxidase gene, which is responsible for GA catabo-
lism. Regarding brassinosteroid (BR)-related genes
affected by shading, a BR oxidase gene was repressed,
while a BR-signaling kinase gene was induced 3 d after
shading. In contrast, express ion of BR-related genes was
not affected by NAA treatment.
Cell wall modification
A shared set of 11 genes associated with cell wall bio-
synthesis, loosening and degradatio n was responsive to
both treatments, with most exhibiting changes at 3 and
5 d after treatment. Specifical ly, cellulose synthase genes
were repressed while other genes related to cell wall
loosening and hydrolysis, including b-1,3-glucanase,
polygalacturonase and expansin, were all induced.
Proteolysis and programmed cell death
A number of genes putatively involved in the ubiquityla-
tion pathway were upregulated. Several upregulated
genes within the NAA dataset encode F-box proteins
and other members of ubiquitin E3 ligase complex,
including cullin and ubiquitin-conjugating enzymes. In
comparison, shading caused a more widespread induc-
tion of genes responsible for protein ubiquitylation and
degradation. Shading also had greater impact on the
expression of 26S proteasome subunit genes. Another
group of genes co-induced by both treatments included
those possibly involved in programmed cell death, such
as clp and cysteine proteases and autophagy genes. Simi-
lar to the pattern observed for cell wall degrading genes,
the induction of almost all genes identified in cell death
category was detected at 3 and 5 d.
Transcription factors (TFs)
Several classes of TFs exhibited significant changes in
expression. Ten TFs were co-regulated by shading and
NAA, including ERF/AP2 transcription factors, bZIP
proteins, MADS-box and MYB domain proteins. The
differentially expressed ERF/AP2 TFs were co-expressed
with the genes for biosynthesis and signali ng of ethylene
and ABA, consistent with their roles in these two hor-
mone signaling pathways [30,31]. Interestingly, a homo-
log of the JOINTLESS gene (JNT), which encodes a
MADS-box TF and regulator of abscis sion zone forma-
tion [32], was upregulated by both treatments. While
there were both up- and down- regulated NAC dom ain
genes in the shading dataset, NAC genes were not dif-
ferentially expressed in response to NAA. Distinct sets
Zhu et al. BMC Plant Biology 2011, 11:138
/>Page 6 of 20
of WRKY TFs were induced by NAA and repressed by
shading (Additional file 5, Table S3).
Validation of array data in the FAZ and analysis of
selected genes in other tissues via RT-qPCR
Subsets of genes from the above categories were selected
for validation of array data in the FAZ by RT-qPCR
(Additional files 6 and 7, Table S4 and S5). cDNA sam-
ples derived from three additional time points (D0, D7
and D9 after treatment) were included to expand the
expression pattern data for these genes. The relative
expression levels measured by RT-qPCR were converted
to fold change relative to the value obtained from the
array data for refere nce control samples to enable direct
comparison to the RT-qPCR results. Generally, the RT-
qPCR results from the FAZ samples were consistent
with the array data in terms of the overall expression
pattern but variations were also observed (Figures 4, 5,
6 and 7). To further explore the effects of NAA and
shading on source-to-sink relationships, we analyzed tis-
sue-specific expression pattern of selected genes
involved in photosynthesis, sugar metabolism and hor-
mone metabolism and signaling using cDNA derived
from leaf and fruit cortex (FC) (Figures 8 and 9).
In both FAZ and FC, the expression of MdNCED was
induced by both shading a nd NAA from 3 d. In addi-
tion, genes encoding a SDR family protein and a tran-
scription factor (AHAP), for the regulation of ABA
signaling were induced in the FAZ from 1 to 5 d. In th e
FC, the expr ession of those genes was consistently
increased by both treatments, especially on 3 and 5 d
after treatment (Figure 4). An upregulation of genes
encoding ethylene biosynthesis and signaling (MdACS,
MdACO, MdETR and MdERS)wasconfirmedbyRT-
qPCR for NAA- and shading-treated FAZ and mirrored
in the FC. Overall, the induction of these ethylene-
related genes in the FC was greater in response to NAA
than shading, corresponding with the higher levels of
ethylene released by fruitlets treated with NAA versus
shading (Figure 5 compared to Figure 2). Consistent
with the microarray dat a, both sorbitol and sucrose
trans porter genes (MdSOT and MdSUT) were repressed
in the FAZ by NAA and shading from 1 to 5 d. In con-
trast, the expression of these transporters in the FC was
increased from 3 through 7 d after both treatments. As
forauxinpolartransport,aPIN-like auxin transporter
gene (PIN) and an auxin efflux carrier gene (AEC) both
showed consistently decreased expression from 3 d in
NAA-treated FAZ and FC (Figure 6). Concerning AZ
formation and cell wall degradation, the MdJNT gene
expression in the FAZ was increased by both NAA and
shading from 3 d after treatment and remained higher
than the control. We also observed an increase of
expansin (EXP) gene expression in both NAA- and
shading-treated FAZ as early as 1 d after treatment,
concurrent with the burst of fruit ethylene production
(Figure 7 compared to Figure 2). MdPG2 expression in
the FAZ was induced by NAA and shading from 5 d
onward, corresponding with the increased rate of fruit
abscission (Figure 7 compared to Figure 1).
Since a widespread repression of chloroplast-related
genes in the FAZ was evident from the array d ata, we
further tested leaves to s ee if photosynthetic organs
were similarly aff ected, RT-qPCR results showed a sus-
tained repression of the selected genes involved with
light-harvesting (CAB), oxygen evolving enhancement
(PSB) and Rubisco activation (RuBACT) in NAA-treated
leaves as early as 1 d after treatment (Figure 8). The
expression of genes encoding transporters for both sor-
bitol and sucrose (MdSOT and MdSUT) was also found
to be repressed in leaves. The expression of three other
genes related to sugar metabolism was tested in the FC,
which is a site of active carbohydrate metabolism. As
shown in Figure 9, HXK expression was significantly
induced by shading, with maximum levels detected at 7
d. HXK expression was most increased by NAA on 5 d,
and remained higher than the control level thereafter.
The expression of SDH gradually increased in the con-
trol fruit, but was significantly repressed by NAA and
shading. Although our array data showed a consistent
downregulation of TPS in the FAZ from shading-treated
trees, and no effect on TPS expression due to NAA,
both NAA and shading were shown to cause an early
induction of TPS in the FC (Figure 9), implicating TPS
in fruit-specific aspects of abscission independent of the
method of induction.
Effects of NAA on leaf photosynthesis
From our array data, a large group of genes related to
photosynthesis were identified as strongly repressed by
NAA in the FAZ at an early stage, implying that NAA
might directly interfere with photosynthesis. Therefore,
wemeasuredtheeffectofNAAontheleafbymoni-
toring the F
V
/F
M
value which provides a useful relative
measure of the maximum quantum yield of PSII pri-
mary photochemistry. The NAA-a ffected leaves dis-
playedauniquepatternwheretheFv/Fmreadings
were significantly decreased under fluorescence ima-
ging system, indicating that the leaves were under
stress. We also found that NAA at various rates (15,
150, 450 and 900 mg L
-1
)causedconcentration-depen-
dent impairment of PSII in the leaves of young seed-
lings in the growth chamber (Figure 10A). NAA at 15
mg L
-1
, the working concentration used in the thinning
experiment, caused significant photoinhibition of leaf
PSII efficiency (Figure 10B-D). Such inhibition was
observed as early as 10 min post-treatment and lasted
for 8 or more hours, from which the leaves typically
Zhu et al. BMC Plant Biology 2011, 11:138
/>Page 7 of 20
recovered within 1 d. Next, a field trial on fruit-bearing
trees was performed. More severe effects of NAA at 15
mg L
-1
on leaf pho tosynthesis were found and t hese
effects lasted longer than in young seedlings (Figure
10E-G). This increase in severity is not surprising
given the higher light levels in the field (full sunlight)
versus greenhouse conditions. It is also important to
note that under field conditions, the leaves showed
visible necrosis by 24 h post-treatment, specifically
near the petiole where photoinhibition was most
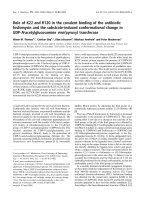
Figure 4 Expression of genes related to ABA biosynthesis and signaling as determined by RT-qPCR. Left column, Gene expression in fruit
abscission zone (FAZ) from ‘Golden Delicious’ apple trees after application of NAA and shading. Red lines indicate normalized microarray values
(Solid for NAA and dot for shading). Right column, Gene expression in fruit cortex (FC) from ‘Golden Delicious’ apple trees after application of
NAA and shading. The values of transcript levels in the FAZ and FC from control trees were arbitrarily set to 1. The transcript levels were
normalized using actin. Results represent the mean (± SE) of three replicates.
Zhu et al. BMC Plant Biology 2011, 11:138
/>Page 8 of 20
Figure 5 Expression of genes related to ethylene biosynthesis and signaling as determined by RT-qPCR. Left column, Gene expression in
fruit abscission zone (FAZ) from ‘Golden Delicious’ apple trees after application of NAA and shading. Red lines indicate normalized microarray
values (Solid for NAA and dot for shading). Right column, Gene expression in fruit cortex (FC) from ‘Golden Delicious’ apple trees after
application of NAA and shading. The values of transcript levels in the FAZ and FC from control trees were arbitrarily set to 1. The transcript levels
were normalized using actin. Results represent the mean (± SE) of three replicates.
Zhu et al. BMC Plant Biology 2011, 11:138
/>Page 9 of 20
Figure 6 Expression of genes related to sugar transport and polar auxin transport as det ermined by RT-qPCR. Left column, Gene
expression in fruit abscission zone (FAZ) from ‘ Golden Delicious’ apple trees after application of NAA and shading. Red lines indicate normalized
microarray values (Solid for NAA and dot for shading). Right column, Gene expression in fruit cortex (FC) from ‘Golden Delicious’ apple trees
after application of NAA and shading. The values of transcript levels in the FAZ and FC from control trees were arbitrarily set to 1. The transcript
levels were normalized using actin. Results represent the mean (± SE) of three replicates.
Zhu et al. BMC Plant Biology 2011, 11:138
/>Page 10 of 20
strongly observed. It is not clear if this spatial imbal-
ance was caused by pooling of the NAA solution near
the base of the leaf or whether this portion of the leaf
is particularly sensitive to NAA. Taken together, these
findings indicate that NAA application has rapid and
severe impacts on leaf photosynthetic efficiency.
Discussion
In apple, shading a nd NAA application are two treat-
ments often applied by researchers to promote fruitlet
abscission, while NAA has been widely used by growers
to reduce excessive bearing of apple trees. While the
transcriptomes associated with abscission in Arabidopsis
[33-35] and fruit development in apple have been
reported [36,37], detailed information on the molecular
mechanisms involved in fruit abscission following induc-
tion by multiple means remains limited. Using suppres-
sion-subtrac tive hyb ridizat ion (SSH ), vario us transcri pts
from shaded small apple fruit have been identified as
differentially expressed and over 20% of these are related
to carbohydrate metabolism [38]. A recent transcrip-
tome study focusing on the role of benzyladenine (BA)
in apple fruit abscission, led to the hypothesis that B A
treatment imposes a nutrient stress perceived primarily
by the fruitlet cortex and then by the seed, likely
through ROS-sugar-ABA signaling, finally leading to
abscission zone activation [39]. These findings were spe-
cific for the fruit cortex and seed, so did not include
information on changes occurr ing in the FAZ or leaves.
It has also been proposed that an increase in ethylene
production preceding abscission might hamper the polar
auxin transport from the seeds down through the FAZ
and cause the fruitlet abscission [40]. The potential
importance of auxin-ethylene crosstalk was also partly
supported by a tomato flower AZ transcriptome analysis
[17], where auxin depletion caused altered expression of
auxin-regulated genes in association with the acquisition
of ethylene sensitivity in the AZ. While these findings
implicate auxin-ethylene crosstalk in abscission, they did
not focus on plant stress response linked with metabolic
reprogram ming as a factor that influences hormone sig-
nalling for abscission. In addition, these studies have not
examined whether distinct treatments for inducing
abscission, such as shading and NAA, converge on com-
mon genetic pathways leading to abscission.
In this stud y, by comparing the gene expression pro-
files of young fruit abscission caused by NAA and shad-
ing, we found that the number of genes affected by
these two treatments was positively correlated w ith the
severity of the thinning responses. Our microarray
experiments involved sampling during induction of
abscission and the beginning of a detectable increase in
therateofabscissionratherthan during the abscission
process itself. Hence, additional work is required to
determine changes in gene expression occurring during
later stages of abscission. Although any large changes in
expression limited to narrow windows of either tem-
poral or spatial regulation in the abscission zone were
Figure 7 Expression of genes related to abscission zone
formation and cell wall degradation as determined by RT-
qPCR. Gene expression in fruit abscission zone (FAZ) from ‘Golden
Delicious’ apple trees after application of NAA and shading. Red
lines indicate normalized microarray values (Solid for NAA and dot
for shading). The values of transcript levels in the FAZ from control
trees were arbitrarily set to 1. The transcript levels were normalized
using actin. Results represent the mean (± SE) of three replicates.
Zhu et al. BMC Plant Biology 2011, 11:138
/>Page 11 of 20
likely attenuated due to sampling that included mixed
fruitlets of different abscission potentials, the changes in
gene expression we observed c onfirm earlier reports of
the involvement of two important hormone signaling
pathways, ethylene and ABA [12,13]. Moreover, our
array data showed that NAA may exert its thinning
effect through interfering with leaf photosynthesis, as
well as sugar sensing and carbohydrate partitioning
within the tree, which is similar to pathways involved in
the shading-induced young fruit abscission in apple.
Hormone regulation in fruit abscission
Our microarray results are consistent with previous
observations that ethylene is a key signal for the coordi-
nation of young fruit abscission induced by the chemical
thinner NAA in apple [12,13,41]. In this study, ethylene
Figure 8 Expression of gen es related to photosynthesis and sugar availability as determined by RT-qPCR. Gene expression in leaf from
‘Golden Delicious’ apple trees after application of NAA. The values of transcript levels in the leaf from control trees were arbitrarily set to 1. The
transcript levels were normalized using actin. Results represent the mean (± SE) of three replicates.
Zhu et al. BMC Plant Biology 2011, 11:138
/>Page 12 of 20
production increased and peaked in fruitlets and leaves
treated by NAA and shading, coincident with upregu la-
tion of genes encoding ethylene biosynthesis and signal-
ing components but prior t o the onset of fruitlet drop
(Figures 1, 2 and 5). These results were consistent with
apreviousreportthatapplefruitletabscissionispre-
ceded by a n increase in ethylene biosynthesis and
sensitivity [12], although ethylene independent pathways
may also promote fruit abscission [41].
It has also been hypothesized that preventing abscis-
sion requires a constant auxin transport through the
abscission zone from the fruit and that the sink strength
of organs is related to their capacity to produce and
export auxin [42,43]. Auxin export is mediated by PIN-
formed proteins and ATP-activated phosphoglycopro-
teins (PGPs) [44,45]. We found that two auxin trans-
port-related genes (PIN and AEC) were repressed by
NAA in the FAZ and FC, i.e., starting from 3 d, and
the ir expression levels remained lower than the control,
indicating that auxin effl ux from the fruitlets was
blocked (Figure 6). Auxin transporter downregulation
was associated with increases in ethylene production
and the expression of ethylene biosynthesis and signal-
ing-related genes (Figures 5 and 6). Using the tomato
flower AZ model, Meir and colleagues [17] no ted that
the acquisition of ethylene sensitivity was associated
with altered expression of auxin-regulated genes and
that ethylene acted as a trigger in the abscission process,
although these authors did not measure the expression
of PIN genes. Taken together, the patterns of ethylene-
and auxin-related gene expression in the FAZ and FC
suggest that ethylene may serve as a feedback inhibitor
controlling auxin transport from fruitlets, and increasing
the ethylene sensitivity of the FAZ.
Abscisic acid has been implicated in the regulation of
stress-induced senescence [29], and it has been pro-
posed that ABA might sense nutrient stress and be cor-
related with the ethylene-associated abscission activation
in citrus fruitlets [46]. We observed a widespread induc-
tion of genes involved with ABA biosynthesis and sig-
nalling in response to shading and an increase in the
expression of genes for ABA biosynthesis with NAA
treatment (Additional file 5, Table S3, Figure 4). These
differences in ABA-related responses suggest that the
ABA signaling pathway is responsive to both treatments,
but is more active in shading-induced fruit abscission.
As mentioned above, more genes associated with sugar
metabol ism and sugar signaling were altered by shading
than NAA, implicating a close crosstalk between sugar
and ABA for the induction of senescence as previously
reported [47].
Repression of photosynthesis-related genes
Decreased light intensity can inhibit photosynthesis and
result in the a bscission of leaves and fruitlets [7], which
was confirmed by our shading experiment. We also
found that NAA caused observable leaf necrosis and
diminution of overall PSII eff iciency (Figure 10), which
agreed with a previous report [48], where NAA consis-
tently reduced whole-tree canopy photosynthesis.
Figure 9 Expression of genes related to sugar metabolism as
determined by RT-qPCR. Gene expression in fruit cortex (FC) from
‘Golden Delicious’ apple trees after application of NAA and shading.
The value of transcript levels in the FC from control trees were
arbitrarily set to 1. The transcript levels were normalized using actin.
Results represent the mean (± SE) of three replicates.
Zhu et al. BMC Plant Biology 2011, 11:138
/>Page 13 of 20
Repression of a group of chloroplast-related genes was
also observed for NAA-treated leaves (Figure 8), and
these gene expression patterns also agreed with the
array data for FAZs from NAA-treated trees, indicating
tha t NAA affected photosynthesis in both leaf and stem
tissues. The negative effect of NAA on leaf photosynth-
esis and PSII activity implicates NAA in causing a car-
bohydrate stress that ultimately affected sink tissues,
including the fruitlets.
Impacts on sugar metabolism, sensing and transport
It has been reported that dark-induced fruit abscission
can be reverse d with trunk injection of sorbitol, the pri-
mary translocated form of carbohydrate in apple [49],
which supports the currently accepted hypothesis that a
limitation of assimilate supply at least partly reduces
fruit growth and induces fruit drop. Plant hexokinase
has been implicated in sugar signaling and the regula-
tion of senescence [50,51]. As a kinase and glucose sen-
sor, the HXK gene has been demonstrated to have dual
functions in both glucose metabolism and signaling
[50,51]. In this st udy, we found that a homol og of the
HXK gene in the FC was induced by both shading and
NAA treatments (Figure 9), suggesting a HXK-depen-
dent sugar-signaling pathway is active during the abscis-
sion induction. It has been reported that transgenic
tomato plants that overexpress Arabidopsis HEXOKI-
NASE1 showed inhibited growth and rapid senescence
[52], while Arabidopsis glucose insensitive2 (gin2) mutant
plants displayed a delayed senescence phenotype [51].
Thus the elevated expression level of HXK observed in
this study might partly account for the inhibited fruit
growth and accelerated fruit abscission.
Sorbitol comprises over 80% of the carbohydrate
translocated in the phloem of apple, and thus is the
main carbon resource imported by fruit sinks [49]. Sor-
bitol dehydrogenase has been identified as a key enzyme
in sorbitol metabolism, converting sorbitol into fructose
[53,54]. In this study, the expression of SDH gradually
increased in the control fruit, indicating its role in
Figure 10 Eff ect of NAA at 15 m g L
-1
on apple l eaf.(A)WhitelightimageoftheeffectofNAAatvariousratesontheleavesofyoung
seedlings in growth chamber. Necrosis was observed in a concentration-dependent manner. (B-D) CFI image of the leaves of young seedlings in
growth chamber treated with NAA at 15 mg L
-1
. Areas with pale blue color indicate PSII photoinhibition. (E-G) CFI image of the leaves of fruit-
bearing trees in the field treated with NAA at 15 mg L
-1
. Areas with dark green color indicate PSII photoinhibition, corresponding with the
numerical values (the right column) in the inserted table. Insert table: Effect of NAA at 15 mg L
-1
on leaf PSII efficiency. F
V
/F
M
values were
recorded three times independently from both control and NAA-affected leaves of fruit-bearing trees in the field. Results represent the mean (±
SE) of three replicates. Different letters indicate significant differences among means according to Duncan’s multiple range test (P ≤ 0.05).
Zhu et al. BMC Plant Biology 2011, 11:138
/>Page 14 of 20
regulating early fruit development. However, NAA and
shading both repressed the expression of SDH in the FC
(Figure 9), suggesting that sorbitol catabolism was lar-
gely inhibited and frui t sink strength was impaired [55],
resulting in abscission. Another important sorbitol-
metabolizing enzyme is sorbitol-6-phosphate dehydro-
genase (S6PDH) that synthesizes sorbitol in leaves for
the translocation to sink tissues [56]. Previous studies
have reported a relation betw een an increase in soluble
carbohydrates and stress tolerance in some Rosaceae
fruit trees [57,58], and S6PDH has been reveale d as an
ABA-inducible gene [59]. We observed a strong induc-
tion of S6PDH expression in NAA-treated leaves (Figure
8), and the induction of genes related to ABA biosy nth-
esis and signaling in both FAZ and FC preceded the
increased S6PDH expression in leaf (Figure 4), consis-
tent with S6PDH being an ABA-mediated stress
response gene.
NAA and shading both significantly inhibited certain
sugar transporter ge nes in the FAZ and leaves, indicat-
ing that the carbon allocation to the fruitlets was ham-
pered. However, the expression of these transporters in
the FC was increased after both treatments (Figure 6 ).
Also, the array data revealed that many tra nsporter
genes were induced by NAA, including a number of
ABC transport ers and several cation transporters, which
was consistent with previ ous findings [33]. Also induced
in this study were several nitrate and sulfate transporter
gene s. The upregulation of these transporters, especially
those involved in sugar transport, might reflect the shift-
ing function of abscising frui tlets, as they become a
source tissue for the mobilization of nutrients to non-
abscising fruitlets.
Induction of genes associated with FAZ formation and
cell wall degradation
The cells comprising the AZ are often morphologically
distinguishable before the onset of abscission [60] and
abscission could not be induced until those cells are
formed [61]. The tomato JOINTLESS gene is a MAD S-
box gene that plays a key role in controlling abscission
zone development [32]. In this study, the MdJNT
expression in the FAZ was gradually increased by both
NAA and shading, suggesting that this transcription fac-
tor involvement in abscission zone formation in apple
and tomato is conserved.
Enlargement of abscissio n zone cells involves cell wall
loosening. Wall loosening can be aided by expansins
and several reports have shown that expansins are
expressed abundantly in abscission zones [22,62]. We
also observed an increase in expansin (EXP)expression
in both NAA- and shading-treated FAZ as early as 1 d
after treatment, concurring with the burst of fruit ethy-
lene production. It has been reported that certain types
of AZ cells enlarge in response to ethylene [61].
Together these results support a role of expansins in
cell enlargement associate d with ethylene-mediated
abscission.
Some reports have indicated that an increase in poly-
galacturonase (PG) activity correlates with fruit abscis-
sion [18,63]. However, MdPG1 expression was not
detected in the FAZ or the FC from ‘Golden Delicious’
or ‘Delicious’ apples [13], which contrasts with other
work showing that MdPG1 was involved in apple fruit
softening and that its expression was suppressed by 1-
MCP and AV G treatment [16,64]. In this study, MdPG1
was not identified from the array but the expression of
MdPG2 in the FAZ was induced by NAA and shading
by 5 d, occurring with the increase in the rate of fruitlet
abscission. This result was in agreement with our pre-
vious work with NAA in ‘Delicious’ apple [13]. Another
report showing an MdPG2 downreg ulation concomi tant
with an NAA-dependent reduction in preharvest fruit
drop [16] supports our current view that MdPG2 rather
than MdPG1 appears to be strongly associated with
fruitlet abscission.
Conclusions
The objective o f this study was to compare global
gene expression changes at early stages during apple
fruitlet abscission caused by two different abscission
inducers: the chemical thinner NAA and shading. A
model has been proposed here to illustrate the associa-
tion of gene expression changes in common with both
abscission inducers during the early induction of fruit-
let abscission (Figure 11). In summary, NAA, like
shading, imposes a stress signal on leaf, or globally on
any other photosynthetically-active tissues within the
tree, causing photosynthesis repression and associated
nutrient stress. As the nutrient stress is perceived at
the fruit level, its growth is inhibited by a sugar trans-
port block, resulting in a lower sink strength of the
fruitlet. Meanwhile, ethylene and/or ABA are produced
in response to photosynthesis inhibition and through
sugar signaling. The elevated ethylene level decreases
auxin transport to the FAZ and increases its sensitivity
to ethylene, causing the differentiation of the FAZ and
the execution of fruit abscission. The differential gene
expression data presented in this study allows for the
development of novel h ypotheses regarding genes that
are important regulators of fruit abscission. These
hypotheses can be functionally tested, using RNA
interference or virus-induced gene silencing, with
genes identified through the recent release of the apple
genome [65]. Moreover, the results of this study may
facilitate the selection of new chemicals or genetic
strategies for the development of more effective apple
fruit thinning programs.
Zhu et al. BMC Plant Biology 2011, 11:138
/>Page 15 of 20
Methods
Plant materials and sample collection
Thirty-six uniform 12-year-old ‘Golden Delicious’ apple
trees on M.9 rootstock were selected and divided into
three blocks of 12 trees each. Four trees from each
block were treated with: 1) Control (water); 2) NAA
(Fruitone N; AMVAC, Newport Beach, CA) at 15 mg L
-
1
; 3) Shading (92% polypropylene shade over the entire
tree for five consecutive days and then removed),
respectively. Treatments were applied when the fruit
size was ~10 mm in diameter. Three biological repli-
cates were conducted independently. Young fruit was
collected at 0, 1, 3, 5, 7, 9 d after treatment. At each
collection time, about 80 f ruit were collected from each
tree, with fruit cortex (FC) and fruit abscission zone
(FAZ) separated. FAZs were collected by cutting 1 mm
at each side of the abscission f racture plane at the base
of the p edicel [41]. All samples were promptly frozen in
liquid nitrogen and stored at -80°C for future RNA
extraction.
Fruit abscission pattern and leaf/fruit ethylene production
To determine the fruit abscission rate, two limbs on
each tree were tagged and fruit on tagged limbs were
countedon0,1,2,3,7,9,11,14,16,18,21,25and26
d after treatment. For ethylene production measure-
ments, 15 fruit and 20 leaves were collected from each
ofthreereplicatetrees0and6hand1,3,5,7,9,11
and 14 d after treatment and enclosed in a 100-mL (for
fruit) or 1000-mL (for leaves) container. After a 2-h
incubation period, a 1-mL gas sample was withdrawn
from the sealed container through the rubber septum
affixed to the lid, and the ethylene concentration was
measured with a gas chromatograph equipped with an
activated alumina column and FID detector (model
3700; Varian, Palo Alto, CA) and expressed as μLC
2
H
4
kg
-1
h
-1
.
Experimental design and microarray hybridization
An apple 70-mer oligonucleotide microarray consisting
of ~33,825 unique sequences and ~ 6,000 controls was
used [66]. RNA from three time points (D1, 3 and 5)
were represented by three biological replicates analyzed
in a dye swap design (six hybridizations per time point)
for a total of 18 slides for the NAA treatment and for
the shading treatment. A co ntrol RNA (the untreated
samples of the same time point) was hybridized along
with the treatment RNA but with the opposite d ye. A
total of 50 pmol of incorporated dye with at least a FOI
of 2.0 (calculated using Base/Dye Ratio Calculator from
Invitrogen) was used for each sample cDNA and the
reference cDNA in the hybridization.
RNA extraction, aRNA amplification and labeling
Total RNA was extracted from the FAZ for each biolo-
gical repli cate as previously described [16], and DNased
using TURBO DNA-free™ Kit (Ambion, Austin, TX).
RT-PCR was performed using primers that span an
intron in MdACO to confirm that each RNA sample
was free of genomic DNA contamination. The RNA was
quantified using the NanoDrop ND-1000 (Thermo
Scientific, MA) and the quality checked using the Bioa-
nalyzer 2100 (Agilent, CA) according to manufacturer’s
instructions. According to the Instruction Manual of
Amino Allyl MessageAmp™ II aR NA Amplification Kit,
cDNA was synthesized from mRNA in 1 μgoftotal
RNA. Purified cDNA was transcribed to aRNA using
IVT Master Mix which contains 5-(3-aminoallyl)-UTP
Figure 11 A hypothetical model for NAA-induced young fruit
abscission in apple. NAA, like shading, imposes a stress signal on
leaf, or globally on any other photosynthetically-active tissues within
the tree, causing photosynthesis repression and associated nutrient
stress. As the nutrient stress is perceived at the fruit level, its growth
is inhibited by a sugar transport block, resulting in a lower sink
strength of the fruitlet. Meanwhile, ethylene and/or ABA are
produced in response to photosynthesis inhibition and through
sugar signaling. The elevated ethylene level decreases auxin
transport to the FAZ and increases its sensitivity to ethylene,
causing the differentiation of the FAZ and the execution of fruit
abscission.
Zhu et al. BMC Plant Biology 2011, 11:138
/>Page 16 of 20
(50 mM), ATP/CTP/GTP Mix (25 mM), UTP (50 mM),
T7 10 × Reaction Buffer and T7 Enzyme Mix. Purified
aRNA was labeled with either AlexaFluor555 or Alexa-
Fluor647 (Invitrogen, CA) for hybridization following
the manufacturer’s instructions. Labeled samples (10 μL)
were mixed with 1 × Slide Hyb Glass Hybridization Buf-
fer (Ambion) and injected into the slide chambers
which were heated to 65°C. The chambers were incu-
bated at 42°C overnight. The next day, the slides were
washed with 1 × SSC, 0.2% SDS for 5 m in, 0.1 × SSC,
0.2% SDS for 5 min and twice with 0.1 × SSC.
Data scanning and analysis
Microarray slides were dried and dual channel images
were captured using GenePix 4000B microarray scanner
(Axon Instruments, CA). Automated spot alignment was
augmented with manual checking of each slide to
remove substandard spots. GenePix Pro software (Axon
Instruments, CA) was used for data normalization and
statistical analysis. LIMMA package for R programming
environment was used by applying linear model meth-
ods [67]. Each probe was tested for changes in expres-
sion over the time points usin g a moderated F test,
which is similar to an ANOVA method for each probe
except that the residual standard errors are moderated
across genes [68]. The linear models allow for general
changes in gene expression between successive time
points. The use of dye-swaps in the experimental design
eliminated a dye-effect for each probe, which increased
the precision with which differential expression could be
detected. The computed P values were adjusted for mul-
tiple testing to control the false discovery rate (FDR)
[69]. Genes were considered significantly expressed if
the adjusted P values were <0.01 (i.e. expected FDR less
than 1%).
Gene clustering and categorization
Hierarchical clustering was performed using the statistic
package for R utilizing the Euclidean distance. Figure of
merit (FOM) analysis was performed to determine the
number of clusters needed for the explanation of the
majority of variation in expression pattern s [70]. Then a
cluster number was assigned for K-means clustering
(KMC) analysis to divide the data into distinct expres-
sion clusters based on similarities in their expression
patterns, using the TM4 package [70]. Default statistical
parameters were used in those analyses and data were
scaled for hierarchical and KMC clustering based on
fold-change and log
2
ratio in gene expression. The exist-
ing apple gene annotation was complemented by the
application Blast2Go [71] and further supplemented
with manual BLASTX, conserved domains and literature
searches, mostly based on Arabidopsis database. Using
this combined information, a functionally driven
classification was created manually. Larger categories
were further divided into subcategories to cover all the
related genes.
RT-qPCR
Purified total RNA (1 μg) from each sample was used to
synthesize cDNA in a 20-μ L reaction using the High-
Capacity cDNA Reverse Transcription kit (Applied Bio-
systems, Fosters City, CA). Each qPCR react ion was run
in triplicate using 40 ng of cDNA in a 15-μ l reaction,
using Power SYBR Green qRT-PCR Kit (Applied Biosys-
tems). Gene-specific primer sets were designed from
available apple ESTs sequences using Primer Expression
3.0 and synthesized by Integrated DNA Technologies
(Coralville, IA) [13]. Upon the release of the apple gen-
ome [65], we checked if our qPCR primers were specific
to a single gene or could potentially amplify multiple
gen e family members using BlastN searches. Thos e that
could amplify more than one gene were discarded
(Additional file 7, Table S5). The reactions were per-
formed on a 7500 Real-time PCR Cycler (Applied Bio-
systems, CA). Quantification was achieved using a
relative standard curve derived from a standard RNA
run in parallel with each primer set. A primer set
designed to amplify Malus actin RNA was run on all
samples and used to normalize the data. A dissociation
curve was run to verify that a single desired amplified
product was obtained from each reaction (Applied
Biosystems).
Measurement of leaf photosynthesis efficiency
NAA was directly applied to the leaves of both young
apple seedlings in a growth chamber (21-24°C, 50%
humidity, light-dark cycle of 16:8 h; the seedlings were
treated 4 h after the light cycle began) and mature fruit-
bearing apple trees in the field (4 h after sunrise, full
sunlight). After treatment, the young seedlings and sepa-
rate leaves from the mature trees were collected at
intervals (10 min, 1 h and 5 h for young seedlings; 10
min, 4 h and 1 d for mature trees). Chlorophyll fluores-
cence images (CFI) were taken and Fv/Fm values were
recorded to monitor the changes in PSII efficiency,
using an IMAGING-PAM Fluorometer with Walz Ima-
gingWin software V2.32. F
V
/F
M
values were recorded
three times independ ently from both control and NAA-
affected leaves of fruit-bearing trees in the field.
Additional material
Additional file 1: Supplementary Table S1. Table S1 - Statistically
significant genes derived from apple fruit abscission zone
microarray study.
Additional file 2: Supplementary Figure S1. Figure S1 - Hierarchical
cluster of 722 selected genes from NAA-treated FAZ (A) and 1057
Zhu et al. BMC Plant Biology 2011, 11:138
/>Page 17 of 20
selected genes from shading-treated FAZ (B) from the 40 K apple
microarray. The fold changes in gene expression are scaled from 0.5 to
2.0 to allow clustering by expression pattern, with intense red
representing maximum expression and intense green representing
minimum expression.
Additional file 3: Supplementary Table S2. Table S2 - K-means
clustering for NAA- and shading-treated apple fruit abscission zone
microarray data.
Additional file 4: Supplementary Figure S2. Figure S2 - Clusters of
NAA-responsive genes (A) and shading-responsive genes (B) with
average values (pink line) and standard deviation (grey area) of the
expression levels of the selected genes are presented. In these
diagrams, “y” axis represents log
2
-fold change and “x” axis represents the
different time points for sampling. The cluster names are assigned
upregulated (u), unchanged (o) or downregulated (d) for each time
point.
Additional file 5: Supplementary Table S3. Table S3 - Categorization
of significant genes encoding enzymes with a variety of biological
functions. In this table, eight functional categories of genes showing
differential expression patterns after NAA and shading treatments, from
the array data are presented. A comparative heat map is also included.
The fold change scale is shown at top along with the time points and
gene categories are listed along with the color bars.
Additional file 6: Supplementary Table S4. Table S4 - Summary of
array-measured expression of genes modified at early stages (D1, 3
and 5) after NAA and shading treatments. ‘+’ and ‘-’ signs represent
up- and down-regulation of genes, respectively, while 0 represents no
change.
Additional file 7: Supplementary Table S5. Table S5 - Real-time
qPCR primers. A list of primer sequences and gene accession numbers
used for quantitative polymerase chain reaction studies.
Acknowledgements
This manuscript is dedicated to Dr. Rongcai Yuan, in memory of his
devotion in plant science. He will be greatly missed by those who were
privileged to know him. We would like to thank Dr. Yan Zhang at Virginia
Tech Bioinformatics Institute, for his assistance in the array data analysis. We
also appreciate the technical assistance of David Carbaugh and Grace
Engelman at AREC. This research was supported by a Virginia Agricultural
Council grant to Dr. Yuan.
Author details
1
Alson H. Smith, Jr. Agricultural Research and Extension Center, Virginia
Polytechnic Institute and State University, 595 Laurel Grove Road,
Winchester, VA 22602, USA.
2
Appalachian Fruit Research Station, United
States Department of Agriculture, Agricultural Research Service, Kearneysville,
WV, 25430, USA.
3
Department of Horticulture, Virginia Polytechnic Institute
and State University, Blacksburg, VA 24061, USA.
Authors’ contributions
RY conceived the project, acquired the funding and designed the
experiment. HZ participated in the experimental design, carried out chemical
treatments and array experiment, conducted data analyses and prepared the
manuscript. CDD participated in the experimental design, oversaw the data
analyses and edited the manuscript. EPB and AMC participated in the results
discussions and provided extensive intellectual suggestion for the
manuscript organization and writing. RX contributed to the experimental
design and array data analyses. All authors critically read and approved the
final version of the manuscript.
Received: 19 June 2011 Accepted: 17 October 2011
Published: 17 October 2011
References
1. Hennerty MJ, Forshey CG: Tree physiological condition as a source of
variation in chemical thinning of apple fruits. HortScience 1972, 7:259-260.
2. Bangerth F: Abscission and thinning of young fruit and thier regulation
by plant hormones and bioregulators. Plant Growth Regul 2000, 31(1-
2):43-59.
3. Dennis FG: Mechanisms of action of apple thinning chemicals.
HortScience 2002, 37(3):471-474.
4. Stopar M, Black BL, Bukovac MJ: The effect of NAA and BA on carbon
dioxide assimilation by shoot leaves of spur-type ‘Delicious’ and ‘Empire’
apple trees. J Amer Soc Hort Sci 1997, 122(6):837-840.
5. Yuan RC, Greene DW: Benzyladenine as a chemical thinner for ‘McIntosh’
apples. I. Fruit thinning effect1s and associated relationships with
photosynthesis, assimilate translocation, and nonstructural
carbohydrates. J Amer Soc Hort Sci 2000, 125(2):169-176.
6. Schneider GW: Abscission Mechanism Studies with Apple Fruitlets. J Amer
Soc Hort Sci 1978, 103(4):455-458.
7. Yuan RC, Greene DW: Benzyladenine as a chemical thinner for ‘McIntosh’
apples. II. Effects of benzyladenine, bourse shoot tip removal, and leaf
number on fruit retention. J Amer Soc Hort Sci 2000, 125(2):177-182.
8. Byers RE: Flower and fruit thinning and vegetative: Fruiting balance. In
Apples: Botany, production and uses. Edited by: Ferree DC, Warrington IJ.
New York, CABI Publishing; 2003:409-436.
9. Quinlan JD, Preston AP: Influence of Shoot Competition on Fruit
Retention and Cropping of Apple Trees. J Hortic Sci Biotech 1971,
46(4):525-534.
10. Curry EA: Naa-Induced Ethylene and Acc in Delicious Spur Tissues -
Changes with Temperature and Time. J Amer Soc Hort Sci 1991,
116(5):846-850.
11. McArtney SJ: Ethylene evolution from detached apple spurs in response
to chemical thinners. HortScience 2002, 37(4):662-665.
12. Dal Cin V, Danesin M, Boschetti A, Dorigoni A, Ramina A: Ethylene
biosynthesis and perception in apple fruitlet abscission (Malus
domestica L. Borhk). J Exp Bot 2005, 56(421):2995-3005.
13. Zhu H, Beers EP, Yuan RC: Aminoethoxyvinylglycine Inhibits Fruit
Abscission Induced by Naphthaleneacetic Acid and Associated
Relationships
with Expression of Genes for Ethylene Biosynthesis,
Perception, and Cell Wall Degradation in ‘Delicious’ Apples. J Amer Soc
Hort Sci 2008, 133(6):727-734.
14. Yuan R: Effects of temperature on fruit thinning with ethephon in
‘Golden Delicious’ apples. Sci Hort 2007, 113(1):8-12.
15. Williams RR, Flook VA: The Mode of Action of the Hormone Apple Fruit-
Setting Mixture Pp-341b Applied to Cox Orange Pippin. J Hort Sci 1980,
55(3):275-277.
16. Li JG, Yuan RC: NAA and ethylene regulate expression of genes related
to ethylene biosynthesis, perception, and cell wall degradation during
fruit abscission and ripening in ‘Delicious’ apples. J Plant Growth Regul
2008, 27(3):283-295.
17. Meir S, Philosoph-Hadas S, Sundaresan S, Selvaraj KSV, Burd S, Ophir R,
Kochanek B, Reid MS, Jiang CZ, Lers A: Microarray Analysis of the
Abscission-Related Transcriptome in the Tomato Flower Abscission Zone
in Response to Auxin Depletion. Plant Physiol 2010, 154(4):1929-1956.
18. Bonghi C, Tonutti P, Ramina A: Biochemical and molecular aspects of
fruitlet abscission. Plant Growth Regul 2000, 31(1-2):35-42.
19. Lashbrook CC, Cai S: Cell wall remodeling in Arabidopsis stamen
abscission zones. Plant Signal Behav 2008, 3(9):733-736.
20. Lashbrook CC, Gonzalezbosch C, Bennett AB: 2 Divergent Endo-Beta-1,4-
Glucanase Genes Exhibit Overlapping Expression in Ripening Fruit and
Abscising Flowers. Plant Cell 1994, 6(10):1485-1493.
21. Ward DL, Beers EP, Byers RE, Marini RP: Cutting apple fruits induces
cellulase activity in the abscission zone. HortScience 1999, 34(4):601-603.
22. Belfield EJ, Ruperti B, Roberts JA, McQueen-Mason S: Changes in expansin
activity and gene expression during ethylene-promoted leaflet
abscission in Sambucus nigra. J Exp Bot 2005, 56(413):817-823.
23. Kim J, Patterson S: Expression divergence and functional redundancy of
polygalacturonases in floral organ abscission. Plant Signal Behav 2006,
1(6):281-283.
24. Dardick C: Comparative expression profiling of Nicotiana benthamiana
leaves systemically infected with three fruit tree viruses. Mol Plant
Microbe Interact 2007, 20(8):1004-1017.
25. Rolland F, Baena-Gonzalez E, Sheen J: Sugar sensing and signaling in
plants: Conserved and novel mechanisms.
Annu Rev Plant Biol 2006,
57:675-709.
Zhu et al. BMC Plant Biology 2011, 11:138
/>Page 18 of 20
26. Hanson J, Smeekens S: Sugar perception and signaling - an update. Curr
Opin Plant Biol 2009, 12(5):562-567.
27. Fernandez O, Bethencourt L, Quero A, Sangwan RS, Clement C: Trehalose
and plant stress responses: friend or foe? Trends Plant Sci 2010,
15(7):409-417.
28. Weaver LM, Gan SS, Quirino B, Amasino RM: A comparison of the
expression patterns of several senescence-associated genes in response
to stress and hormone treatment. Plant Mol Biol 1998, 37(3):455-469.
29. Yang JC, Zhang JH, Wang ZQ, Zhu QS, Liu LJ: Involvement of abscisic acid
and cytokinins in the senescence and remobilization of carbon reserves
in wheat subjected to water stress during grain filling. Plant Cell Environ
2003, 26(10):1621-1631.
30. Kizis D, Lumbreras V, Pages M: Role of AP2/EREBP transcription factors in
gene regulation during abiotic stress. FEBS Lett 2001, 498(2-3):187-189.
31. Dietz KJ, Vogel MO, Viehhauser A: AP2/EREBP transcription factors are
part of gene regulatory networks and integrate metabolic, hormonal
and environmental signals in stress acclimation and retrograde
signalling. Protoplasma 2010, 245(1-4):3-14.
32. Mao L, Begum D, Chuang HW, Budiman MA, Szymkowiak EJ, Irish EE,
Wing RA: JOINTLESS is a MADS-box gene controlling tomato flower
abscission zone development. Nature 2000, 406(6798):910-913.
33. Buchanan-Wollaston V, Page T, Harrison E, Breeze E, Lim PO, Nam HG,
Lin JF, Wu SH, Swidzinski J, Ishizaki K, et al: Comparative transcriptome
analysis reveals significant differences in gene expression and signalling
pathways between developmental and dark/starvation-induced
senescence in Arabidopsis. Plant J 2005, 42(4):567-585.
34. Cai SQ, Lashbrook CC: Stamen abscission zone transcriptome profiling
reveals new candidates for abscission control: Enhanced retention of
floral organs in Transgenic plants overexpressing Arabidopsis ZINC
FINGER PROTEIN2. Plant Physiol 2008, 146(3):1305-1321.
35. Wagstaff C, Yang TJW, Stead AD, Buchanan-Wollaston V, Roberts JA: A
molecular and structural characterization of senescing Arabidopsis
siliques and comparison of transcriptional profiles with senescing petals
and leaves. Plant J 2009, 57(4):690-705.
36. Lee YP, Yu GH, Seo YS, Han SE, Choi YO, Kim D, Mok IG, Kim WT, Sung SK:
Microarray analysis of apple gene expression engaged in early fruit
development. Plant Cell Rep 2007, 26(7):917-926.
37. Janssen BJ, Thodey K, Schaffer RJ, Alba R, Balakrishnan L, Bishop R,
Bowen JH, Crowhurst RN, Gleave AP, Ledger S, et al: Global gene
expression analysis of apple fruit development from the floral bud to
ripe fruit. BMC Plant Biol 2008, 8:16.
38. Zhou C, Lasko AN, Robinson TL, Gan S: Isolation and characterization of
genes associated with shade-induced apple abscission. Mol Genet
Genomics 2008, 280(1):83-92.
39. Botton A, Eccher G, Forcato C, Ferrarini A, Begheldo M, Zermiani M,
Moscatello
S, Battistelli A, Velasco R, Ruperti B, et al: Signaling pathways
mediating the induction of apple fruitlet abscission. Plant Physiol 2011,
155(1):185-208.
40. Dal Cin V, Velasco R, Ramina A: Dominance induction of fruitlet shedding
in Malus × domestica (L. Borkh): molecular changes associated with
polar auxin transport. BMC Plant Biol 2009, 9:139.
41. Zhu H, Yuan R, Greene DW, Beers EP: Effects of 1-methylcyclopropene
and napththaleneacetic acid on fruit set and expression of genes
related to ethylene biosynthesis and perception and cell wall
degradation in apple. J Amer Soc Hort Sci 2010, 135(5):402-409.
42. Cline MG: Apical dominance. Bot Rev 1991, 57:318-358.
43. Taylor JE, Whitelaw CA: Signal in abscission. New Phytologist 2001,
151:323-339.
44. Petrasek J, Mravec J, Bouchard R, Blakeslee JJ, Abas M, Seifertova D,
Wisniewska J, Tadele Z, Kubes M, Covanova M, et al: PIN proteins perform
a rate-limiting function in cellular auxin efflux. Science 2006,
312(5775):914-918.
45. Blakeslee JJ, Bandyopadhyay A, Lee OR, Mravec J, Titapiwatanakun B,
Sauer M, Makam SN, Cheng Y, Bouchard R, Adamec J, et al: Interactions
among PIN-FORMED and P-glycoprotein auxin transporters in
Arabidopsis. Plant Cell 2007, 19(1):131-147.
46. Gomez-Cadenas A, Mehouachi J, Tadeo FR, Primo-Millo E, Talon M:
Hormonal regulation of fruitlet abscission induced by carbohydrate
shortage in citrus. Planta 2000, 210(4):636-643.
47. Wingler A, Roitsch T: Metabolic regulation of leaf senescence: interactions
of sugar signalling with biotic and abiotic stress responses. Plant Biol
(Stuttg) 2008, 10(Suppl 1):50-62.
48. Untiedt R, Blanke M: Effects of fruit thinning agents on apple tree canopy
photosynthesis and dark respiration. Plant Growth Regul 2001, 35(1):1-9.
49. Loescher W, Marlow GC, Kennedy RA: Sorbitol metabolism and source-
sink interactions in developing apple leaves. Plant Physiol 1982,
70(2):335-339.
50. Jang JC, Leon P, Zhou L, Sheen J: Hexokinase as a sugar sensor in higher
plants. Plant Cell 1997, 9(1):5-19.
51. Moore B, Zhou L, Rolland F, Hall Q, Cheng WH, Liu YX, Hwang I, Jones T,
Sheen J: Role of the Arabidopsis glucose sensor HXK1 in nutrient, light,
and hormonal signaling. Science 2003, 300(5617):332-336.
52. Dai N, Schaffer A, Petreikov M, Shahak Y, Giller Y, Ratner K, Levine A,
Granot D: Overexpression
of Arabidopsis hexokinase in tomato plants
inhibits growth, reduces photosynthesis, and induces rapid senescence.
Plant Cell 1999, 11(7):1253-1266.
53. Yamaguchi H, Kanayama Y, Soejima J, Yamaki S: Changes in the amounts
of the NAD-dependent sorbitol dehydrogenase and its involvement in
the development of apple fruit. J Amer Soc Hort Sci 1996, 121(5):848-852.
54. Beruter J, Feusi MES, Ruedi P: Sorbitol and sucrose partitioning in the
growing apple fruit. J Plant Physiol 1997, 151(3):269-276.
55. Ho LC: Metabolism and Compartmentation of Imported Sugars in Sink
Organs in Relation to Sink Strength. Annu Rev Plant Physiol Plant Mol Biol
1988, 39:355-378.
56. Sakanishi K, Kanayama Y, Mori H, Yamada K, Yamaki S: Expression of the
gene for NADP-dependent sorbitol-6-phosphate dehydrogenase in
peach leaves of various developmental stages. Plant Cell Physiol 1998,
39(12):1372-1374.
57. Brown CS, Young E, Pharr DM: Rootstock and Scion Effects on the
Seasonal Distribution of Dry-Weight and Carbohydrates in Young Apple-
Trees. J Amer Soc Hort Sci 1985, 110(5):696-701.
58. Lo Bianco R, Rieger M, Sung SJS: Effect of drought on sorbitol and
sucrose metabolism in sinks and sources of peach. Physiol Plant 2000,
108(1):71-78.
59. Kanayama Y, Moriguchi R, Deguchi M, Kanahama K, Yamaki S: Effect of
environmental stresses and abscisic acid on sorbitol-6-phosphate
dehydrogenase expression in Rosaceae fruit trees. ISHS Acta Hort 2007,
738:375-381.
60. Sexton R, Roberts JA: Cell Biology of Abscission. Annu Rev Plant Physiol
Plant Mol Biol 1982, 33:133-162.
61. Osborne DJ: Auxin and ethylene and the control of cell growth.
Identification of three classes of target cells. In Plant growth regulation.
Edited by: Pilet P. Berlin, Springer-Verlag; 1976:161-171.
62. Chen F, Bradford KJ: Expression of an expansin is associated with
endosperm weakening during tomato seed germination. Plant Physiol
2000, 124(3):1265-1274.
63. Tonutti P, Cass LG, Christoffersen RE: The Expression of Cellulase Gene
Family Members during Induced Avocado Fruit Abscission and Ripening.
Plant Cell Environ 1995, 18(6):709-713.
64. Wakasa Y, Kudo H, Ishikawa R, Akada S, Senda M, Niizeki M, Harada T: Low
expression of an endopolygalacturonase gene in apple fruit with long-
term storage potential. Postharvest Biol Technol 2006, 39(2):193-198.
65. Velasco R, Zharkikh A, Affourtit J, Dhingra A, Cestaro A, Kalyanaraman A,
Fontana P, Bhatnagar SK, Troggio M, Pruss D, et al: The genome of the
domesticated apple (Malus × domestica Borkh.). Nat Genet 2010,
42(10):833-839.
66. Soria-Guerra R, Rosales-Mendoza S, Gasic K, Band M, Wisniewski ME,
Korban SS: Gene
expression is highly regulated in early developing fruit
of apple. Plant Mol Biol Rep 2011.
67. Gentleman RC, Carey VJ, Bates DM, Bolstad B, Dettling M, Dudoit S, Ellis B,
Gautier L, Ge YC, Gentry J, et al: Bioconductor: open software
development for computational biology and bioinformatics. Genome Biol
2004, 5(10):R80.
68. Smyth GK: Linear models and empirical bayes methods for assessing
differential expression in microarray experiments. Stat Appl Genet Mol Biol
2004, 3, Article 3
69. Benjamini Y, Hochberg Y: Controlling the False Discovery Rate - a
Practical and Powerful Approach to Multiple Testing. J Roy Stat Soc B Met
1995, 57(1):289-300.
Zhu et al. BMC Plant Biology 2011, 11:138
/>Page 19 of 20
70. Saeed AI, Sharov V, White J, Li J, Liang W, Bhagabati N, Braisted J, Klapa M,
Currier T, Thiagarajan M, et al: TM4: A free, open-source system for
microarray data management and analysis. Biotechniques 2003,
34(2):374-378.
71. Conesa A, Gotz S, Garcia-Gomez JM, Terol J, Talon M, Robles M: Blast2GO:
A universal tool for annotation, visualization and analysis in functional
genomics research. Bioinformatics 2005, 21(18):3674-3676.
doi:10.1186/1471-2229-11-138
Cite this article as: Zhu et al.: Transcriptomics of shading-induced and
NAA-induced abscission in apple (Malus domestica) reveals a shared
pathway involving reduced photosynthesis, alterations in carbohydrate
transport and signaling and hormone crosstalk. BMC Plant Biology 2011
11:138.
Submit your next manuscript to BioMed Central
and take full advantage of:
• Convenient online submission
• Thorough peer review
• No space constraints or color figure charges
• Immediate publication on acceptance
• Inclusion in PubMed, CAS, Scopus and Google Scholar
• Research which is freely available for redistribution
Submit your manuscript at
www.biomedcentral.com/submit
Zhu et al. BMC Plant Biology 2011, 11:138
/>Page 20 of 20