báo cáo khoa học: "Association analysis of frost tolerance in rye using candidate genes and phenotypic data from controlled, semi-controlled, and field phenotyping platforms" potx
Bạn đang xem bản rút gọn của tài liệu. Xem và tải ngay bản đầy đủ của tài liệu tại đây (655 KB, 14 trang )
RESEARCH ARTICLE Open Access
Association analysis of frost tolerance in rye using
candidate genes and phenotypic data from
controlled, semi-controlled, and field
phenotyping platforms
Yongle Li
1†
, Andreas Böck
2†
, Grit Haseneyer
1
, Viktor Korzun
3
, Peer Wilde
3
, Chris-Carolin Schön
1
, Donna P Ankerst
4
and Eva Bauer
1*
Abstract
Background: Frost is an important abiotic stress that limits cereal production in the temperate zone. As the most
frost tolerant small grain cereal, rye (Secale cereale L.) is an ideal cereal model for investigating the genetic basis of
frost tolerance (FT), a complex trait with polygenic inheritance. Using 201 genotypes from five Eastern and Middle
European winter rye populations, this study reports a multi-platform candidate gene-based association analysis in
rye using 161 single nucleotide polymorphisms (SNPs) and nine insertion-deletion (Indel) polymorphisms previously
identified from twelve candidate genes with a putative role in the frost responsive network.
Results: Phenotypic data analyses of FT in three different phenotyping platforms, control led, semi-controlled and
field, revealed significant genetic variations in the plant material under study. Statistically significant (P < 0.05)
associations between FT and SNPs/haplotypes of candidate genes wer e identified. Two SNPs in ScCbf15 and one in
ScCbf12, all leading to amino acid exchanges, were significantly associated with FT over all three phenotyping
platforms. Distribution of SNP effect sizes expressed as percentage of the genetic variance explained by individual
SNPs was highly skewed towards zero with a few SNPs obtaining large effects. Two-way epistasis was found
between 14 pairs of candidate genes. Relatively low to medium empirical correlations of SNP-FT associations were
observed across the three platforms underlining the need for multi-level experimentation for dissecting complex
associations between genotypes and FT in rye.
Conclusions: Candidate gene based-association studies are a powerful tool for investigating the genetic basis of
FT in rye. Results of this study support the findings of bi-parental linkage mapping and expression studies that the
Cbf gene family plays an essential role in FT.
Background
Frost stress, one of the important abiotic stresses, not
only limits the geographic distribution of crop produc-
tion but also adversely affects crop development and
yield through cold-induced desiccation, cellular damage
and inhibition of metabolic reactions [1,2]. Thus, crop
varieties with improved t olerance to frost are of enor-
mous value for countries with severe winters. Frost tol-
erance (FT) is one of the most critical traits that
determine winter survival of winter cereals [3]. Among
small grain cereals rye (Secale cereale L.) is the most
frost tolerant species and thus can be used as a cereal
model for studying and improving F T [4,5]. After cold
acclimation where plants are exposed to a period of low,
but nonfreezing temperature, the most frost tolerant rye
cultivar can survive under severe frost stress down to
approxi mately -30°C [6]. Tests for evaluating FT can be
generally separated into direct and indirect approaches.
For direct approaches, where plants are exp osed to both
cold acclimation and freezing tests, plant survival rate,
leaf damage, regeneration of the plant cr own, electrolyte
leakage, and chlorophyll fluorescence are often used as
* Correspondence:
† Contributed equally
1
Plant Breeding, Technische Universität München, Freising, Germany
Full list of author information is available at the end of the article
Li et al. BMC Plant Biology 2011, 11:146
/>© 2011 Li et al; licensee BioMed Central Ltd. This is an Open Access article distributed under the terms of the Creative Commons
Attribution License ( which permits unrestrict ed use, distribution, and reproduction in
any medium, provided the origina l work is properly cited.
phenotypic endpoints [3]. For indirect approaches, where
plants are exposed to only cold acclimation, the e nd-
points of water content [7], pro line [8], and cold-induced
proteins [9] are often used. The evaluation of FT can be
conducted either naturally under field conditions or arti-
ficially in growth chambers, with both methods asso-
ciated with advantages and disadvantages. Under field
conditions, plant damage during winter is not only
affected by low temperature stress per se,butalsobythe
interaction of a range of factors such as sn ow coverage,
water supply, and wind. Therefore, measured phenotypes
are the result of the full range of factors affecting winter
survival. Opportunities for assessing FT are highly depen-
dent upon temperature and weather c onditions during
the experiment. In contrast, frost tests in growth cham-
bers allow for a better control of environmental variation
and are not limited to one trial per yea r. How ever, they
are limited in capacity and may not correlate well with
field performance. Therefore, it has been recommended
to test FT under both natural and c ontrolled conditions
whenever possible [3].
FT is a complex trait with polygenic inheritance [6]. A
large number of genes are up-and down-regulated when
plants are exposed to cold/frost stress. Transcriptome
analyses have estimated between 14% and 45% of the
Arabidopsis genome to be cold responsive, dependent
upon the cold treatment and other experimental factors
[10-12]. Studies in wheat have shown between 5% and
8% of transcripts represented on microarrays to be regu-
lated under cold stress [13,14]. More than 70 Cold
Responsive (COR)genesinArabidopsis are directly
involved in cold/frost response with various functions
such as enhancement of antioxidative mechanisms or
stabilization of cellular membranes against dehydration
damage [15,16]. The dehydrin gene family (Dhn1-13)is
one gro up among the COR genes that has been charac-
terized in barley [17]. Six members of the dehydrin gene
family, including HvDhn1 and HvDhn3,wereinduced
under mild frost stress in barley [18]. Expression o f
COR genes under cold stress in Arabidopsis is regulated
through the binding of the C-repeat binding factor (Cbf)
gene family to the cis-regulatory element DRE/CRT pre-
sent in the promoter region of COR genes [2,19]. Most
members of the Cbf gene family are closely linked and
map to the Fr2 locus on homoeologous group 5, which
coincides with a major quantitative trait locus (QTL) for
FT in barley, diploid and hexaploid wheat, and meadow
fescue [20-23]. Twelve members of the Cbf gene family
have been assigned to the long arm of chromosome 5R
in rye [24]. There is evidence that several members of
the Cbf gene family are up-regulated by the transcrip-
tion factor Inducer of Cbf Expression 2 (Ice2) under frost
stress in hexaploid wheat and Arabidopsis [25,26]. Meta-
bolite profiling in Arabidopsis has revealed between 311
(63%) and 434 (75%) metabolites altered in response to
cold [27,28]. Among these, glucose, galactose, fructose,
raffinose, sucrose, and xylose are involved in central car-
bohydrate metabolism and play a prominent role during
reprogramming of metabolism under cold stress.
Identification of genes underlying traits of agronomic
interest is pivotal for genome-based breeding. Due to
methodological advances in molecular biology, plant
breeders can now select varieties with favorable a lleles
via molecular markers, including single nucleotide poly-
morphisms (SNPs), identifi ed in genes linked to desir-
able traits [29,30]. Whole-genome and candidate gene-
based association studies have identified large numbers
of genomic regions and individual genes related to a
range of traits [31-34]. How ever, underlying population
structure and/or familial relatedness (kin ship) between
genotypes under study have proven to be a big chal-
lenge, leading to false positive associations between
molecular markers and traits in plants due to the heavily
admixed nature of plant populations [35]. In response,
several advanced stati stica l approaches have been devel-
oped for genotype-phenotype association studies, includ-
ing genomic control [ 36], structured association [37],
and linear mixed model-based methodologies [38,39].
The latter estimates population structure via a structure
matrix and familial relatedness via a kinship matrix in a
fir st step, and then includes these as covariates in a lin-
ear mixed model comprising the second step, thus arriv-
ing at phenotype-genotype association studies adjusting
for population structure and kinship.
The main objective of this study was to identify SNP
alleles and haplotypes conferring superior FT through
candidate gene-based association studies performed in
three phenotyping platforms, controlled, semi-controlled
and field.
Methods
Plant material and DNA extraction
Plant material was derived from four Eastern and one
Middle European cross-pollinated winter rye breeding
populations: 44 plants from EKOAGRO (Poland), 68
plants from Petkus (Germany), 33 plants from PR 2733
(Belarus), 41 plants from ROM103 (Pol and), and 15
plants from SMH2502 (Poland). To determine haplotype
phase, gamete capture was performed by crossing
between 15 and 68 plants of each source populatio n to
the same self-fertile inbred line, Lo152. Each resulting
heterozygous S
0
plant represented one g amete of the
respective source population. S
0
plants were selfed to
obtain S
1
families and these were subsequently selfed to
produce S
1:2
families, which were used in pheno typing
experiment s. For molecularanalyses,genomicDNAof
S
0
plants was extracted from leaves according to a pro-
cedure described previously [40].
Li et al. BMC Plant Biology 2011, 11:146
/>Page 2 of 14
Phenotypic data assessment and analyses
FT was measured in three phenotyping platforms: con-
trolled, semi-controlled, and field. In the controlled plat-
form, experiments were performed in climate chambers
at -19°C and -21°C, in 2008 and 2009, respectively, at
ARI Martonvásár (MAR), Hungary, using established
protocols [41]. Briefly, seedlings were cold-acclimated in
a six week hardening program with gradually decreasing
temperatures from 15°C to -2°C. After that, plants were
exposed to freezing temperatures within six days by
decreasing the temperature from -2°C to -19°C or -21°C
and then held at the lowest temperature for eight hours.
After the freezing step, temperature was gradually
increased to 17°C for regeneration. The ability of plants
to re-grow was measured after two weeks using a recov-
ery score, which ranged on a scale from 0: completely
died, 1: little sign of life, 2: i ntensive damage, 3: moder-
ate damage, 4: sm all damage, to 5: no damage. The light
intensity was 260 μmol/m
2
s during the seedling growth
and the hardening process, whereas the freezing cycle
was carried out in dark. The experiment in 2008 con-
tained 139 S
1
families. The experiment in 2009 con-
tained 201 S
1:2
families, augmenting the same 139 S
1
families from the experiment in 2008 with an additional
62 S
1:2
families. Five plants of each S
1
or S
1:2
family
were grown as one test unit with five replicates per tem-
perature and year. Due to the limited capacity of climate
chambers, genotypes were rand omly assig ned into three
and four chambers in 2008 and 2009, respectively.
In the semi-controlled platform, experiments in the
two years 2008 and 2009 were performed with 3 repli-
cates per year at Oberer Lindenhof (OLI), Germany,
using the same 139 S
1
families and 201 S
1:2
families.
From each family a test unit of 25 plants was grown
outdoors in wooden boxes one meter above the ground
in a randomized complete block design (RCBD). In case
of snowfall, plants were protected from snow coverage
to avoid damage by snow molds. Two weeks after a
frost period of 2-4 weeks with average daily tempera-
tures around or below 0°C and usually frost at least dur-
ing night with minimum temperatures as indicated in
Additional File 1, % leaf damage was scored as the pro-
portion of the 25 plants of each family that showed leaf
damage (dry and yellow leaves). In order to keep the
same sign as with the measurements in the controlled
and field platforms, % leaf damage was replaced by %
plants with undamaged leaves, calculated as 100% - %
leaf damage. Outcomes were recorded in January, Feb-
ruary, and April of 2008 for the 139 S
1
families, and in
February and March of 2009 for the 201 S
1:2
families.
In the field platform, experiments were performed
with the same 201 S
1:2
families in five environments in
2009 (Kasan, Russi a, KAS; Lipezk, Russia, LIP1; Minsk,
Belarus, MIN; Saskatoon, Canada, two different fields,
SAS1 and SAS2), and in one environment in 2010
(Lipezk, Russia, LIP2). Depending on the environment
test units comprised 50-100 plants. The outcome, % sur-
vival, was calculated as the number of intact plants after
winter divided by the total number of germinate d plants
before winter. RCBDs with 2 replicates were used for
the SAS1 and SAS2 environments, while all other envir-
onments used the lattice design with 3 replicates. The
climate data of the semi-controlledandfieldplatforms
are provided in Additional file 1.
To test phenotypic variation between genotypes, the
same platform-specific models to be described for the
SNP-FT association analyses were fitted for each plat-
form omitting the SNP and p opulation structure fixed
effects. Within the controlled platform, separate models
were fitted for each temperature and year combination,
for the semi-controlled platform, separate models were
fitted for each month of each year, and for the field
platform separate models were fitted for each geo-
graphic location. The genetic variation was reported as
the variance component corresponding to the random
genot ype effect in each model, with a P-value computed
using the likelihood ratio test (LRT), a conservative esti-
mate since the true asymptotic distribution of the LRT
is a mixture of chi-square distributions [42].
Population structure and kinship
In orde r to correct for confounding effects in the asso-
ciation studies, population structure and kinship was
estimated based on 37 simple sequence repeat (SSR)
markers that were chosen due to their experimental
quality and map location as providing good coverage of
the rye genome; details are found in [43]. Primers and
PCR conditions were described in detail by Khlestkina
et al. [44] for rye microsatellit e site (RMS) markers and
by Hackauf and Wehling [45] for Secale cereale microsa-
tellite (SCM) markers. Fragments were separated on an
ABI 3130xl Genetic Analyzer (Applied Biosystems Inc.,
Foster City, CA, USA) and allel e sizes were assigned
using the program GENEMAPPER (Applied Biosystems
Inc., Foster City, CA, USA). Population structure was
inferred from the 37 SSR markers using the STRUC-
TURE software v2.2, which is based on a Bayesian
model-based clustering algorithm that incorpo rates
admixture and allele correlation models to account for
genetic material exchange in populations resulting in
shared ancestry [46]. Brief ly, the method assi gned each
individual to a predetermined number of groups (k)
characterized by a set of allele frequencies at each locus,
assuming that the loci are in Hardy-Weinberg equili-
brium and linkage equilibrium. Ten runs for values of k
ranging from two to eleven were performed using a
burn-in period of 50,000 replications followed by 50,000
Markov Chain Monte Carlo iterations. Posterior
Li et al. BMC Plant Biology 2011, 11:146
/>Page 3 of 14
probabilities of each k were averaged over the ten runs
to determine the maximum posteriori k. The population
structure matrix Q
STRUCTURE
was estimated, providing
for each of the 201 genotypes an estimate of the mem-
bershipfractioninthek populations. The kinship
matrix (K) was estimat ed from the same SSR markers
using the allele-similarity method [47], which guarantees
a positive semi-definite relationship matrix among the
201 genotypes, and was used for the covariance struc-
ture of the random genotype effects in the linear mixed
model. For a given locus, the similarity index S
xy
between two genotypes was 1 when alleles were identi-
cal and 0 when alleles were diff erent. S
xy
was averaged
over the 37 loci and transformed and standardized as
Ŝ
xy
=(S
xy
- S
xymin
)/(1 - Ŝ
xymin
), where Ŝ
xymin
is the mini-
mum relationship in the matrix.
SNP-FT association analyses
Twelve candidate genes ScCbf2, ScCbf6, ScCbf9b,
ScCbf11, ScCbf12, ScCbf1 4, ScCbf15, ScDhn1, ScDhn3,
ScDreb2, ScIce2,andScVrn1 were selected for analysis
due to their putative role in the FT network
[17,20,24,25,48]. Details on candidate gene sequencing,
SNP and insertion-deletion (Indel) detection, haplotype
structure and linkage disequilibrium (LD) were
described earlier [43] except for ScDreb2,whichis
described in Additional file 2. Indels were treated as sin-
gle polymorphic sites, and for convenience polymorphic
sitesalongthesequenceineachgenewerenumbered
starting with “ SNP1” and are referred to in t he text as
SNPs instead of differentiating between SNPs and
Indels.
SNP-FT associations in all platforms were performed
using liner mixed models that e valuated the effects of
SNPs with minor allele frequencies (MAF) > 5% indivi-
dually, adjusting for population structure, kinship and
platform -specific effects. A one stage approach was cho-
sen for analysis which directly models the phenotypic
raw data as the response. The general form of the linear
mixed model for the three platforms was:
y
=
β
1
+X
SNP
β
SNP
+Q
S
TR
UC
T
U
RE
β
STRUCTURE
+X
PLA TFORM
β
PLA T FORM
+Z
PLA TFORM
γ
PLA T FORM
+Z
GENOTYPE
γ
GENOTYPE
+ε
,
where y is the n × 1 vector of platform-specific pheno-
types, X
SNP
(n × p), Q
STRUCTURE
(n × q) and X
PLATFORM
(n × k) are design matrices for the fixed effects of SNPs,
population membership and platform, respectively, and
Z
PLATFORM
(n × m)andZ
GENOTYPE
(n × l)arethecor-
responding design matrices for the random effects of
platform (described in detail below) and genotype,
respectively, b
1
is the intercept, b
SNP
is the allelic effect
of the non-reference compared to reference allele
(Lo152), and b
STRUCTURE
and b
PLATFORM
are the asso-
ciated fixed effects for population structure and the
platform-specific effects, respectively. If a platform con-
tained random effects, these were accommodated by
including a random effect g
PLATFORM
~N(0,Ds
2
)with
mean of 0, and variance-covariance matrix D.Theran-
dom genotype effect was similarly assumed to follow a
Normal distribution, g
GENOTYPE
~N(0,K s
2
g
), where K
was the estimated kinship matrix and s
2
g
the variance
component due to genotype. In order to account for
kinship in the estimation of random genotype effects,
g
GENOTYPE
, the design matrix Z
GENOTYPE
was multiplied
by the cholesky-root of the kinship matrix. The residual
error ε was assumed to comprise independent and iden-
tically distributed random Normal errors with mean of
0 and variance s
2
, ε ~ N (0, Is
2
).
Analyses of marker-FT associations were performed
using the lme4 package [49] implemented in R [50]. Sig-
nificance of indivi dual SNP effe cts was assessed via the
t-statistic perfor med at the two-sided alpha = 0.05 level.
A multiple testing problem arises, which inflates the
falsepositiverateofthestudy.Asimpleandcommon
waytohandlethisproblemis Bonferroni correction
where the significance level is divided by the number of
tests. However, the Bonferroni correction is too conser-
vative and only suitable for independent tests, an
assumption violated in this study due to a high LD
between some of the SNPs as shown previously [43].
Therefore, the less stringent significance level of alpha =
0.05 is reported in the paper in order to retain candi-
dates for further validation in upcoming experiments.
The exact P-v alues are available in the Additional file 3
and can be adjusted for multiple testing. Empirical cor-
relations between the 170 SNP-FT associations reported
among the three phenotyping platforms were performed
using Pearson’ s correlation based on the t values from
the corresponding association tests. The genetic varia-
tion explained by an individual SNP or haplotype was
calculated as 100 × ((s
2
g
- s
2
gSNP
)/s
2
g
), where s
2
g
is the
gen etic variation in the reduced model with out an indi-
vidual SNP and s
2
gSNP
is the mode l including an indivi-
dual SNP [51]. This ad-hoc measure can r esult in
negative estimates since variance components do not
automatically decrease with more adjustment in a model
as error sums of squares do; negative estimates were
truncated to zero.
Controlled platform analyses
The o utcome vector y was recove ry score and the plat-
form specific effect, b
PLATFORM
included the two years
of measurement, 2008 and 2009, and two temperatures,
-19 and -21°C. A common platform-specific random
effect controlling for the seven chambers across the tw o
years 2008 and 2009 was included in the model, g
PLAT-
FORM
~ N (0, Is
2
chamber
), as it provided a more parsimo-
niou s model with the same goodness-of-fit as compared
Li et al. BMC Plant Biology 2011, 11:146
/>Page 4 of 14
to a nested random effect structure within year. No
additional explicit generation adjustment for S
1
versus
S
1:2
families was included in the statistical model as
these were confounded with the fixed effect adjustment
for year and the random chamber effects, and hence
could not be additionally estimated. In other words, the
generation effec t was assumed implicitl y adjusted for by
other year effects in the model.
Semi-controlled platform analyses
The outcome vector y was % plants with undamaged
leaves measured repeatedly over three months (January,
February, and April) in 2008 and two months (February,
March) in 2009. Linear mixed models were formulated
for individual test units, each comprising approximately
25 plants. The platform-specific fixed effect vector,
b
PLATFORM
, included three terms: a year effect, an overall
linear trend in time for the three months in 2008 and
two months in 2009, and the interaction of year and lin-
ear trend in time. Three platform-specific random
effects (vector g
PLATFORM
) were used: replication, a ran-
dom intercept and a random trend with month. The
replication random effect was assumed uncorrelated
with the random intercept and trend.
Field platform analyses
The outcome vector y was % survival and the platform-
specific fixed effect b
PLATFORM
included indicator vari-
ables for the six environments, five environments in
2009 and one in 2010. Platform-specific random effects
included a block effect nested within environments aris-
ing from the lattice design.
Haplotype-FT association analyses and gene × gene
interaction
Haplotype phase was determined by subtracting the
common parent Lo152 alleles and haplotypes were
defined within each candidate gene using DnaSP v5.10
[52]. Haplotype-FT associations were per formed using
candidate gene haplotypes with MAF > 5%. The same
platform -specific statistical models controlling for popu-
lation structure, kinship, and platform-specific effects
were used to test associations between haplotypes of the
respective candidate genes and FT. For these analyses
b
hap
replaced b
SNP
as a measure o f the haplotype effect
of the non-reference compared to the reference haplo-
type Lo152. Firs t, significant differ ences between haplo-
types of one gene were assessed using the likelihood
ratio test. If the overall statistic was significant, indivi-
dual haplotype effects were tested against the reference
haplotype Lo152 via t-tests. Based on haplotype infor-
mation gene × gene interactions were assessed using the
likelihood ratio test, comparing the full model with
main effects plus interaction to the reduced model with
main effects only.
Results
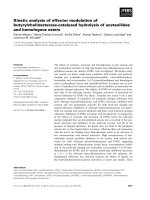
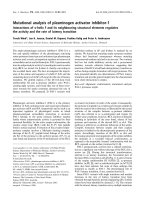
Phenotypic data analyses
Phenotypic assessments of FT were carried out in 12
environments from three different phenotyping plat-
forms. Phenoty pic data were analyzed separately in each
environment (Figure 1). Genotypic variation for FT was
significant at both temperatures for both years in the
controlled platform (P < 0.001). Recovery scores ranged
from a median near 2.5 (between intensive and moder-
ate damage) at -19°C in 2008 to a median near 1.0 (little
sign of life) at -21°C in 2009. As expected, recovery
scores were higher at -19°C than at -21°C in the same
year but were lower in 2009 than in 2008 probably due
to different gener ations of rye material (S
1
vs S
1:2
families). The high variability at -21°C in 2008 might
have been induced by substantial varia tion between
chambers. In the semi-controlled platform, genotypic
variation for FT was significant during all months for
both years (P < 0.01). Linear decreasing trends were
observed during each year which was expected since
those were longitudinal data and thus the damaged por-
tions of plants increased during the progression of win-
ter. In the field platform, genotypic variation fo r FT was
significant (P < 0.0 5) in four (LIP1, LI P2, SAS1, and
SAS2) of the six environments (P < 0.05). Compared to
other environments, SAS1 and SAS2 showed a better
differentiation for FT among genotypes, ranging from
5% to 100% with a median of 75% and 0% to 95% with
a median of 20% survival rate, respectively. The large
difference of survival rate between SAS1 and SAS2 was
probably due to different altitudes and conseque ntly dif-
ferent severity of frost stress.
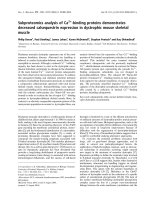
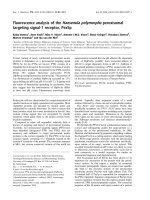
Population structure and kinship
Based on the STRUCTURE analysis, k = 3 was the most
probable number of groups. Populations PR2733
(Belarus) and Petkus (Germany) formed two distinct
groups while populations EKOAGRO, SMH2502, and
ROM103 (all from Poland) were admixed in the third
groupwithsharedmembershipfractionswithpopula-
tion PR2733 (Figure 2). This could likely be attributed
to seed exchange between the populations from Belar us
and Poland. The relatedness among t he 201 genotype s
estimated from the allele-similarity kinship matrix ran-
ged from 0.11 to 1.00 with a mean of 0.37. Compared to
the Eastern European populations, genotypes from Pet-
kus showed a higher relatedness among each other with
a mean of 0.53.
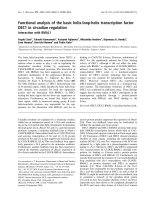
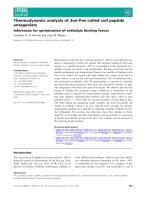
Association analyses
SNP-FT associations were performed using 170 SNPs
from twelve candidate genes. In the controlled platform,
69 statistically significant SNPs were identified among
Li et al. BMC Plant Biology 2011, 11:146
/>Page 5 of 14
nine genes: ScCbf2, ScCbf9b, ScCbf11, ScCbf12, ScCbf15,
ScDhn1, ScDhn3, ScDreb2, Sc Ice2 (all P <0.05;Figure
3). In the semi-controlled platform, 22 statistically sig-
nificant (P < 0.05) SNPs were identified among five
genes: ScCbf2, ScCbf11, ScCbf12, ScCbf15,andScIce2.In
the field platform, 29 statistically significant (P < 0.05)
SNPs were identified among six genes: ScCbf9b,
ScCbf12, ScCbf15, ScDhn1, ScDreb2,andScIce2.Eighty-
four SNPs from nine genes were significantly associated
with FT in at least one of the three platforms, and 3 3
SNPs from six genes were significantly associated with
FT in at least two of the three platforms. Ac ross all
three phenotyping platforms, two SNPs in ScCbf15 and
one SNP in ScCbf12 were significantly associated with
FT; all of these three SNPs are non-synonymous, caus-
ing amino acid replacements.NoSNP-FTassociations
were found for SNPs in ScCbf6 , ScCb f14,andScVrn1.
Full information on S NP-FT associations for all plat-
forms can be found in Additional file 3.
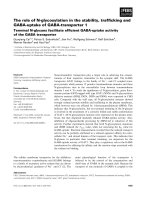
Allelic effects (b
SNP
)ofthe170SNPsstudiedwere
relatively low, ranging from -0.43 to 0.32 for recovery
score s in the controlled platform, -2.17% to 2.44% for %
plants with undamaged leaves in the semi-controlled
platform, and -3.66% to 4.30% for % survival in the field
platform (Figure 4). 45.5% of all significant SNPs found
in at least one platform had positive allelic effects, indi-
cating the non-reference allele conveyed superior FT to
the reference allele. The largest positive b
SNP
among the
% survival
% plants with undamaged leaves
R
ecovery score
KAS LIP1 MIN SAS1 SAS2 LIP2
2009 2010
-19°C -21°C -19°C -21°C
2
008
2
009
a) b) c)
2.5
1.5
0.5
3.5
1.0
3.0
2.0
0.0
40
60
80
100
0
20
Jan. Feb. Apr. Feb. Mar.
2
008
2
009
80
90
100
30
50
70
40
60
Figure 1 Phenotypic variation in three phenotyping platforms: a) controlled platform, b) semi-controlled platform, and c) field
platform. The values are the average phenotypic raw value of replicates for each genotype. Boxes indicate the range of the middle 50% of the
data with a horizontal line representing the median and vertical lines beyond the boxes indicate the upper and lower 25% of the data. Outliers
are represented by crosses.
PR2
733
R
O
M1
03S
MH2
50
2EK
O
A
G
R
O
Petkus
1.0
0.8
0.6
0.4
0.2
0
Figure 2 Population structure based on genotyping data of 37 SSR markers. Each genotype is represented by a thin vertical line, which is
partitioned into k = 3 colored segments that represent the genotype’s estimated membership fractions shown on the y-axis in k clusters.
Genotypes were sorted according to populations along the x-axis and information on population origin is given.
Li et al. BMC Plant Biology 2011, 11:146
/>Page 6 of 14
170 SNPs in the field platform was observed for SNP7
in ScIce2 (b
SNP
= 4. 30). This favorable allele was present
predominantly in the PR2733 population (55.2%), and
occurred at much lower frequency in the other four
populations (EKOAGRO: 4.7%, Petkus: 0%, ROM103:
7.1% and SMH2502: 6.7%). The proportion of genetic
variation explained by individual SNPs ranged from 0%
to 27.9% with a median of 0.4% in the controlled plat-
form, from 0 % to 25.6% with a median o f 1.2% i n the
semi-controlled platform, and fro m 0% to 28.9% with a
median of 2.0% in the field platform (Figure 5). These
distributions were highly concentrated near zero.
Contro
ll
e
d
Semi-
c
ontrolled
Fiel
d
ScCbf2 (1/3)
ScCbf9b (12/31)
ScCbf12 (12/26)
ScDhn3 (1/14)
ScDreb2 (2/13)
ScIce2 (8/37)
Ȉ (36/124)
ScCbf12(1/26)
ScCbf15 (2/4)
Ȉ (3/30)
ScCbf2 (1/3)
ScCbf12 (6/26)
Ȉ (7/29)
ScCbf9b (1/31)
ScCbf12 (1/26)
ScCbf15 (1/4)
ScDhn1 (2/6)
ScIce2 (18/37)
Ȉ (23/104)
ScCbf12 (1/26)
ScDhn1 (1/6)
ScDreb2 (1/13)
Ȉ (3/45)
ScCbf11 (7/27)
ScCbf12 (1/26)
ScIce2 (4/37)
Ȉ (12/91)
Figure 3 Venn diagram of SNPs from candidate genes significantly (P < 0.05) associated with frost tolerance in three phenotyping
platforms. The first and second numbers in each bracket are the number of significant SNPs and total number of SNPs in each candidate gene.
Figure 4 Distribution of allelic effects (b
SNP
) of SNP - frost tolerance associations in a) controlled, b) semi-controlled, and c) field
platforms. The left and right hand side bars in a), b) and c) represent alleles with negative and positive effects relative to the Lo152 reference
allele, respectively. The significance threshold (P < 0.05) for each platform is indicated by a dashed line.
Li et al. BMC Plant Biology 2011, 11:146
/>Page 7 of 14
Empirical correlations of the SNP-FT association
results, in terms of t values, betw een the three pheno-
typing platforms were moderate to low. The highest cor-
relation coefficient was observed between the controlled
and semi-controlled platform with r = 0.56, followed by
correlations between the controlled and field platform
with r = 0.54, and the semi-controlled and field platform
with r = 0.18. When correlations were restricted to the
significant SNPs, slightly higher correlation coefficients
were observed with r = 0.64 between the controlled and
semi-controlled platform, r = 0.66 between the con-
trolled and field platform, and r = 0.34 betw een the
semi-controlled and field platform.
Haplotype-FT associations were performed using 30
haplotypes (MAF > 5%) in eleven candidate genes.
Because only one haplotype in ScDhn1 had a MAF >
5%, ScDhn1 was excluded from further analysis. Large
numbers o f rare haplotypes (MAF < 5%) were f ound in
ScCbf9b (N = 62) and ScCbf12 (N = 22) resulting in
large numbers of missing genotypes (87.9% and 61.3%)
for the association analysis. Haplotypes 2, 3, and 4 in
ScCbf2 were significantly (P < 0.05) asso ciated with FT
in the controlled platform. For haplotypes 1 and 2 in
ScCbf15 and haplotype 1 in ScIce2, significant associa-
tions (P < 0.05) were found across two and three plat-
forms, respectively (Table 1). Haplotype effects (b
Hap
)
were r elatively low and comparabl e to the allelic effects
(b
SNP
) ranging fr om -0.31 to 0.49 (recovery score),
-1.71% to 2.74% (% plants with undamaged leaves), and
-3.32% to 3.47% (% survival) in the controlled, semi-con-
trolled and field platform, respectively. The highest posi-
tive effect on survival rate was observed for haplotype 1
of ScIce2 in the field platform, implicating this haplotype
as the best candidate with superior FT. This favorable
haploty pe was present mainly in the PR2733 population
(35.7%), occurring in much lower frequencies in the
other four populations (0.0% in EKOAGRO, 0.0% in Pet-
kus, 5.3% in ROM103, and 6.7% in SMH2503). The pro-
portion of genetic variation explained by the haplotypes
ranged from 0% to 25.7% with a median of 1.6% in the
controlled platform, from 0% to 17.6% with a median of
1.4% in the semi- controlled platform, and from 0% to
9.3% with a median of 4.8% in the field platform.
Out of all possible gene × gene interactions tested on
the basis of haplotypes, eleven, six, and one were signifi-
cantly (P < 0.05) associated with FT in the controlled,
semi-controlledandfieldplatforms, respectively.
ScCbf15 × ScCbf6, ScCbf15 × ScVrn1, ScDhn3 ×
ScDreb2,andScDhn3 × ScVrn1 were significantly asso-
ciated with FT a cross two platforms, none were signifi-
cantly associated w ith FT across all t hree platforms
(Figure 6).
Discussion
FT is a complex trait with polygenic inheritance. While
the genetic basis of FT has been widely studied in
0
20
40
60
80
100
120
140
5%
25%20%
15%10%
30
%
Controlled
Semi-controlled
Field
Effect sizes of SNPs
(g
enetic variation ex
p
lained
)
Num
b
er of SNPs
Figure 5 Distributions of effect sizes of SNPs in three phenotyping platforms. Effect sizes are displayed as genetic varia tion explained by
individual SNPs.
Li et al. BMC Plant Biology 2011, 11:146
/>Page 8 of 14
Table 1 Summary of haplotypes significantly associated with frost tolerance in at least one platform, their haplotype
effects, and percent genetic variation explained by the haplotypes
Candidate
gene
Name of
haplotype
a
Controlled (recovery score 0-5)
b
Semi-controlled (% plants with
undamaged leaves)
Field (% survival)
P-
value
c
b
Hap
% genetic variation
explained
P-
value
b
Hap
% genetic variation
explained
P-
value
b
Hap
% genetic variation
explained
ScCbf2 Overall
d
<
0.001
- 25.7 0.21 - 16.3 0.40 - 5.0
2 0.04 -0.11 - 0.51 -0.51 - 0.73 -0.51 -
3 <
0.001
0.49 - 0.19 1.36 - 0.12 3.32 -
4 <
0.001
-0.31 - 0.12 -1.43 - 0.74 0.57 -
ScCbf15 Overall <
0.01
- 0.6 0.09 - 17.6 0.09 - 4.4
1 <
0.01
-0.22 - 0.04 -1.69 - 0.06 -3.32 -
2 <
0.01
-0.21 - 0.13 -0.92 - 0.04 -2.59 -
ScIce2 Overall 0.04 - 4.8 0.02 - 13.3 0.13 - 8.1
1 <
0.01
0.29 - <
0.01
2.74 - 0.02 3.47 -
a
Haplotypes with minor allele frequency (MAF) > 5%
b
0: completely died. 1: little sign of life. 2: intensive damage. 3: moderate damage. 4: small damage. 5: no damage
c
P-values < 0.05 are printed in bold
d
All haplotypes (MAF > 5%) within a candidate gene
ScIce2
Controlled
Semi-controlle
d
Fi
e
l
d
L
evel 1
L
evel 2
L
evel 3
ScCbf6
ScCbf15
ScVrn1
ScDhn3
ScDreb2 ScCbf14
ScCbf11ScCbf12
L
evel unknown
Figure 6 Significant (P < 0.05) gene × gene interactions for fro st tolerance in three phenotyping platforms. Candidate genes are so rted
in three levels according to the frost responsive cascade [19]. The level where ScVrn1 belongs to is still unknown.
Li et al. BMC Plant Biology 2011, 11:146
/>Page 9 of 14
cereals by bi-parental linkage mapping and expression
profiling, exploitation of the allelic and phenotypic varia-
tion of FT in rye by association studies has lagged
behind [20, 21,24]. This study reports the first candidate
gene-based association studies in rye examining the
genetic basis of FT.
Statistically significant SNP-FT associations were iden-
tified in nine candidate genes hypothesized to be
involved in the frost responsive network among which
the transcription factor Ice2 isoneofthekeyfactors.
The function of Ice2 was characterized both in wheat
and Arabidopsis [25,26]. Over-expression of TaIce2 and
AtIce2 in transgenic Arabidopsis plants resulted in
increased FT of transgenic plants and was associated
with higher expression levels of the Cbf gene family.
Using electrophor esis mobility shift assays, Badawi et al.
[25] further showed that TaIce2 binds to the promoter
region of TaCbf9. We were n ot able to detect interac-
tion between ScIce2 and ScCbf9b probably due to the
large number of rare haplotypes (MAF < 5%) in ScCbf9b
resulting in missing genotypes (87.9%) and thus in insuf-
ficient statistic al power to identify gene × gene interac-
tion. However, in the rye homolog Sc Ice2, we detected
30 out of 37 SNPs with high LD (average r
2
=0.85)
which were significantly associated with FT. Our results
support the findings of expressio n studies that Ice2 is
one of the key elements in the frost responsive network.
Given that these 30 SNPs are all located in the first
intron of the gene, they are unlikely to be functional.
However, it is possible that they are in LD w ith func-
tional polymorphisms located in the coding sequence
(CDS) of the gene which we have not investigated due
to a lack of rye sequences in GenBank for primer
design. The favorable allele of SNP7 in ScIce2 had a
relatively large allelic effect on FT in the controlled and
field platforms when compared to other SNPs in this
study. This allele was presen t predominantly in the
PR2733 population while entirely absent in the Petkus
population. Thus, this SNP might facilitate marker-
assisted backcrossing to introgress favorable genomic
regions into the Petkus population, thereby improving
FT of current breeding materials.
The Cbf gene family, regulated by Ice2, belon gs to the
family of APET ALA2 (AP2) transcription factors, some
of which are closely linked in cere als and map to the FT
locus Fr2 on homoeologous group 5 of the Triticeae
[20-22]. Expression studies have revealed that the Cbf
gene family is involved in the frost responsive network
in diverse species [10,24,53]. In this study, seven Cbf
genes were investigat ed and statistically significan t asso-
ciations were found in at least one platform for ScCbf2,
ScCbf9b, ScCbf11, ScCbf12,andScCbf15 but not for
ScCbf6 and ScCbf14. This confirms previous studies that
not all members of the Cbf gene family are involved in
the frost responsive network [24,53]. In ScCbf2,a200
bp Indel was highly associated (P =6.27e
-5
)withFTin
the controlled platform and explained a high proportion
of the genetic variation in the controlled (25.7%) and
semi-controlled (16.3%) platforms. It is noteworthy that
this 200 bp Indel in the promoter of ScCbf2 contained
two MYB and one MYC cis-elements. In wheat the pre-
sence of MYB and MYC elements has been shown to
affect the binding specificity of TaIce41 (wheat homolog
of ScIce2) and consequently the expression level of the
TaCbf gene family [25]. Expression studi es are needed
to investigate the effect of multiple binding sites for
ScIce2 in Cbf gene promoters on the expression level of
Cbf genes. A study in Triticum monococcum suggested
that polymorphisms in TmCbf12, TmCbf14,and
TmCbf15 are the most likely explanation for observed
differences in FT [22]. Among the four significantly
associated Cbf genes in our study, one SNP in ScCbf12
and two SNPs in high LD (r
2
= 0.73) in ScCbf15 were
significantly associated with F T across all three plat-
forms. Given that these three SNPs are all non-synon-
ymous, leading to amino acid exchanges in the CDS of
their respective genes, they are good candidates for
functional genetic studies. In a recent study, Fricano et
al. [54] found two SNPs located in the 3’ -untranslated
region of HvCbf14 significantly associated with FT in
wheat. The 3’ -untranslated region of ScCbf14 was not
sequenced in this study; it wo uld be interesting to
sequence this region to investigate w hether it also con-
tains SNPs significantly associated with FT in rye as
well. However, members of the Cbf gene family are not
the only key factors in the frost responsive network
[55,56]. Hannah et al. [10] reported that 45% of the Ara-
bidopsis transcriptome was cold responsive, but only
33% of the cold responsive transcriptome belonged to
the Cbf regulon and in a study of wheat, Monroy et al.
[13] reported that at least one-third of genes induced by
cold did not belong to the Cbf regulon. The transcrip-
tion factor AtHOS9, which encodes a putative homeo-
box protein, has been shown to contribute to the
regulation of FT in Arabidopsis independently of the
Cbf regulon [57]. Thus, extending our research to more
candidate genes of the frost responsive network will cer-
tainly be worthwhile.
The Dreb2 gene, another member of the AP2 tran-
scription factor family, has been isolated and character-
ized in several crop species such as wheat, barley, maize,
and rice [58-61]. Similar to Cbf genes, Dreb2 can specifi-
cally bind to DRE/CRT cis-elements of the stress-induci-
ble target genes, albeit primarily under drought rather
than cold/frost stress [62]. However, i t is not surprising
that Dreb2 can also be induced by cold/frost as shown
by recent studies in wheat and maize since both drought
and cold/frost stresses lead to dehydration of cells
Li et al. BMC Plant Biology 2011, 11:146
/>Page 10 of 14
[59,60]. In this study, three SNPs in ScDreb2 were sig-
nificantly associated with FT s upporting the hypothesis
that Dreb2 in rye is not only involved in drought
response but also in frost response.
The dehydrin genes, part of the COR gene family, are
regulated by the Cbf gene fam ily and the Dreb2 gene via
the cis-element DRE/CRT present in the promoter
region of COR genes [19]. Transcripts of HvDhn1,
HvDhn3 and other HvDhn genes were d etected under
frost stre ss in barley [18]. We detected two SNPs in the
promoter region of ScDhn1 and one SNP in the intron
of ScDhn3 with significant associations with FT in the
controlled platform. These SNPs might serve as variants
which affect the binding specificity of the Cbf gene
family.
Effect sizes of markers, commonly expressed as per-
centageofthegeneticvarianceexplainedbymarkers,
are o f primary interest in association studies since they
are the main factors that determine the effectiveness of
subsequent marker assisted-selection processes. Two
hypotheses for the distribution of effect sizes in quanti-
tative traits have been proposed: Mather’ s “ infinitesi-
mal” model and Robertson’ smodel[63].Theformer
assumes an effectively infinitesimal number of loci with
very small and ne arly equal effect sizes; the latter, an
exponential trend of the distribution of effects whereby
a few loci have relatively large e ffects and the rest only
small effects. Findings in this study suppo rt the latter,
with distributions of SNP effect sizes (percentage of the
genetic variance explained by individual SNPs) highly
concentrated near zero and few SNPs having large
effects (maximum 28. 8% explained genetic variation). A
similar distribution of haplotype effect sizes was
observed. A recent review summarizing association stu-
dies in 15 different plant species also implicated Robert-
son’ s model and furthe r suggested that phenotypic
traits, species, and types of variants may impact distribu-
tions of effect sizes [64]. Studies on the genetic architec-
ture of quantitative traits have become a challenging
task in recent years [64-66]. We will further investigate
this topic with a genome-wide association study to
obtain a m ore complete picture of the genetic architec-
ture of FT.
Epistasis, genera lly defined as the interaction between
genes, has been recognized for over a century [67], and
recently it has been suggested that it should be explicitly
modeled in association studies in order to detect “ miss-
ing heritabilities” [68,69]. Several recent association stu-
dies in plants have revealed the presence of epistasis in
complex traits, including potato tuber quality, barley
flowering time, and maize kernel quality [70-72 ]. In this
study, eleven, six, and one significant (P < 0.05) gene ×
gene interaction effects were found in the controlled,
semi-controlledandfieldplatforms, respectively,
suggesting that epistasis may play a role in the frost
responsive network. From the frost responsive network,
one might hypothesize that transcription factors interact
with their downstream t arget genes, for example, that
ScIce2 interacts with t he ScCbf gene family and the lat-
ter interacts with COR genes, such as the dehydrin
(Dhn) gene family. Indeed significant interactions were
observed between ScIce2 × ScCbf15, ScCbf14 × ScDhn3,
and ScDreb2 × ScDhn3. Some candidate genes in the
same cascade level also interact with each other, such as
members of the ScCbf
gene family Sc
Cbf6 × ScCbf15
and ScCbf11 × ScCbf14. Similar interactions within the
Cbf gene family were also observed in Arabidopsis
where AtCbf2 was indicated as a negative regulator of
AtCbf1and AtCbf3[73]. In this study, ScVrn1 was not
significantly associated with FT but had significant inter-
action effects with six other candidate genes, underlining
the important role of ScVrn1 in the frost responsive net-
work. To confirm direct physic al interactions of tran-
scription factors with their downstream target genes,
further experiments are needed, for example, electro-
phoresis mobility shift assays or ChIP (chromatin immu-
noprecipitation) sequencing technology. It is worth to
point out that the power of detecting gene × gene inter-
action might be low due to relative small sample size.
Low to moderate empirical correlations of SNP-FT
association s were observed across the three platforms
reflecting the complexity of F T and thus the need for
different platforms in order to more accurately charac-
terize FT. There are at least two reasons that might
expl ain why relati vely low to medium empirical correla-
tions of SNP-FT associ ations were observed: 1) dif ferent
duration and intensity of freezing temperature and 2)
different levels of confounding effects from environmen-
tal factors other than frost stress per se.Inthecon-
trolled platform, plants were cold-hardened and then
exposed t o freezing temperatures (-19°C or -21°C) in a
short period of six days using defined temperature pro-
files. Recovery score in the controlled platform repre-
sents the most pure and controlled measurement of FT
among the three platforms since the effect of environ-
mental factors other than frost stress is minimized. In
the semi-controlled platform, plants were exposed to
much longer freezing periods with fluctuating tempera-
tures and repeated frost-thaw processes. In addition, a
more complex situation occurs in this platform, requir-
ing plants to cope with other variable climatic factors
such as changing photoperiod, natural light intensity,
wind, and limited water supply. Thus, the measurement
% p lants with undamaged leaves in the semi-controlled
platform reflects the combined effect of various environ-
men tal influences and stresses on the vitality of leaf tis-
sue but does not mirror survival of the crown tissue as
indicator for frost tolerance. In the field platform, winter
Li et al. BMC Plant Biology 2011, 11:146
/>Page 11 of 14
temperatures were generally lower than in the semi-con-
trolled platform due to the strong con tinental climate in
Eastern Europe and Canada (Add itional file 1). The
measurement % survival in the field is further con-
founded by environmental effects, such as snow-cover-
age, soil uniformity, topography, and other unmeasured
fact ors. The di fferent experimental platforms permit the
identification of different sets of genes associated with
FT, which might impact the correlations of SNP-FT
associations across platforms. It is worth to point out
that the correlation between the controlled and semi-
controlled platform was higher than between the semi-
controlled and field platform. One possible explanation
is that plant growth in boxes in both controlled and
semi-controlle d platforms res ults in a rather similar
environment where roots are more exposed to freezing
than in th e field. Several studies suggested that different
genes might be induced under different frost stress
treatments. A l arge number of blueberry genes induced
in growth chambers were not induced under field condi-
tions [74]. In rye, Campoli et al. [24] drew the conclu-
sion that expression patterns of different members of
the Cbf gene family were affected by different acclima-
tion temperatures and sampling times. Most p rior stu-
dies on FT have been conducted in controlled
environments. However, the re latively low to medium
correlation among platforms in this study suggest that
future studies should consider various scenarios in order
to obtain a more complete picture of the genetic basis
of FT in rye.
Conclusions
Identification of alleles and genes underlying agro-
nomictraitssuchasFTisimportantforgenome-based
breeding. Based on phenotypic data from three differ-
ent phenotyping platforms, including field trials, our
study showed that the Cbf gene family plays an impor-
tant role in FT of rye. Nine out of twelve candidate
genes that had previously been shown to be directly
involved in the cold/frost r esponsive network were sig-
nificantly associated with FT. Several significant gene ×
gene interactions were observed indicating the pre-
sence of epistatic interactions between genes involved
in the frost responsive network. Our results demon-
strated that the candidate gene-based association
approach remains one of the most appropriate strate-
gies for gene identification, given the huge genome
size of rye (~8,100 Mb) and the rapid decline of link-
age disequilibrium (LD) revealed in a previous study
[43]. Validation of SNPs and haplotypes associated
with FT will be performed in future studies to deter-
mine the diagnosti c value of markers for marker-
assisted selection in rye breeding programs.
Additional material
Additional file 1: Geographical coordinates and climate data for
semi-controlled and field platforms. The file contains geographical
coordinates of the experimental stations, dates of sowing and scoring,
and temperature during the trial period in the semi-controlled and field
platforms.
Additional file 2: Supplementary information on primers and
sequence analysis for ScDreb2. The file contains two tables. Table S1
describes the primer information of ScDreb2. Table S2 is a summary of
the ScDreb2 sequence analysis including analyzed fragment length, gene
coverage, number of lines, number of SNPs (MAF > 0.05), number of
Indels and haplotypes, haplotype (Hd) and nucleotide diversity (π), and
linkage disequilibrium (LD).
Additional file 3: Full information of SNP-FT associations. The file
contains allelic effect ( b
SNP
), SNP effect (% genetic variation explained),
and P-value of 170 SNPs associated with FT in controlled, semi-
controlled, and field platforms.
Acknowledgements
This study is supported by a grant (FKZ 0315062 A and B, Project GABI RYE-
FROST) from the German Federal Ministry of Education and Research (BMBF).
We are grateful to Gabor Galiba (ARI, Martonvásár, Hungary), Brian Fowler
(University of Saskatoon, Saskatoon, Canada), Thomas Miedaner and Christof
I. Kling (Universität Hohenheim, Stuttgart, Germany) for participating in
phenotyping. The first author gratefully acknowledges the support of the
“Graduiertenzentrum Weihenstephan” from the Technische Universität
München Graduate School (TUM-GS), Germany.
Author details
1
Plant Breeding, Technische Universität München, Freising, Germany.
2
Biostatistics Unit, Technische Universität München, Freising, Germany.
3
KWS
LOCHOW GMBH, Bergen, Germany.
4
Department of Mathematics, Technische
Universität München, Garching, Germany.
Authors’ contributions
YL carried out the candidate gene and population structure analysis,
participated in the statistical analyses and drafted the manuscript. AB carried
out statistical analyses. GH participated in the molecular analyses and
interpretation of the results. DA participated in statistical analysis and
interpretation of the results. VK provided SSR marker data. PW developed
the plant material. EB and CCS designed and coordinated the study and
interpreted the results. All authors read, edited and approved the final
manuscript.
Received: 4 July 2011 Accepted: 27 October 2011
Published: 27 October 2011
References
1. Gusta LV, Willen R, Fu P, Robertson AJ, Wu GH: Genetic and environmental
control of winter survival of winter cereals. Acta Agron Acad Sci Hung
1997, 45(3):231-240.
2. Chinnusamy V, Zhu J, Zhu JK: Cold stress regulation of gene expression
in plants. Trends Plant Sci 2007, 12(10):444-451.
3. Saulescu NN, Braun HJ: Cold tolerance. In Application of physiology in wheat
breeding. Edited by: Reynolds MP, Ortiz-Monasterio JI, McNab A. Mexico, D.F:
CIMMYT; 2001:111-123.
4. Fowler DB, Limin AE: Exploitable genetic variability for cold tolerance in
commercially grown cereals. Can J Plant Sci 1987, 67(1):278-278.
5. Hömmö LM: Hardening of some winter wheat (Triticum aestivum L.), rye
(Secale cereals L.), triticale (Triticosecale Wittmack) and winter barley
(Hordeum vulgare L.) cultivars during autumn and the final winter
survival in Finland. Plant Breed 1994, 112(4):285-293.
6. Thomashow MF: Plant cold acclimation: Freezing tolerance genes and
regulatory mechanisms. Annu Rev Plant Phys 1999, 50:571-599.
7. Fowler DB, Gusta LV, Tyler NJ: Selection for winterhardiness in wheat. III.
Screening methods. Crop Sci 1981, 21(6):896-901.
Li et al. BMC Plant Biology 2011, 11:146
/>Page 12 of 14
8. Dorffling K, Schulenburg S, Lesselich G, Dorffling H: Abscisic acid and
proline levels in cold hardened winter wheat leaves in relation to
variety-specific differences in freezing resistance. J Agron Crop Sci 1990,
165(4):230-239.
9. Houde M, Dhindsa RS, Sarhan F: A molecular marker to select for freezing
tolerance in Gramineae. Mol Gen Genet 1992, 234(1):43-48.
10. Hannah MA, Heyer AG, Hincha DK: A global survey of gene regulation
during cold acclimation in Arabidopsis thaliana. Plos Genet 2005,
1(2):179-196.
11. Kreps JA, Wu YJ, Chang HS, Zhu T, Wang X, Harper JF: Transcriptome
changes for Arabidopsis in response to salt, osmotic, and cold stress.
Plant Physiol 2002, 130(4):2129-2141.
12. Vogel JT, Zarka DG, Van Buskirk HA, Fowler SG, Thomashow MF: Roles of
the CBF2 and ZAT12 transcription factors in configuring the low
temperature transcriptome of Arabidopsis. Plant J 2005, 41(2):195-211.
13. Monroy AF, Dryanova A, Malette B, Oren DH, Farajalla MR, Liu W, Danyluk J,
Ubayasena LWC, Kane K, Scoles GJ, et al: Regulatory gene candidates and
gene expression analysis of cold acclimation in winter and spring
wheat. Plant Mol Biol 2007, 64(4):409-423.
14. Winfield MO, Lu CG, Wilson ID, Coghill JA, Edwards KJ: Plant responses to
cold: transcriptome analysis of wheat. Plant Biotech J 2010, 8(7):749-771.
15. Kosova K, Vitamvas P, Prasil IT: The role of dehydrins in plant response to
cold. Biol Plant 2007, 51(4):601-617.
16. Moellering ER, Muthan B, Benning C: Freezing tolerance in plants requires
lipid remodeling at the outer chloroplast membrane. Science 2010,
330(6001):226-228.
17. Choi DW, Zhu B, Close TJ: The barley (Hordeum vulgare L.) dehydrin
multigene family: sequences, allele types, chromosome assignments,
and expression characteristics of 11 Dhn genes of cv Dicktoo. Theor Appl
Genet 1999, 98(8):1234-1247.
18. Zhu B, Choi DW, Fenton R, Close TJ: Expression of the barley dehydrin
multigene family and the development of freezing tolerance. Mol Gen
Genet 2000, 264(1-2):145-153.
19. Yamaguchi-Shinozaki K, Shinozaki K:
Transcriptional regulatory networks in
cellular
responses and tolerance to dehydration and cold stresses. Annu
Rev Plant Biol 2006, 57:781-803.
20. Francia E, Barabaschi D, Tondelli A, Laido G, Rizza F, Stanca AM, Busconi M,
Fogher C, Stockinger EJ, Pecchioni N: Fine mapping of a HvCBF gene
cluster at the frost resistance locus Fr-H2 in barley. Theor Appl Genet
2007, 115(8):1083-1091.
21. Baga M, Chodaparambil SV, Limin AE, Pecar M, Fowler DB, Chibbar RN:
Identification of quantitative trait loci and associated candidate genes
for low-temperature tolerance in cold-hardy winter wheat. Funct Integr
Genomics 2007, 7(1):53-68.
22. Knox AK, Li CX, Vagujfalvi A, Galiba G, Stockinger EJ, Dubcovsky J:
Identification of candidate CBF genes for the frost tolerance locus Fr-A
(m)2 in Triticum monococcum. Plant Mol Biol 2008, 67(3):257-270.
23. Alm V, Busso CS, Ergon A, Rudi H, Larsen A, Humphreys MW, Rognli OA:
QTL analyses and comparative genetic mapping of frost tolerance,
winter survival and drought tolerance in meadow fescue (Festuca
pratensis Huds.). Theor Appl Genet 2011, 123(3):369-382.
24. Campoli C, Matus-Cadiz MA, Pozniak CJ, Cattivelli L, Fowler DB:
Comparative expression of Cbf genes in the Triticeae under different
acclimation induction temperatures. Mol Genet Genomics 2009,
282(2):141-152.
25. Badawi M, Reddy YV, Agharbaoui Z, Tominaga Y, Danyluk J, Sarhan F,
Houde M: Structure and functional analysis of wheat ICE (inducer of CBF
expression) genes. Plant Cell Physio 2008, 49(8):1237-1249.
26. Fursova OV, Pogorelko GV, Tarasov VA: Identification of ICE2, a gene
involved in cold acclimation which determines freezing tolerance in
Arabidopsis thaliana. Gene 2009, 429(1-2):98-103.
27. Kaplan F, Kopka J, Haskell DW, Zhao W, Schiller KC, Gatzke N, Sung DY,
Guy CL: Exploring the temperature-stress metabolome of Arabidopsis.
Plant Physiol 2004, 136(4):4159-4168.
28. Cook D, Fowler S, Fiehn O, Thomashow MF: A prominent role for the CBF
cold response pathway in configuring the low-temperature metabolome
of Arabidopsis. Proc Natl Acad Sci USA 2004, 101(42):15243-15248.
29. Tester M, Langridge P: Breeding technologies to increase crop production
in a changing world. Science 2010, 327(5967):818-822.
30.
Rafalski A: Applications of single nucleotide polymorphisms in crop
genetics. Curr Opin Plant Biol 2002, 5(2):94-100.
31. Thornsberry JM, Goodman MM, Doebley J, Kresovich S, Nielsen D,
Buckler ES: Dwarf8 polymorphisms associate with variation in flowering
time. Nature Genet 2001, 28(3):286-289.
32. Zhao K, Aranzana M, Kim S, Lister C, Shindo C, Tang C, Toomajian C,
Zheng H, Dean C, Marjoram P, et al: An Arabidopsis example of
association mapping in structured samples. Plos Genet 2007, 3:e4.
33. Malosetti M, van der Linden CG, Vosman B, van Eeuwijk FA: A mixed-
model approach to association mapping using pedigree information
with an illustration of resistance to Phytophthora infestans in potato.
Genetics 2007, 175(2):879-889.
34. Harjes CE, Rocheford TR, Bai L, Brutnell TP, Kandianis CB, Sowinski SG,
Stapleton AE, Vallabhaneni R, Williams M, Wurtzel ET, et al: Natural genetic
variation in lycopene epsilon cyclase tapped for maize biofortification.
Science 2008, 319(5861):330-333.
35. Aranzana MJ, Kim S, Zhao KY, Bakker E, Horton M, Jakob K, Lister C,
Molitor J, Shindo C, Tang CL, et al: Genome-wide association mapping in
Arabidopsis identifies previously known flowering time and pathogen
resistance genes. PLoS Genet 2005, 1(5):531-539.
36. Devlin B, Roeder K: Genomic control for association studies. Biometrics
1999, 55:997-1004.
37. Pritchard JK, Stephens M, Rosenberg NA, Donnelly P: Association mapping
in structured populations. Am J Hum Genet 2000, 67(1):170-181.
38. Yu JM, Pressoir G, Briggs WH, Bi IV, Yamasaki M, Doebley JF, McMullen MD,
Gaut BS, Nielsen DM, Holland JB, et al: A unified mixed-model method for
association mapping that accounts for multiple levels of relatedness.
Nature Genet 2006, 38(2):203-208.
39. Stich B, Möhring J, Piepho HP, Heckenberger M, Buckler ES, Melchinger AE:
Comparison of mixed-model approaches for association mapping.
Genetics 2008, 178(3):1745-1754.
40. Rogowsky PM, Guidet FLY, Langridge P, Shepherd KW, Koebner RMD:
Isolation and characterisation of wheat-rye recombinants involving
chromosome arm 1DS of wheat. Theor Appl Genet 1991, 82(5):537-544.
41. Vagujfalvi A, Galiba G, Cattivelli L, Dubcovsky J: The cold-regulated
transcriptional activator
Cbf3 is
linked to the frost-tolerance locus Fr-A2
on wheat chromosome 5A. Mol Genet Genomics 2003, 269(1):60-67.
42. Fitzmaurice GM, Laird NM, Ware JH: Applied longitudinal analysis. New
Jersey: John Wiley & Sons; 2004.
43. Li YL, Haseneyer G, Schön CC, Ankerst D, Korzun V, Wilde P, Bauer E: High
levels of nucleotide diversity and fast decline of linkage disequilibrium
in rye (Secale cereale L.) genes involved in frost response. BMC Plant Biol
2011, 11:6.
44. Khlestkina EK, Ma HMT, Pestsova EG, Roder MS, Malyshev SV, Korzun V,
Börner A: Mapping of 99 new microsatellite-derived loci in rye (Secale
cereale L.) including 39 expressed sequence tags. Theor Appl Genet 2004,
109(4):725-732.
45. Hackauf B, Wehling P: Identification of microsatellite polymorphisms in
an expressed portion of the rye genome. Plant Breed 2002, 121(1):17-25.
46. Pritchard JK, Stephens M, Donnelly P: Inference of population structure
using multilocus genotype data. Genetics 2000, 155(2):945-959.
47. Hayes BJ, Goddard ME: Technical note: Prediction of breeding values
using marker-derived relationship matrices. J Anim Sci 2008,
86(9):2089-2092.
48. Galiba G, Quarrie SA, Sutka J, Morgounov A, Snape JW: RFLP mapping of
the vernalization (Vrn1) and frost resistance (Fr1) genes on chromosome
5A of wheat. Theor Appl Genet 1995, 90(7-8):1174-1179.
49. Bates D, Maechler M: lme4: Linear mixed-effects models using S4 classes.
R package version 0999375-35 2010.
50. R Development Core Team: R: A language and environment for statistical
computing. Vienna: R Foundation for Statistical Computing; 2009.
51. Mathews KL, Malosetti M, Chapman S, McIntyre L, Reynolds M, Shorter R,
van Eeuwijk F: Multi-environment QTL mixed models for drought stress
adaptation in wheat. Theor Appl Genet 2008, 117(7):1077-1091.
52. Rozas J, Sanchez-DelBarrio JC, Messeguer X, Rozas R: DnaSP, DNA
polymorphism analyses by the coalescent and other methods.
Bioinformatics 2003, 19(18):2496-2497.
53. Stockinger EJ, Skinner JS, Gardner KG, Francia E, Pecchioni N: Expression
levels of barley Cbf genes at the Frost resistance-H2 locus are
dependent upon alleles at Fr-H1 and Fr-H2. Plant J 2007, 51(2):308-321.
54. Fricano A, Rizza F, Faccioli P, Pagani D, Pavan P, Stella A, Rossini L,
Piffanelli
P, Cattivelli L: Genetic variants of HvCbf14 are statistically
Li et al. BMC Plant Biology 2011, 11:146
/>Page 13 of 14
associated with frost tolerance in a European germplasm collection of
Hordeum vulgare. Theor Appl Genet 2009, 119(7):1335-1348.
55. Fowler S, Thomashow MF: Arabidopsis transcriptome profiling indicates
that multiple regulatory pathways are activated during cold acclimation
in addition to the CBF cold response pathway. Plant Cell 2002,
14(8):1675-1690.
56. McKhann HI, Gery C, Berard A, Leveque S, Zuther E, Hincha DK, De Mita S,
Brunel D, Teoule E: Natural variation in CBF gene sequence, gene
expression and freezing tolerance in the Versailles core collection of
Arabidopsis thaliana. BMC Plant Biol 2008, 8:105.
57. Zhu JH, Shi HZ, Lee BH, Damsz B, Cheng S, Stirm V, Zhu JK, Hasegawa PM,
Bressan RA: An Arabidopsis homeodomain transcription factor gene,
HOS9, mediates cold tolerance through a CBF-independent pathway.
Proc Natl Acad Sci USA 2004, 101(26):9873-9878.
58. Xue GP, Loveridge CW: HvDRF1 is involved in abscisic acid-mediated
gene regulation in barley and produces two forms of AP2
transcriptional activators, interacting preferably with a CT-rich element.
Plant J 2004, 37(3):326-339.
59. Egawa C, Kobayashi F, Ishibashi M, Nakamura T, Nakamura C, Takumi S:
Differential regulation of transcript accumulation and alternative splicing
of a DREB2 homolog under abiotic stress conditions in common wheat.
Genes Genet Syst 2006, 81(2):77-91.
60. Qin F, Kakimoto M, Sakuma Y, Maruyama K, Osakabe Y, Tran LSP,
Shinozaki K, Yamaguchi-Shinozaki K: Regulation and functional analysis of
ZmDREB2A in response to drought and heat stresses in Zea mays L.
Plant J 2007, 50(1):54-69.
61. Dubouzet JG, Sakuma Y, Ito Y, Kasuga M, Dubouzet EG, Miura S, Seki M,
Shinozaki K, Yamaguchi-Shinozaki K: OsDREB genes in rice, Oryza sativa L.,
encode transcription activators that function in drought-, high-salt-, and
cold-responsive gene expression. Plant J 2003, 33(4):751-763.
62. Liu Q, Kasuga M, Sakuma Y, Abe H, Miura S, Yamaguchi-Shinozaki K,
Shinozaki K: Two transcription factors, DREB1 and DREB2, with an EREBP/
AP2 DNA binding domain separate two cellular signal transduction
pathways in drought- and low-temperature-responsive gene expression,
respectively, in Arabidopsis. Plant Cell 1998, 10(8) :1391-1406.
63. Mackay TFC: The genetic architecture of quantitative traits. Annual Review
of Genetics 2001, 35:303-339.
64. Ingvarsson PK, Street NR:
Association genetics of complex traits in plants.
New Phytol 2010, 189(4):909-922.
65. Flint J, Mackay TFC: Genetic architecture of quantitative traits in mice,
flies, and humans. Genome Research 2009, 19(5):723-733.
66. Buckler ES, Holland JB, Bradbury PJ, Acharya CB, Brown PJ, Browne C,
Ersoz E, Flint-Garcia S, Garcia A, Glaubitz JC, et al: The genetic architecture
of maize flowering time. Science 2009, 325(5941):714-718.
67. Bateson W: Mendel’s principles of heredity. Cambridge: Cambridge
University Press; 1909.
68. Phillips PC: Epistasis - the essential role of gene interactions in the
structure and evolution of genetic systems. Nat Rev Genet 2008,
9(11):855-867.
69. Wu XS, Dong H, Luo L, Zhu Y, Peng G, Reveille JD, Xiong MM: A novel
statistic for genome-wide interaction analysis. PLoS Genet 2010, 6(9):
e1001131.
70. Li L, Paulo MJ, van Eeuwijk F, Gebhardt C: Statistical epistasis between
candidate gene alleles for complex tuber traits in an association
mapping population of tetraploid potato. Theor Appl Genet 2010,
121(7):1303-1310.
71. Stracke S, Haseneyer G, Veyrieras JB, Geiger HH, Sauer S, Graner A,
Piepho HP: Association mapping reveals gene action and interactions in
the determination of flowering time in barley. Theor Appl Genet 2009,
118(2):259-273.
72. Manicacci D, Camus-Kulandaivelu L, Fourmann M, Arar C, Barrault S,
Rousselet A, Feminias N, Consoli L, Frances L, Mechin V, et al: Epistatic
interactions between Opaque2 transcriptional activator and its target
gene CyPPDK1 control kernel trait variation in maize. Plant Physiol 2009,
150(1):506-520.
73. Novillo F, Alonso JM, Ecker JR, Salinas J: CBF2/DREB1C is a negative
regulator of CBF1/DREB1B and CBF3/DREB1A expression and plays a
central role in, stress tolerance in Arabidopsis. Proc Natl Acad Sci USA
2004, 101(11):3985-3990.
74. Dhanaraj AL, Alkharouf NW, Beard HS, Chouikha IB, Matthews BF, Wei H,
Arora R, Rowland LJ: Major differences observed in transcript profiles of
blueberry during cold acclimation under field and cold room conditions.
Planta 2007, 225(3):735-751.
doi:10.1186/1471-2229-11-146
Cite this article as: Li et al.: Association analysis of frost tolerance in rye
using candidate genes and phenotypic data from controlled, semi-
controlled, and field phenotyping platforms. BMC Plant Biology 2011
11:146.
Submit your next manuscript to BioMed Central
and take full advantage of:
• Convenient online submission
• Thorough peer review
• No space constraints or color figure charges
• Immediate publication on acceptance
• Inclusion in PubMed, CAS, Scopus and Google Scholar
• Research which is freely available for redistribution
Submit your manuscript at
www.biomedcentral.com/submit
Li et al. BMC Plant Biology 2011, 11:146
/>Page 14 of 14