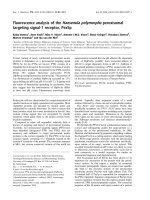
báo cáo khoa học: "Transcriptome analysis of ectopic chloroplast development in green curd cauliflower (Brassica oleracea L. var. botrytis)" potx
Bạn đang xem bản rút gọn của tài liệu. Xem và tải ngay bản đầy đủ của tài liệu tại đây (662.41 KB, 30 trang )
This Provisional PDF corresponds to the article as it appeared upon acceptance. Fully formatted
PDF and full text (HTML) versions will be made available soon.
Transcriptome analysis of ectopic chloroplast development in green curd
cauliflower (Brassica oleracea L. var. botrytis)
BMC Plant Biology 2011, 11:169 doi:10.1186/1471-2229-11-169
Xiangjun Zhou ()
Zhangjun Fei ()
Theodore W Thannhauser ()
Li Li ()
ISSN 1471-2229
Article type Research article
Submission date 15 April 2011
Acceptance date 23 November 2011
Publication date 23 November 2011
Article URL />Like all articles in BMC journals, this peer-reviewed article was published immediately upon
acceptance. It can be downloaded, printed and distributed freely for any purposes (see copyright
notice below).
Articles in BMC journals are listed in PubMed and archived at PubMed Central.
For information about publishing your research in BMC journals or any BioMed Central journal, go to
/>BMC Plant Biology
© 2011 Zhou et al. ; licensee BioMed Central Ltd.
This is an open access article distributed under the terms of the Creative Commons Attribution License ( />which permits unrestricted use, distribution, and reproduction in any medium, provided the original work is properly cited.
1
Transcriptome analysis of ectopic chloroplast development in green curd cauliflower
(Brassica oleracea L. var. botrytis)
Xiangjun Zhou
1,2
, Zhangjun Fei
1,3
, Theodore W Thannhauser
1
, and Li Li
1,2∗
1
Robert W Holley Center for Agriculture and Health, USDA-ARS, Cornell University, Ithaca,
NY 14853, USA
2
Department of Plant Breeding and Genetics, Cornell University, Ithaca, NY 14853, USA
3
Boyce Thompson Institute for Plant Research, Cornell University, Ithaca, NY 14853, USA
Email addresses:
XZ:
ZF:
TWT:
LL:
∗
Corresponding author
2
Abstract
Background: Chloroplasts are the green plastids where photosynthesis takes place. The
biogenesis of chloroplasts requires the coordinate expression of both nuclear and chloroplast
genes and is regulated by developmental and environmental signals. Despite extensive studies of
this process, the genetic basis and the regulatory control of chloroplast biogenesis and
development remain to be elucidated.
Results: Green cauliflower mutant causes ectopic development of chloroplasts in the curd tissue
of the plant, turning the otherwise white curd green. To investigate the transcriptional control of
chloroplast development, we compared gene expression between green and white curds using the
RNA-seq approach. Deep sequencing produced over 15 million reads with lengths of 86 base
pairs from each cDNA library. A total of 7,155 genes were found to exhibit at least 3-fold
changes in expression between green and white curds. These included light-regulated genes,
genes encoding chloroplast constituents, and genes involved in chlorophyll biosynthesis.
Moreover, we discovered that the cauliflower ELONGATED HYPOCOTYL5 (BoHY5) was
expressed higher in green curds than white curds and that 2616 HY5-targeted genes, including
1600 up-regulated genes and 1016 down-regulated genes, were differently expressed in green in
comparison to white curd tissue. All these 1600 up-regulated genes were HY5-targeted genes in
the light.
Conclusions: The genome-wide profiling of gene expression by RNA-seq in green curds led to
the identification of large numbers of genes associated with chloroplast development, and
suggested the role of regulatory genes in the high hierarchy of light signaling pathways in
mediating the ectopic chloroplast development in the green curd cauliflower mutant.
3
Background
Chloroplast biogenesis from proplastids requires coordinate expression of nuclear and
chloroplast genes [1], and is largely regulated by developmental and environmental cues such as
light. Approximately 3000 proteins in chloroplasts are encoded by the nucleus [2]. They
participate in a large number of functional processes that are required for chloroplast biogenesis.
These processes include import of nuclear encoded proteins through the Toc/Tic complexes,
protein assembly and disassembly with chaperone proteins, thylakoid formation, pigment
synthesis, plastid divisions, and retrograde signaling [3,4]. In addition, a great number of proteins
localized outside chloroplasts, such as photoreceptors, light-signaling transducers, and
transcription factors, have been shown to be involved in chloroplast development [3,4]. On the
one hand, most genes belonging to these two classes are essential for chloroplast development
since suppression of their expressions leads to impaired chloroplasts. On the other hand, some
light signaling pathway genes, such as CONSTITUTIVE PHOTOMORPHOGENIC 1 (COP1),
COP10, COP11, DE-ETIOLATED 1 (DET1) and PHYTOCHROME-INTERACTING
TRANSCRIPTION FACTOR 3 (PIF3), function as suppressors of light-regulated gene expression
and loss-of-function mutations of these genes result in ectopic chloroplast development [5-7]. In
contrast, ELONGATED HYPOCOTYL 5 (HY5) that acts downstream of multiple families of
photoreceptors [8-10] has been genetically characterized as a positive regulator of
photomorphogenesis under a broad spectrum of light and affects chloroplast development [4,11].
Overexpression of HY5-∆N77 has been shown to result in precocious development of
chloroplasts in the hypocotyls [12]. Determining how these genes are coordinately expressed
during chloroplast development requires a genome-wide examination of gene expression during
the transition from non-colored plastids into chloroplasts.
Mutations in model and other plant species are important resources for functional
genomics studies. Analyses of some plastid development mutants identify important regulatory
genes of plastid development. For example, ARC6, the first gene discovered to have a global
effect on plastid differentiation in higher plants, was identified from an Arabidopsis mutant arc6
[13]. The Orange (Or) gene that encodes a zinc-finger DnaJ cysteine rich domain containing
protein is isolated from the orange curd cauliflower mutant and has been proven to be
responsible for the conversion of leucoplasts into chromoplasts [14]. The green curd cauliflower
4
mutant is a spontaneous mutation with an abnormal pattern of chloroplast development in curds.
Compared with other mutants in which chloroplast development is impaired, the green curd
mutant is unique in turning otherwise non-photosynthetic white tissue into green color with the
ectopic development of chloroplasts in the inflorescence meristematic cells. The mutation in the
green curd cauliflower could involve the gene(s) sufficient for chloroplast development, although
there is possibility that the white curd cauliflower carries a genetic mechanism for the
suppression of chloroplast development, which the green curd mutation would suppress.
In the present study, we profiled gene expression in green and white curds on the genome
scale using the RNA-seq approach. We assembled 118,000 unigenes with an average length of
406 bp from cDNA libraries of green and white curds and detected 7155 differentially expressed
genes with a change in expression of at least 3-fold. Among them are a large number of genes
associated with chloroplast development. We also observed that BoHY5 was expressed at higher
level in green curds than in white curds and that 2616 HY5-targeted genes were expressed
differentially. Among these HY5-targeted genes, all the 1600 up-regulated genes were found to
be HY5-targeted genes in the light in Arabidopsis, suggesting a role of BoHY5 with the ectopic
chloroplast development in the green curd cauliflower mutant.
Results
Cauliflower mutant with green curds
Cauliflower curd is composed of inflorescence meristems that normally contain proplastids and
leucoplasts and is therefore white [15]. In the commercially available green cauliflower mutant,
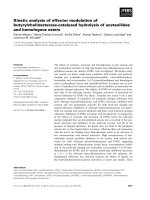
chloroplasts are developed in the curd, turning the otherwise white tissue green (Figure 1a and
1b). While the mutant plants produced green curds under normal growth conditions in
greenhouse and in field, the intensity of green hue in the curd tissues was affected by light
intensity. Under field growth conditions, the curd tissues exposed to direct sunlight showed dark
green color and those grown in shade exhibited less green hue. Autofluorescence of chlorophyll
in chloroplasts was clearly observed in the green curd cells under the confocal microscope
(Figure 1c and 1d).
To investigate chloroplast development in the green curd mutant, we first measured
chlorophyll content in young leaf and curd tissues. Higher level of total chlorophyll was detected
5
in leaf tissue of green cauliflower plants than that of the white control. The concentration of
chlorophyll in green curd cauliflower leaves was 1780.4 µg/g fresh weights (FW), while that in
the white curd leaves was 1056.6 µg/g FW. Although different levels of total chlorophyll were
observed between the two samples, the ratio of chlorophyll a/b for leaves in white and green
mutant was similar at 2.70:1 and 2.75:1, respectively. In comparison to leaf tissue, the
chlorophyll level in the curd of green cauliflower was lower at 344.4 µg/g FW. The chlorophyll
a/b ratio was 3.43:1, showing that the accumulation of chlorophyll a was much greater than that
of chlorophyll b in green curds (Figure 1e). As expected, no chlorophyll accumulation was
detected in the white curd tissue. The green curd cauliflower mutant serves as an excellent model
system for investigating the genetic basis of chloroplast biogenesis in plants.
Comparative analysis of gene expression between green and white curd cauliflower
To investigate the transcriptional control of chloroplast development, RNA-seq was employed to
monitor differences in gene expression between the green curd mutant and the white cauliflower.
A single lane of an Illumina GAII run was utilized for each library and a total of more than 15
million 86-bp reads from each lane were produced. Since currently there is no full genome
sequence available for cauliflower (Brassica oleracea) and the genomics resources from other
Brassica species are not applicable due to the short length of RNA-seq reads, we developed a
novel analysis strategy for our RNA-seq data as described in the Methods section. A total of
118,000 unigenes (including alternative spliced isoforms) with an average length of 406 bp were
obtained. Statistical analysis identified 7155 unigenes that were differentially expressed between
green curd mutant and white curd control. Among them, 4436 genes (3.76%) were expressed at
least 3-fold higher (Additional file 1) and 2719 genes (2.3%) were expressed at least 3-fold lower
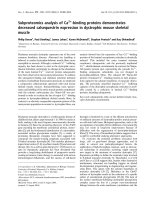
in green curd than in white curd (Additional file 2). Functional categorization revealed that these
genes were largely involved in cellular process (1317), response to stress (980), metabolic
process (810), response to abiotic stimulus (654), and biosynthetic process (574). Yet, a large
group of genes (3602) remained unclassified (Figure 2).
Verification of gene expression by quantitative RT-PCR
In order to verify the expression profiles obtained from the RNA-seq approach, qRT-PCR was
utilized to analyze the expression of 14 selected genes. These genes encode light signal
6
transducers (FAR1, CRY2, PHOT2, LSH7, HY5, CIP1), photosystem II component (LHCB5),
chloroplast constituents (GUN5, LHCB1.5, Toc159, HSC70-1, ACP), ATP-dependent peptidase
(FtsH8) and chlorophyll synthetase (G4). Among them were 11 up-regulated genes (FAR1,
CRY2, PHOT2, HY5, G4, Toc159, LHCB5, GUN5, LHCB1.5, FtsH8, and ACP) and 3 down-
regulated genes (HSC70-1, CIP1, LSH7). The trends of the observed expression patterns of these
genes from qRT-PCR were consistent with that determined by the RNA-seq approach (Table 1).
However, there were differences at the fold level as reported in other studies [16].
Metabolic pathway changes
To identify the metabolic pathways that were affected in the green curd mutant, a cauliflower
metabolic pathway database was created based on annotation of the assembled cauliflower
unigenes. The significantly affected pathways were identified by using the Plant MetGenMAP
analysis system ( [17]. A total of
198 specific metabolic pathways were significantly changed in green curd mutant (p<0.01)
(Additional file 3). As expected, many metabolic pathways involved in chloroplast biogenesis
and function were significantly altered. These included those associated with chlorophyll
biosynthesis, such as chlorophyllide a biosynthesis I, chlorophyll a biosynthesis I, chlorophyll a
biosynthesis II, chlorophyll a degradation, and chlorophyll cycle, as well as with carotenoid
biosynthesis (Additional file 3). In addition, those pathways associated with photosynthesis, such
as oxygenic photosynthesis, Calvin cycle, and photorespiration, and with other metabolic
processes that take place in chloroplasts, such as amino acid biosynthesis and starch biosynthesis,
were also significantly changed (Additional file 3).
Genes involved in chloroplast formation
Chlorophylls and carotenoids compose the photosynthetic pigments that play key roles in
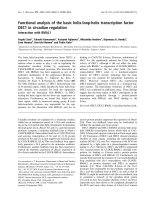
photosynthesis. Many genes involved in chlorophyll biosynthesis were found to be expressed
highly in green curd in comparison with white (Figure 3). The upregulated genes included Mg-
chelatase that plays a key regulatory role in chloroplast biosynthesis. GENOMES UNCOUPLED
4 (GUN4, PP005347) and GENOMES UNCOUPLED 5 (GUN5, PP031929) involved in
chlorophyll biosynthesis were also expressed at higher levels in green curds. These two genes are
among those that produce plastid-to-nuclear retrograde signaling molecules [18,19]. The
7
upregulation of many genes in chlorophyll biosynthesis resulted in the accumulation of
chlorophyll a and b in chloroplasts. Concomitantly, a number of genes involved in carotenoid
biosynthesis were also up-regulated (Table 2), suggesting an increased capacity for the synthesis
of photosynthetic pigments. Consistent with the accumulation of chlorophyll a and b in green
curds, genes encoding chlorophyll binding proteins were also up-regulated (Table 2). Moreover,
genes encoding photosystem I and photosystem II proteins were among the up-regulated genes
(Table 2), indicating the development of chloroplast structures in the green curd tissue.
In addition to the enhanced biosynthesis of photosynthetic apparatus, genes involved in a
number of other chloroplast biogenesis processes were also differentially expressed in green curd
mutant. TRANSLOCON AT THE OUTER ENVELOPE MEMBRANE OF CHLOROPLASTS
34 (Toc34) and Toc159 are important parts of the Toc/Tic complexes mediating protein import
from cytosol [1]. High levels of Toc34 (PP019500 and PP051864) and Toc159 (PP013646 and
PP007289) transcripts were observed in the green curds. Proteins imported into chloroplasts need
to be properly assembled and folded, a process that is mediated by a group of chaperone proteins,
such as HSP70 and Cpn60, and protein disulfide isomerase [3,20,21]. Accordingly, chaperone
HSP70 (PP031462, PP020739, and PP094292) and protein disulfide isomerase (PP012584,
PP000051, and PP028760) were found to be significantly upregulated in green curds (Additional
file 1).
Chlorophyllase catalyzes degradation of chlorophyll a to yield chlorophyllide and phytol
[22]. Chlorophyllase (PP095462) was expressed lower in green curds than in white curds, which
could account for the accumulation of chlorophyll a in green curds (Figure 3).
Signaling genes for chloroplast biogenesis
The large number of differentially expressed genes between the green curd mutant and white
curd cauliflower suggests that genes at high hierarchy in the signal transduction cascade could be
involved. COP/DET/FUS are a group of evolutionarily conserved proteins that represent central
repressors of photomorphogenesis including chloroplast development [11]. No changes were
detected in the expression of COP1, COP10, COP11, and DET1. COP9 complex acts as a
suppressor of chloroplast development [5,23]. Unexpectedly, we found that COP9 (PP010178)
and FUSCA 12 (FUS12)/COP9 signalosome complex subunit 2 (PP014936) were expressed at
higher levels in green curds than in white curds. Such higher expression could be a result of a
8
negative feedback as the case of SPA1, a partner of COP1, which is frequently found to be light
induced [24,25]. PIFs are another group of regulators that repress photomorphogenesis. No
changes were observed for the expression of PIF3 and PIF4 in the green vs. white curds.
Interestingly, the transcript of PIL2 (PP058986) was increased in the green curd mutant.
In contrast to those photomorphogenesis repressors, HY5 is a key regulator that promotes
photomorphogenic development in all light conditions and directly regulates the light-responsive
gene expression [8,9,26-28]. Here, we found that BoHY5 (PP014970 and PP017071) and BoHY5-
HOMOLOG (PP001428) were expressed at higher levels in green curds than white curds (Table
1 and Figure 4c). A recent study on genome-wide mapping of the Hy5-mediated gene networks
in Arabidopsis reveals that HY5 could potentially bind to 11,797 genes with 2770 and 2191
being light and dark regulated genes, respectively [26]. Sequence comparison with the HY5-
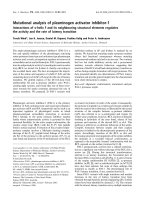
targeted genes in Arabidopsis revealed that a total of 2616 cauliflower HY5-targeted homolog
genes were differentially expressed in green curds (Figure 4a). Among them included 1600 up-
regulated genes and 1016 down-regulated genes (Additional file 4 and 5). All of the 1600 up-
regulated genes were found to be HY5-targeted genes in the light, while 48 down-regulated
genes were HY5-targeted genes in the dark (Figure 4b). Among the 1600 up-regulated HY5-
targeted genes were 98 transcription factors, including ARABIDOPSIS THALIANA HOMEOBOX
1 (ATHB-1, PP003454), PHYTOCHROME-ASSOCIATED PROTEIN 1 (PP002569),
PHYTOCHROME INTERACTING FACTOR 3-LIKE 2 (PP058986) and INDOLE-3-ACETIC
ACID INDUCIBLE (IAA1, PP013005). Forty-four transcription factors including RAP2.2
(PP072648), APETALA1 (PP029050), AUXIN RESPONSE FACTOR 6 (PP006891), and SHORT
HYPOCOTYL 2 (PP011787) were down-regulated in green curds. The significant alteration of a
large number of transcription factors could cause profound effects on chloroplast biogenesis
and/or other processes.
Discussion
Large-scale transcriptome sequencing by next generation sequencing platforms such as the
Illumina GA sequencing system has proven to be a powerful and efficient approach for gene
expression analysis at the genome level and offers several advantages over microarray
technologies [29]. Since the RNA-seq approach provides digital representation of the gene
9
abundance and the statistics are well modeled by the Poisson distribution, even a single
replication has been shown to be adequate [30]. Currently, the RNA-seq approach has been
widely used to investigate transcriptomes of plants and animals, especially for those having
whole genome sequences [31]. A number of tools to map RNA-seq data to reference genomes
and to quantify the expression of transcripts have been developed [32]. However, relatively
fewer reports have shown studies on using the RNA-seq approach for organisms without
reference genomes. In this report we employed the RNA-seq approach to investigate the gene
expression changes in a green curd mutant in order to elucidate the genetic basis of chloroplast
biogenesis and development. RNA-seq reads along with publicly available ESTs of cauliflower
were assembled de novo using a novel assembly strategy as described in the Methods section. A
total of 118, 000 unigenes were obtained and 7155 genes showed at least 3-fold changes in
expression in green curd mutant. Among them, a large number of genes involved in
photomorphogenesis including chloroplast development were revealed, demonstrating a
successful use of the RNA-seq approach to profile gene expression in a species without a fully
sequenced genome.
Chloroplast biogenesis and development proceed with the coordinated action of many
processes [3,4]. Both environmental signals and plastidic/nuclear factors affect these processes.
Light regulation of chloroplast development has been well-documented [3,4,33]. The light
signaling pathways are composed of phytochromes, transcription factors and numerous
intermediates which control photomorphogenesis including chloroplast development. The
COP/DET/FUS proteins are suggested to have a function in suppressing chloroplast development
in non-photosynthetic tissues [4]. Loss of function mutation of these regulators, such as cop1 and
det1, has been shown to result in ectopic chloroplast development, leading to greening in
Arabidopsis roots [5,6]. The fact that the transcripts of COP1 and DET1 remained unchanged
and a large number of light-responsive genes were altered in green curds of cauliflower suggests
that other regulatory genes in the hierarchy of photomorphogenic regulation are responsible for
chloroplast development in the green curd.
In the light signaling cascade, HY5 plays an important role in light signaling and
chloroplast development. HY5 receives upstream signals and activates a large number of genes
by directly binding to the G-box in the promoters of these genes [9,26,27]. Here, we observed
higher level of HY5 transcript in the green curd mutant. Furthermore, 2616 cauliflower homologs
10
of HY5-targeted genes were differentially expressed in green curds. Noticeably, among the 2616
genes, 1600 were up-regulated genes in green curd cauliflower. The fact that all 1600 up-
regulated genes were the HY5-targeted genes in the light suggests an important role of elevated
expression of BoHY5 in mediating chloroplast development in green curd cauliflower mutant.
Furthermore, it is known that COP1 negatively controls HY5 activity [12]. Although COP1 was
expressed at the same level between green curds and white curds, we found that CIP1 was
significantly reduced in green curds (Figure 4c). Arabidopsis CIP1 is associated with the
cytoskeleton and has been hypothesized to affect partitioning of COP1 in the nucleus and
cytoplasm [34]. It is possible that COP1 activity in the nucleus might be affected by low level of
CIP1, causing ectopic chloroplast development in green curds. Thus, BoHY5 and/or the other
genes at the high hierarchy in the signal transduction cascade could be responsible or work in
concert to regulate chloroplast biogenesis and development in otherwise white tissue to give rise
to the striking green curd mutant phenotype.
Ultimately, the development of chloroplasts requires the coordinated action of a number
of processes, including the biosynthesis of photosynthetic complexes, transportation of nuclear
encoded proteins into chloroplasts, processing of the imported proteins, and assembly of the
photosynthetic apparatus [3,4]. Indeed, many genes involved in photosynthetic pigment
biosynthesis along with pigment-binding proteins such as chlorophyll a/b binding proteins were
discovered to be upregulated in our genome-wide profiling of green curd cauliflower. The
majority of chloroplast proteins are nucleus-encoded and enter the chloroplasts via the Toc/Tic
translocon complexes [1]. The increased expression of Toc genes in the green curd mutant
supports an enhanced activity of chloroplast-targeted protein import. The imported proteins are
folded and processed to form functional proteins. Molecular chaperones HSP70 and Cpn60 have
long been known to be involved in this process [3,20]. A recent study shows that a protein
disulfide isomerase is also required for protein folding [21]. Consistent with the increased
activity of protein import, genes associated with protein folding and assembling were expressed
highly in the green curd mutant for chloroplast development.
Conclusions
In the present study, we compared gene expression on a genome-wide scale by using RNA-seq in
a species without a reference genome. This study identified a great number of genes associated
11
with chloroplast development and suggested the potential role of elevated expression of BoHY5
and/or other regulatory genes in the high hierarchy of light signaling pathways for the ectopic
chloroplast development in green curd cauliflower. Our results indicate that RNA-seq as a
powerful tool in a genomic era could accelerate the functional identification of genes and aid in
dissecting the genetic basis of naturally-occurring variations in crops.
Methods
Plant materials
White curd cauliflower cultivar Stovepipe (Brassica oleracea L. var. botrytis) and the green curd
mutant line ACX800 were used in this study. Cauliflower plants were grown either in a
greenhouse under 14-h-light/10-h-dark cycle at 23
°
C or in a field. In the greenhouse, the natural
daylight was supplied by full-spectrum lamps with the light intensity at 400 µmol photons m
- 2
s
-1
.
Fresh curd tissues were harvested, immediately frozen in liquid nitrogen, and stored at -80
°
C for
RNA extraction and chlorophyll extraction.
RNA extraction and construction of cDNA library for sequencing
Total RNA was extracted from pooled curd tissue using the TRIzol reagent according to the
manufacturer’s instruction (Invitrogen, Carlsbad, CA), and was further purified with the
RNeasyPlant Mini Kit (Qiagen, Valencia, CA). The cDNA libraries of green and white
cauliflower from five micrograms of total RNA were constructed using the mRNA Sequencing
Sample Preparation Kit following the manufacturer’s instruction (Illumina, San Diego, CA,
USA). Sequencing was carried out on an Illumina/Solexa Genome Analyzer II system at the
Cornell University Life Sciences Core Laboratories Center.
RNA-seq data processing and analysis
The raw Illumina RNA-seq reads were first processed to remove low quality regions and adaptor
sequences using an in-house perl script. To eliminate rRNA sequence contamination, the reads
were then aligned to cauliflower ribosomal RNA (rRNA) sequences using Bowtie [35], allowing
up to two mismatches. A total of ~60,000 cauliflower Sanger ESTs were collected from
GenBank in June, 2010. These ESTs were screened against the NCBI UniVec database, the
Escherichia coli genome, and cauliflower rRNA sequences, to remove those contaminant
12
sequences. The resulting high quality ESTs were assembled into unigenes using iAssembler
( The processed Illumina reads were then aligned
to the cauliflower EST-unigenes using Bowtie [35], allowing up to two mismatches. A de novo
assembly of the unaligned reads was then performed using ABySS [36]. The unigenes assembled
from ESTs and unaligned Illumina reads, respectively, were further assembled using iAssembler.
Following mapping to EST-unigenes and de novo assembly, transcript count information for
sequences corresponding to each unigene were compared to obtain relative expression levels
following normalization to RPKM (reads per kilobase of exon model per million mapped reads)
[37]. The significance of differential gene expression between the green and white curds was
determined using the R statistical method described by Stekel et al. [38] and raw p-values were
adjusted for multiple tests using the false discovery rate [39]. Genes with a false discovery rate <
0.01 and a fold change no less than 3 were identified as differentially expressed genes between
green and white curds.
To identify biological processes affected in the green curd mutant, the differentially
expressed genes were annotated by assigning gene ontology (GO) terms. Potential roles of
differentially expressed genes in some specific biological processes were identified. In addition,
we created a metabolic pathway database based on the annotation information of the assembled
cauliflower unigenes using the Pathway Tools [40]. The pathway database was then integrated
into the Plant MetGenMAP system [17] to identify the significantly affected pathways.
Verification of RNA-Seq by quantitative RT-PCR
The cDNA was synthesized using oligo-dT primers and Superscript reverse transcriptase III
(Invitrogen, Carlsbad, CA). qRT-PCR was conducted by using the SYBR Green PCR master mix
(Applied Biosystems, CA). The cycling conditions involved denaturation at 95 °C for 10 min,
followed by 40 cycles of 95 °C for 15 s and 60 °C for 60 s. The dissociation curves were
analyzed to verify the specificity of RT-PCR. The relative expression of selected genes was
normalized to a cauliflower actin gene [14]. Values reported represent the average of two
biological repeats with three independent trials. Gene-specific primers used are listed in
Additional file 6.
Chlorophyll determination
13
Fifty milligrams of curds were ground in liquid nitrogen, and 1 mL of 80% acetone was added to
extract chlorophyll. After centrifugation at 12,000g for 5 min, the supernatant was transferred
into the new tube and measured at OD
645
and OD
663
. Chlorophyll concentrations were calculated
by using MacKinney's coefficients in the following equations: Chlorophyll a=12.7*(OD
663
)-
2.69*(OD
645
) and Chlorophyll b=22.9*(OD
645
)-4.48*(OD
663
) [41].
Confocal analysis of chloroplasts in green curds
Fresh green curd cauliflower tissue was hand-sectioned and examined under Leica TCS SP5
Laser Scanning Confocal Microscope (Leica Microsystems, Exon, PA USA) to detect the
autofluorescence of chlorophyll with argon laser excitation at 488 nm and emission filter at 680
nm.
List of abbreviations
COP1, CONSTITUTIVE PHOTOMORPHOGENIC 1; DET1, DE-ETIOLATED 1; HY5,
ELONGATED HYPOCOTYL 5; PHYA, PHYTOCHROME A; PIF3, PHYTOCHROME-
INTERACTING TRANSCRIPTION FACTOR 3; FAR1, FAR-RED-IMPAIRED RESPONSE 1;
CRY2, CRYPTOCHROME 2; PHOT2, PHOTOTROPIN 2; LSH7, LIGHT SENSITIVE
HYPOCOTYLS 7; CIP1, COP1-INTERACTIVE PROTEIN 1; LHCB5, LIGHT HARVESTING
COMPLEX OF PHOTOSYSTEM II 5; GUN5, GENOMES UNCOUPLED 5; LHCB1.5,
PHOTOSYSTEM II LIGHT HARVESTING COMPLEX GENE 1.5; Toc159, TRANSLOCON
AT THE OUTER ENVELOPE MEMBRANE OF CHLOROPLASTS 159; HSC70-1,
CHLOROPLAST HEAT SHOCK PROTEIN 70-1; FtsH8, ATP-dependent
peptidase/ATPase/metallopeptidase; G4, chlorophyll synthetase.
Authors’ contributions
XZ designed the research, conducted molecular and biochemical analyses, and wrote the
manuscript. ZF performed the bioinformatics data analysis. TWT participated in the initial
design and discussion of the project, and editing of the manuscript. LL conceived the research
and participated in the writing of the manuscript. All authors read and approved the final version
of the manuscript.
14
Acknowledgements
We thank Yong-Qiang Wang for helping with the analysis of the BoHY5-targeted genes. We
thank Lei Li and Huiyong Zhang from University of Virginia for sharing the list of HY5-targeted
genes in Arabidopsis. We thank D. Reed for assistance in growing cauliflower in the field. This
work was supported by the USDA-ARS base fund and by the CAS/SAFEA International
Partnership Program for Creative Research Teams (20090491019)". USDA is an equal
opportunity provider and employer. Mention of trade names or commercial products in this
publication is solely for the purpose of providing specific information and does not imply
recommendation or endorsement by the U.S. Department of Agriculture.
15
References
1. Kessler F, Schnell D: Chloroplast biogenesis: diversity and regulation of the protein
import apparatus. Curr Opin Cell Biol 2009, 21:494-500.
2. Leister D: Chloroplast research in the genomic age. Trends Genet 2003, 19:47-56.
3. Pogson BJ, Albrecht V: Genetic dissection of chloroplast biogenesis and development:
an overview. Plant Physiol 2011.
4. Waters MT, Langdale JA: The making of a chloroplast. EMBO J 2009, 28:2861-2873.
5. Wei N, Deng XW: The role of the COP/DET/FUS genes in light control of Arabidopsis
seedling development. Plant Physiol 1996, 112:871-878.
6. Chory J, Peto CA: Mutations in the DET1 gene affect cell-type-specific expression of
light-regulated genes and chloroplast development in Arabidopsis. Proc Natl Acad Sci
U S A 1990, 87:8776-8780.
7. Stephenson PG, Fankhauser C, Terry MJ: PIF3 is a repressor of chloroplast
development. Proc Natl Acad Sci USA 2009, 106:7654-7659.
8. Oyama T, Shimura Y, Okada K: The Arabidopsis HY5 gene encodes a bZIP protein that
regulates stimulus-induced development of root and hypocotyl. Genes Dev 1997,
11:2983-2995.
9. Chattopadhyay S, Ang LH, Puente P, Deng XW, Wei N: Arabidopsis bZIP protein HY5
directly interacts with light-responsive promoters in mediating light control of gene
expression. Plant Cell 1998, 10:673-683.
10. Saijo Y, Sullivan JA, Wang H, Yang J, Shen Y, Rubio V, Ma L, Hoecker U, Deng XW:
The COP1-SPA1 interaction defines a critical step in phytochrome A-mediated
regulation of HY5 activity. Genes Dev 2003, 17:2642-2647.
11. Lau OS, Deng XW: Plant hormone signaling lightens up: integrators of light and
hormones. Curr Opin Plant Biol 2010, 13(5):571-577.
12. Ang LH, Chattopadhyay S, Wei N, Oyama T, Okada K, Batschauer A, Deng XW:
Molecular interaction between COP1 and HY5 defines a regulatory switch for light
control of Arabidopsis development. Mol Cell 1998, 1:213-222.
13. Robertson EJ, Pyke KA, Leech RM: arc6, an extreme chloroplast division mutant of
Arabidopsis also alters proplastid proliferation and morphology in shoot and root
apices. J Cell Sci 1995, 108:2937-2944.
14. Lu S, Van EJ, Zhou X, Lopez AB, O'Halloran DM, Cosman KM, Conlin BJ, Paolillo DJ,
Garvin DF, Vrebalov J et al.: The cauliflower Or gene encodes a DnaJ cysteine-rich
16
domain-containing protein that mediates high levels of beta-carotene accumulation.
Plant Cell 2006, 18:3594-3605.
15. Paolillo DJ, Jr., Garvin DF, Parthasarathy MV: The chromoplasts of Or mutants of
cauliflower (Brassica oleracea L. var. botrytis). Protoplasma 2004, 224:245-253.
16. Wu JA, Zhang YL, Zhang HQ, Huang H, Folta KM, Lu JA: Whole genome wide
expression profiles of Vitis amurensis grape responding to downy mildew by using
Solexa sequencing technology. BMC Plant Biol 2010, 10.
17. Joung JG, Corbett AM, Fellman SM, Tieman DM, Klee HJ, Giovannoni JJ, Fei Z: Plant
MetGenMAP: an integrative analysis system for plant systems biology. Plant Physiol
2009, 151:1758-1768.
18. Larkin RM, Alonso JM, Ecker JR, Chory J: GUN4, a regulator of chlorophyll synthesis
and intracellular signaling. Science 2003, 299:902-906.
19. Mochizuki N, Brusslan JA, Larkin R, Nagatani A, Chory J: Arabidopsis genomes
uncoupled 5 (GUN5) mutant reveals the involvement of Mg-chelatase H subunit in
plastid-to-nucleus signal transduction. Proc Natl Acad Sci USA 2001, 98:2053-2058.
20. Latijnhouwers M, Xu XM, Moller SG: Arabidopsis stromal 70-kDa heat shock proteins
are essential for chloroplast development. Planta 2010, 232:567-578.
21. Shimada H, Mochizuki M, Ogura K, Froehlich JE, Osteryoung KW, Shirano Y, Shibata D,
Masuda S, Mori K, Takamiya KI: Arabidopsis cotyledon-specific chloroplast biogenesis
factor CYO1 is a protein disulfide isomerase. Plant Cell 2007, 19:3157-3169.
22. Tsuchiya T, Ohta H, Okawa K, Iwamatsu A, Shimada H, Masuda T, Takamiya Ki:
Cloning of chlorophyllase, the key enzyme in chlorophyll degradation: Finding of a
lipase motif and the induction by methyl jasmonate. Proc Natl Acad Sci USA 1999,
96:15362-15367.
23. Wei N, Chamovitz DA, Deng XW: Arabidopsis COP9 is a component of a novel
signaling complex mediating light control of development. Cell 1994, 78:117-124.
24. Hoecker U, Quail PH: The phytochrome A-specific signaling intermediate SPA1
interacts directly with COP1, a constitutive repressor of light signaling in Arabidopsis.
J Biol Chem 2001, 276:38173-38178.
25. Hoecker U, Tepperman JM, Quail PH: SPA1, a WD-repeat protein specific to
phytochrome A signal transduction. Science 1999, 284:496-499.
26. Zhang HY, He H, Wang XC, Wang XF, Yang XZ, Li L, Deng XW: Genome-wide
mapping of the HY5-mediated genenetworks in Arabidopsis that involve both
transcriptional and post-transcriptional regulation. Plant J 2011, 65:346-358.
17
27. Lee J, He K, Stolc V, Lee H, Figueroa P, Gao Y, Tongprasit W, Zhao HY, Lee I, Deng X:
Analysis of transcription factor HY5 genomic binding sites revealed its hierarchical
role in light regulation of development. Plant Cell 2007, 19:731-749.
28. Li J, Li G, Gao S, Martinez C, He G, Zhou Z, Huang X, Lee JH, Zhang H, Shen Y et al.:
Arabidopsis transcription factor ELONGATED HYPOCOTYL5 plays a role in the
feedback regulation of phytochrome a signaling. Plant Cell 2010, 22:3634-3649.
29. Hurd PJ, Nelson CJ: Advantages of next-generation sequencing versus the microarray
in epigenetic research. Brief Funct Genomics 2009, 8:174-183.
30. Brenner S, Johnson M, Bridgham J, Golda G, Lloyd DH, Johnson D, Luo S, McCurdy S,
Foy M, Ewan M et al.: Gene expression analysis by massively parallel signature
sequencing (MPSS) on microbead arrays. Nat Biotech 2000, 18:630-634.
31. Li P, Ponnala L, Gandotra N, Wang L, Si Y, Tausta SL, Kebrom TH, Provart N, Patel R,
Myers CR et al.: The developmental dynamics of the maize leaf transcriptome. Nat
Genet 2010, 42:1060-1067.
32. Huang X, Wei X, Sang T, Zhao Q, Feng Q, Zhao Y, Li C, Zhu C, Lu T, Zhang Z et al.:
Genome-wide association studies of 14 agronomic traits in rice landraces. Nat Genet
2010, 42:961-967.
33. Mullet JE: Chloroplast development and gene expression. Annu Rev Plant Physiol Plant
Mol Biol 1988, 39:475-502.
34. Matsui M, Stoop CD, von Arnim AG, Wei N, Deng XW: Arabidopsis COP1 protein
specifically interacts in vitro with a cytoskeleton-associated protein, CIP1. Proc Natl
Acad Sci USA 1995, 92:4239-4243.
35. Langmead B, Trapnell C, Pop M, Salzberg SL: Ultrafast and memory-efficient
alignment of short DNA sequences to the human genome. Genome Biol 2009, 10.
36. Birol I, Jackman SD, Nielsen CB, Qian JQ, Varhol R, Stazyk G, Morin RD, Zhao Y, Hirst
M, Schein JE et al.: De novo transcriptome assembly with ABySS. Bioinformatics 2009,
25:2872-2877.
37. Mortazavi A, Williams BA, Mccue K, Schaeffer L, Wold B: Mapping and quantifying
mammalian transcriptomes by RNA-Seq. Nature Med 2008, 5:621-628.
38. Stekel DJ, Git Y, Falciani F: The comparison of gene expression from multiple cDNA
libraries. Genome Res 2000, 10:2055-2061.
39. Benjamini Y, Hochberg Y: Controlling the false discovery rate - a practical and
powerful approach to multiple testing. J R Stat Soc Ser B 1995, 57:289-300.
40. Karp PD, Paley S, Romero P: The pathway tools software. Bioinformatics 2002,
18:S225-S232.
18
41. Arnon DI: Copper enzymes in isolated chloroplasts. Polyphenoloxidase in Beta
Vulgaris. Plant Physiol 1949, 24:1-15.
19
Additional material
Additional file 1: Up-regulated genes in green curd cauliflower mutant.
Additional file 2: Down-regulated genes in green curd cauliflower mutant.
Additional file 3: Significantly changed pathways in green curd cauliflower mutant.
Additional file 4: Up-regulated HY5-targeted genes in green curds.
Additional file 5: Down-regulated HY5-targeted genes in green curds.
Additional file 6: Primer sequences used in this study.
20
Table 1. Verification of gene expression by qRT-PCR
Genes
RPKM
white
RPKM
green
Ratio
green/white
qRT-PCR Ratio*
green/white
Toc159
0 23.1 23.1 4.52
ACP
0 18.7 18.7 1.47
FtsH8
0 12.8 12.8 1.55
LHCB1.5
50.6 320 6.32 7.84
G4
7.8 45.5 5.83 2.7
FAR1
2 8.2 4.1 1.64
CRY2
4.4 18.6 4.23 6.91
HY5
0 7.1 7.1 4.09
PHOT2
2 6.5 3.25 2.06
LHCB5
24.4 90.1 3.69 4.02
GUN5
3.6 14.5 4.03 4.81
CIP1
14.7 4.1 0.28 0.27
LSH7
9.1 1.8 0.2 0.63
HSP70-1 59.2 0.5 0.01 0.0003
*qRT-PCR was carried out with two biological repeats and three technical trials.
21
Table 2. Genes encoding carotenoid biosynthetic enzymes, chlorophyll binding proteins and
photosystem proteins
RPKM green/white Top hit
unigene ID
white green ratio p value ID description* e value
Carotenoid biosynthesis
PP038070 0.3 7 23.3333 0 AT4G25700.1 CAROTENE BETA-RING
HYDROXYLASE
8e-093
PP043130 0.3 4.2 14 0 AT4G25700.1 CAROTENE BETA-RING
HYDROXYLASE
6e-036
PP013262 0.7 3.5 5 5.64E-06 AT3G21500.2 1-DEOXY-D-XYLULOSE-5-
PHOSPHATE SYNTHASE
1e-032
PP011276 1.1 4.3 3.90909 2.88E-06 AT5G67030.1 ZEAXANTHIN EPOXIDASE 1e-034
PP088927 5.4 18.9 3.5 0 AT4G15560.1 1-DEOXY-D-XYLULOSE-5-
PHOSPHATE SYNTHASE
1e-054
Chlorophyll binding
PP019996 0.2 36.9 184.5 0 AT1G15820.1 LHCB6 8e-042
PP013404 1.1 100.8 91.6364 0 AT2G34430.1 LHCB1.4 4e-042
PP042072 0.2 12.1 60.5 0 AT1G29930.1 LHCB1.5 4e-047
PP032956 2.5 140.7 56.28 0 AT2G34430.1 LHCB1.4 5e-112
PP036244 0.5 15.5 31 0 AT3G54890.1 LHCA1 1e-131
PP026927 1 26.9 26.9 0 AT3G27690.1 LHCB2.3 4e-059
PP032648 0.5 12 24 0 AT2G34430.1 LHCB1.4 3e-144
PP034454 1.2 25.7 21.4167 0 AT3G27690.1 LHCB2.3 3e-096
PP014055 4.5 90.2 20.0444 0 AT1G29930.1 LHCB1.5 5e-120
PP022096 1.8 34.9 19.3889 0 AT3G54890.1 LHCA1 3e-043
PP016518 5.2 80.2 15.4231 0 AT1G61520.1 LHCA3 1e-096
PP036291 5.6 85.6 15.2857 0 AT3G61470.1 LHCA2 6e-103
PP002791 0.7 10.4 14.8571 0 AT1G15820.1 LHCB6 6e-026
PP060891 0 13.8 13.8 0 AT3G54890.1 LHCA1 3e-037
PP032891 0.7 9.4 13.4286 0 AT5G01530.1 LHCB4.1 2e-039
PP033574 1.4 18.1 12.9286 0 AT3G54890.1 LHCA1 9e-121
PP043522 2.1 25.6 12.1905 0 AT1G61520.1 LHCA3 5e-036
PP004292 6.9 83.9 12.1594 0 AT3G61470.1 LHCA2 4e-132
PP041756 1.1 13.3 12.0909 0 AT2G34430.1 LHCB1.4 6e-023
PP004529 21.5 259.4 12.0651 0 AT1G15820.1 LHCB6 1e-128
PP003367 14.8 176.1 11.8986 0 AT3G61470.1 LHCA2 7e-125
PP019899 28.5 328.4 11.5228 0 AT1G29930.1 LHCB1.5 2e-146
PP020291 40.5 445.8 11.0074 0 AT2G34430.1 LHCB1.4 1e-143
PP055138 0.7 7.6 10.8571 0 AT3G27690.1 LHCB2.3 9e-048
PP005460 2.1 21.5 10.2381 0 AT3G54890.2 LHCA1 9e-066
PP020373 0 9.9 9.9 0 AT3G08940.2 LHCB4.2 3e-025
PP021872 12.4 115 9.27419 0 AT3G08940.2 LHCB4.2 1e-144
PP034445 0.9 8.3 9.22222 0 AT3G27690.1 LHCB2.3 3e-099
PP003971 13.1 117.1 8.93893 0 AT3G54890.1 LHCA1 1e-135
PP034046 1.1 9.2 8.36364 0 AT5G54270.1 LHCB3 4e-153
PP033656 4 31.3 7.825 0 AT5G54270.1 LHCB3 1e-028
PP029126 6 46.1 7.68333 0 AT1G61520.1 LHCA3 3e-077
PP005284 6.7 47.7 7.1194 0 AT1G29930.1 LHCB1.5 2e-105
PP021031 36.8 258.7 7.02989 0 AT2G34430.1 LHCB1.4 1e-061
PP016372 2.4 16.7 6.95833 0 AT2G34430.1 LHCB1.4 7e-020
PP022981 6.9 47 6.81159 0 AT2G34430.1 LHCB1.4 6e-060
PP021682 14.1 91.5 6.48936 0 AT1G61520.1 LHCA3 2e-130
PP003968 50.6 320 6.32411 0 AT1G29930.1 LHCB1.5 9e-151
PP020586 22.7 135.7 5.97797 0 AT1G61520.1 LHCA3 3e-129
PP005425 5.4 26.2 4.85185 0 AT1G29910.1 LHCB1.5 1e-051
22
PP010147 48.6 226.7 4.66461 0 AT1G15820.1 LHCB6 5e-123
PP003504 66.3 305.1 4.60181 0 AT3G47470.1 LHCA4 8e-131
PP004840 40.6 181.7 4.47537 0 AT2G34430.1 LHCB1.4 4e-115
PP020865 14.6 61.6 4.21918 0 AT2G34430.1 LHCB1.4 2e-019
PP032222 8.6 34.2 3.97674 0 AT4G10340.1 LHCB5 7e-098
PP021166 104.1 391.8 3.76369 0 AT2G34430.1 LHCB1.4 6e-150
PP005062 24.4 90.1 3.69262 0 AT4G10340.1 LHCB5 2e-128
PP033260 4.3 15.8 3.67442 0 AT3G27690.1 LHCB2.3 3e-140
PP032950 102.9 376.3 3.65695 0 AT2G34430.1 LHCB1.4 5e-150
PP022979 10 33 3.3 0 AT1G44575.1 NPQ4 6e-068
PP001298 3.7 12 3.24324 0 AT5G01530.1 LHCB4.1 3e-031
PP021716 24.4 78.8 3.22951 0 AT4G10340.1 LHCB5 1e-133
PP003549 24.1 74.3 3.08299 0 AT1G44575.1 NPQ4 1e-107
Photosystem proteins
PP008642 0.2 25.8 129 0 AT3G21055.1 PSBTN (PHOTOSYSTEM II
SUBUNIT T)
5e-027
PP000591 0.5 54.9 109.8 0 AT1G03130.1 PSAD-2 (PHOTOSYSTEM I
SUBUNIT D-2)
1e-053
PP006879 0.1 4.7 47 0 P11594 OXYGEN-EVOLVING
ENHANCER PROTEIN 2
2e-012
PP004388 1.1 45.3 41.1818 0 AT1G55670.1 PSAG (PHOTOSYSTEM I
SUBUNIT G)
1e-066
PP016988 0.2 4.9 24.5 0 AT2G30570.1 PSBW (PHOTOSYSTEM II
REACTION CENTER W)
5e-025
PP018045 7.8 174.6 22.3846 0 AT1G08380.1 PSAO (PHOTOSYSTEM I
SUBUNIT O)
8e-070
PP036218 0.3 5 16.6667 0 ATCG00280.1
CP43 SUBUNIT OF THE
PHOTOSYSTEM II
REACTION CENTER
2.00E-171
PP032734 1.1 17.4 15.8182 0 AT1G08380.1 PSAO (PHOTOSYSTEM I
SUBUNIT O)
1e-065
PP020420 14.5 221.7 15.2897 0 AT1G06680.1 PSBP-1 (PHOTOSYSTEM II
SUBUNIT P-1)
9e-122
PP018042 0 14.7 14.7 0 AT1G52230.1 PSAH2 (PHOTOSYSTEM I
SUBUNIT H2)
2e-019
PP004848 3.4 49.6 14.5882 0 AT1G06680.1 PSBP-1 (PHOTOSYSTEM II
SUBUNIT P-1)
3e-118
PP014192 7.3 103.1 14.1233 0 AT3G21055.1 PSBTN (PHOTOSYSTEM II
SUBUNIT T)
6e-036
PP021663 4.9 63.5 12.9592 0 AT2G06520.1 PSBX (PHOTOSYSTEM II
SUBUNIT X)
1e-038
PP069357 0.7 8.2 11.7143 0 AT3G21055.1 PSBTN (PHOTOSYSTEM II
SUBUNIT T)
1e-035
PP005143 6.3 68.6 10.8889 0 AT4G12800.1 PSAL (PHOTOSYSTEM I
SUBUNIT L)
5e-096
PP016409 7.1 60.7 8.5493 0 AT1G08380.1 PSAO (PHOTOSYSTEM I
SUBUNIT O)
2e-065
PP033894 5.6 44.7 7.98214 0 AT1G03600.1 PHOTOSYSTEM II FAMILY
PROTEIN
2e-051
PP014928 10.7 84 7.85047 0 AT1G30380.1 PSAK (PHOTOSYSTEM I
SUBUNIT K)
5e-057
PP017397 10.6 76.7 7.23585 0 AT2G06520.1 PSBX (PHOTOSYSTEM II
SUBUNIT X)
2e-018
PP060944 0 7.1 7.1 0 AT1G52230.1 PSAH2 (PHOTOSYSTEM I
SUBUNIT H2)
4e-016
PP017005 0 6.6 6.6 0 AT1G79040.1 PSBR (PHOTOSYSTEM II
SUBUNIT R)
2e-034
PP021626 0 6.5 6.5 0 AT1G52230.1 PSAH2 (PHOTOSYSTEM I
SUBUNIT H2)
1e-035
PP000042 7.8 48.3 6.19231 0 AT1G52230.1 PSAH2 (PHOTOSYSTEM I
SUBUNIT H2)
2e-056
PP022192 25.2 130.2 5.16667 0 AT3G50820.1 PSBO2 (PHOTOSYSTEM II
SUBUNIT O-2)
4e-176
PP032949 6.7 33.7 5.02985 0 AT1G79040.1 PSBR (PHOTOSYSTEM II
SUBUNIT R)
2e-060
23
PP032493 5.2 25.1 4.82692 0 AT1G52230.1 PSAH2 (PHOTOSYSTEM I
SUBUNIT H2)
2e-056
PP033323 21.5 100.9 4.69302 0 AT1G79040.1 PSBR (PHOTOSYSTEM II
SUBUNIT R)
4e-061
PP033241 6 27.1 4.51667 0 AT4G03280.1 PETC (PHOTOSYNTHETIC
ELECTRON TRANSFER C)
3e-107
PP033302 7.4 32.5 4.39189 0 AT1G79040.1 PSBR (PHOTOSYSTEM II
SUBUNIT R)
3e-064
PP005186 48.6 205.7 4.23251 0 AT1G06680.1 PSBP-1 (PHOTOSYSTEM II
SUBUNIT P-1)
7e-116
PP016053 22.9 96.6 4.21834 0 AT2G30570.1 PSBW (PHOTOSYSTEM II
REACTION CENTER W)
3e-042
PP022547 5.8 23.8 4.10345 0 AT2G06520.1 PSBX (PHOTOSYSTEM II
SUBUNIT X)
3e-018
PP012172 7.3 29.7 4.06849 0 AT1G03600.1 PHOTOSYSTEM II FAMILY
PROTEIN
6e-066
PP000003 17 68.8 4.04706 0 AT1G55670.1 PSAG (PHOTOSYSTEM I
SUBUNIT G)
8e-067
PP033216 12.2 47.9 3.92623 0 AT1G79040.1 PSBR (PHOTOSYSTEM II
SUBUNIT R)
2e-054
PP041363 2 7.7 3.85 0 NP_174418 PSAF (PHOTOSYSTEM I
SUBUNIT F)
4e-009
PP012010 26.9 95.3 3.54275 0 AT4G12800.1 PSAL (PHOTOSYSTEM I
SUBUNIT L)
5e-101
PP033278 11.6 40.2 3.46552 0 AT1G79040.1 PSBR (PHOTOSYSTEM II
SUBUNIT R)
6e-044
PP033227 10.1 33.6 3.32673 0 AT1G52220.1 PSI-P (PHOTOSYSTEM I P
SUBUNIT)
4e-042
PP005055 24 76.9 3.20417 0 AT1G30380.1 PSAK (PHOTOSYSTEM I
SUBUNIT K)
3e-055
PP039593 2.1 6.5 3.09524 0 AT1G31330.1 PSAF (PHOTOSYSTEM I
SUBUNIT F)
9e-036
PP013176 7 21.5 3.07143 0 AT2G46820.1 PSI-P (PHOTOSYSTEM I P
SUBUNIT)
2e-044
*That the top hits of several cauliflower unigenes correspond to one gene in Arabidopsis could
be due to paralogs or alternative splicing of genes in cauliflower.
24
Figure legends:
Figure 1. Phenotype and chlorophyll content of green curd cauliflower mutant. (a) and (b) Field
grown curds from white cauliflower variety (Stovepipe) and green curd line (ACX800),
respectively. (c) and (d) Autoflorescence of chloroplasts in green curds. Scale bar in (c) = 20 µm
and in (d) = 10 µm. (e) Chlorophyll a and b content in young leaves and curds of Stovepipe (WT)
and ACX800 (Green) cauliflower. The numbers above bars show the ratio of chlorophyll a/b.
Error bars represent + SD (n=3).
Figure 2. Functional categories of genes differentially expressed between green and white curds.
Figure 3. Alignment of the associated differentially expressed genes with chlorophyll
biosynthesis and degradation pathways. (a) Simplified chlorophyll a biosynthesis and
degradation pathway. (b) Chlorophyll cycle. The pathway maps were generated using the Plant
MetGenMAP system [17].
Figure 4. Comparison of the numbers of Hy5-mediated genes in Arabidopsis [26] with
differentially expressed genes in green curds of cauliflower and a simplified model of light
signaling pathway for chloroplast development based on [11]. (a) Venn diagram showing the
number of common genes between HY5-targeted genes in Arabidopsis and total differentially
expressed genes in green curds of cauliflower. (b) Venn diagrams showing the numbers of
common genes between HY5-regulated genes in Arabidopsis under light and dark and the up-
and down-expressed genes among the 2616 homologs of HY5-trageted genes in green curds of
cauliflower. (c) Alignment of the associated differentially expressed genes with light signaling
pathway for chloroplast development. Abbreviations are as follows: CIP1, COP1-
INTERACTIVE PROTEIN 1; COP1, CONSTITUTIVE PHOTOMORPHOGENIC 1; COP9,
CONSTITUTIVE PHOTOMORPHOGENIC 9; COP9-sub2, COP9 SIGNALOSOME
COMPLEX SUBUNIT 2; HY5, ELONGATED HYPOCOTYL 5; HYH, HY5-HOMOLOG.