báo cáo khoa học: "Real-time imaging and analysis of differences in cadmium dynamics in rice cultivars (Oryza sativa) using positron-emitting 107Cd tracer" ppsx
Bạn đang xem bản rút gọn của tài liệu. Xem và tải ngay bản đầy đủ của tài liệu tại đây (730.97 KB, 38 trang )
This Provisional PDF corresponds to the article as it appeared upon acceptance. Fully formatted
PDF and full text (HTML) versions will be made available soon.
Real-time imaging and analysis of differences in cadmium dynamics in rice
cultivars (Oryza sativa) using positron-emitting 107Cd tracer
BMC Plant Biology 2011, 11:172 doi:10.1186/1471-2229-11-172
Satoru Ishikawa ()
Nobuo Suzui ()
Sayuri Ito-Tanabata ()
Satomi Ishii ()
Masato Igura ()
Tadashi Abe ()
Masato Kuramata ()
Naoki Kawachi ()
Shu Fujimaki ()
ISSN 1471-2229
Article type Research article
Submission date 19 July 2011
Acceptance date 29 November 2011
Publication date 29 November 2011
Article URL />Like all articles in BMC journals, this peer-reviewed article was published immediately upon
acceptance. It can be downloaded, printed and distributed freely for any purposes (see copyright
notice below).
Articles in BMC journals are listed in PubMed and archived at PubMed Central.
For information about publishing your research in BMC journals or any BioMed Central journal, go to
/>BMC Plant Biology
© 2011 Ishikawa et al. ; licensee BioMed Central Ltd.
This is an open access article distributed under the terms of the Creative Commons Attribution License ( />which permits unrestricted use, distribution, and reproduction in any medium, provided the original work is properly cited.
Real-time imaging and analysis of differences in
cadmium dynamics in rice cultivars (Oryza sativa)
using positron-emitting
107
Cd tracer
Satoru Ishikawa
1
*
§
, Nobuo Suzui
2
*, Sayuri Ito-Tanabata
2,3
, Satomi Ishii
2
,
Masato Igura
1
, Tadashi Abe
1
, Masato Kuramata
1
, Naoki Kawachi
2
, and Shu
Fujimaki
2
1
Soil Environment Division, National Institute for Agro-Environmental Sciences, 3-1-
3 Kannondai, Tsukuba, Ibaraki 305-8604, Japan
2
Radiotracer Imaging Group, Medical and Biotechnological Application Division,
Quantum Beam Science Directorate, Japan Atomic Energy Agency, Watanuki 1233
Takasaki, Gunma 370-1292, Japan
3
Present address: Agricultural Research Institute, Ibaraki Agricultural Center,
Kamikuniicho 3402, Mito, Ibaraki 311-4203, Japan
*These authors contributed equally to this work.
§
Corresponding author
Email addresses:
SI
1
:
NS:
SIT:
SI
2
:
MI:
TA:
MK:
NK:
SF:
Abstract
Background: Rice is a major source of dietary intake of cadmium (Cd) for
populations that consume rice as a staple food. Understanding how Cd is transported
into grains through the whole plant body is necessary for reducing rice Cd
concentrations to the lowest levels possible, to reduce the associated health risks. In
this study, we have visualized and quantitatively analysed the real-time Cd dynamics
from roots to grains in typical rice cultivars that differed in grain Cd concentrations.
We used positron-emitting
107
Cd tracer and an innovative imaging technique, the
positron-emitting tracer imaging system (PETIS). In particular, a new method for
direct and real-time visualization of the Cd uptake by the roots in the culture was first
realized in this work.
Results: Imaging and quantitative analyses
revealed the different patterns in time-
varying curves of Cd amounts in the roots of rice cultivars tested. Three low-Cd
accumulating cultivars (japonica type) showed rapid saturation curves, whereas three
high-Cd accumulating cultivars (indica type) were characterized by curves with a
peak within 30 min after
107
Cd supplementation, and a subsequent steep decrease
resulting in maintenance of lower Cd concentrations in their roots. This difference in
Cd dynamics may be attributable to OsHMA3 transporter protein, which was recently
shown to be involved in Cd storage in root vacuoles and not functional in the high-Cd
accumulating cultivars. Moreover, the PETIS analyses revealed that the high-Cd
accumulating cultivars were characterized by rapid and abundant Cd transfer to the
shoots from the roots, a faster transport velocity of Cd to the panicles, and Cd
accumulation at high levels in their panicles, passing through the nodal portions of
the stems where the highest Cd intensities were observed.
Conclusions: This is the first successful visualization and quantification of the
differences in whole-body Cd transport from the roots to the grains of intact plants
within rice cultivars that differ in grain Cd concentrations, by using PETIS, a real-time
imaging method.
Background
Cadmium (Cd) has an important impact on agriculture, as the excessive consumption
of Cd from contaminated food crops can lead to toxicity in humans. High-dose Cd
exposure is particularly toxic to the kidney and leads to renal proximal tubular
dysfunction [1]. In Japan, itai-itai disease (renal osteomalacia), which is characterized
by complaints of spinal and leg bone pain, was recognized as a type of chronic
toxicity induced by excess Cd contamination of drinking water and cereals (mainly
rice). Since then, the contamination of rice by Cd has been monitored to prevent it
from being distributed to consumers in Japan, in accordance with the Food Sanitation
Act established in 1969 in Japan. Nevertheless, the Cd contamination of rice is still a
serious threat to Japanese people and other populations in the world that consume rice
as a staple food, because rice is a major source of dietary intake of Cd. Understanding
how Cd is taken up by rice roots and subsequently transported to rice grains is
necessary for reducing Cd concentrations in rice as much as possible, thus
diminishing the risk that Cd poses to human health.
Plant roots are the first entry point for Cd uptake from soil solutions, and the transport
processes of Cd into the roots have been well reviewed from the viewpoints of
physiological and genetic studies [2]. A dose-dependent process exhibiting saturable
kinetics has been shown in the roots of several graminaceous crops, including rice [3-
5]. The saturable characteristics of Cd uptake could be controlled by a carrier-
mediated system, and genetic studies in rice have indicated that the iron (Fe)
transporters OsIRT1 and OsIRT2 and the zinc (Zn) transporter OsZIP1 can mediate
Cd uptake by roots [6, 7]. Once Cd enters into the root cells, its movement through
the root symplasm to the xylem can be restricted by its sequestration in the vacuoles
[8]. In tandem, apoplastic movement of Cd to the xylem can also be restricted by
development of the endodermal suberin lamellae in the roots exposed to Cd [2].
Recently, it has been found that among rice cultivars varying in grain Cd
concentrations, the differences in root-to-shoot Cd translocation rates via the xylem
are affected by the P
1B
-ATPase transporter OsHMA3, which is involved in Cd
sequestration in root vacuoles [9, 10]. Xylem loading of Cd has been shown to be
mediated by AtHMA2 and AtHMA4 in Arabidopsis thaliana [11, 12]. In rice,
functional assays by heterologous expression of OsHMA2 in yeast have suggested that
this gene is a good candidate for the control of Cd xylem loading in rice [8]. The
process of Cd unloading from the phloem is also recognized as a key factor for
determining Cd levels in grains, because Cd moves to developing grains via the
phloem [13, 14]. Tanaka et al. [15] estimated that 91–100% of Cd in rice grains was
deposited from the phloem when rice plants were treated with a relatively high Cd
level with 1 µM Cd in hydroponics. Using an insect-laser method,
Kato et al. [16]
collected the phloem sap from the sheaths of the most expanded leaves of three rice
cultivars differing in grain Cd concentrations, and found that the Cd concentrations of
the phloem sap from these cultivars correlated well with their grain Cd
concentrations. As described above, chemical and genetic analyses have provided
many suggestions for every process in Cd transport in plants. Now, comprehensive
information provided by whole-body and real-time observation of Cd movement in
intact plants during vegetative and reproductive stages are needed for understanding
the total plant system that leads to the difference of Cd concentrations between
various cultivars.
In general, radioisotope tracers are useful tools for analysing the spatial distribution or
temporal change in the amount of a substance in the plant body.
109
Cd has been
widely used to visualize Cd distribution within plant tissues [17, 18]. For example,
Chino [17] observed that most Cd accumulated in the roots after isotope Cd (
109
Cd
and
115m
Cd) supplementation at the early ripening stage, and lesser amounts of Cd
were distributed to grains, whereas the lowest levels of Cd were present in the leaves.
However, only the static distribution of Cd at a given moment can be obtained by
autoradiography. In recent years, the positron-emitting tracer imaging system (PETIS)
has been employed to study various physiological functions in intact, living plants
[19, 20]. This system enables not only monitoring of the real-time movement of the
tracer in living plants as a video camera might, but also quantitative analyses of the
movement of the substance of interest by freely selecting a region of interest (ROI) on
the image data obtained. By applying this system to several graminaceous crops, the
uptake and translocation of metals was investigated using positron-emitting tracers
52
Fe [21],
52
Mn [22], and
62
Zn [23]. Recently, Fujimaki et al. [24] established a real-
time imaging system for Cd using positron-emitting
107
Cd tracer and PETIS. The
movement of Cd in the aerial part of rice (cultivar Nipponbare) in the vegetative and
reproductive stages was captured as serial images, and various parameters (e.g.
transport velocity in the shoot) were analysed quantitatively. However, a method for
direct imaging of the underground parts, which should provide valuable information
about the root uptake, remained to be developed because of interference by the highly
radioactive culture solution.
In this study, we employed PETIS in our two objectives: to realize direct observation
of Cd uptake by the roots in the culture solution, and to characterize clearly the
differences in Cd dynamics from the culture to the grains between the high- and low-
Cd accumulating cultivars.
Results
Root
107
Cd uptake in different rice cultivars
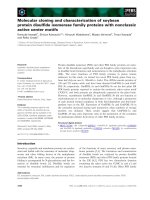
Figure 1 shows the imaging and analysis of Cd uptake by the roots among rice
cultivars at the vegetative stage. The PETIS detectors were focused on the roots to
monitor their
107
Cd dynamics (Figure 1a); data from the ROI of the roots were
extracted for the quantitative analyses; and a time-course curve of Cd accumulation
within the ROI was shown as the amounts of total Cd (pmol), consisting of the sums
of radioactive and nonradioactive Cd (Figure 1c). An animation film of real-time Cd
dynamics in the roots is available (Additional file 1). Serial images of root Cd
distributions were obtained for 36 h (Figure 1b). Radical Cd uptake by roots was
observed just after the
107
Cd was supplied (Figure 1b and c), irrespective of the
cultivar types. This kinetics may reflect the binding of Cd within the apoplastic spaces
of the root cell wall and the subsequent absorption via the plasma membrane into the
cytoplasm, as seen in the root uptake patterns of divalent and trivalent cations [25]. In
the three indica rice cultivars (Choko-koku, Jarjan, Anjana Dhan), which were
classified as having markedly high Cd concentrations in their grains and shoots
(herein collectively referred to as “high-Cd indica cultivars”), the amounts of Cd in
the roots peaked within 30 min of exposure to
107
Cd, and the subsequent decreases in
Cd were monitored until the 5 h point (Figure 1c). For the japonica rice cultivars
(Nipponbare, Koshihikari, Sasanishiki) with lower Cd concentrations in their grains
and shoots (herein collectively referred to as “low-Cd japonica cultivars”), the
amounts of Cd in the Nipponbare and Sasanishiki roots plateaued or increased slightly
after peaking at approximately 1 h. A delayed Cd peak was observed in the
Koshihikari roots. In this study,
107
Cd was supplied only at the beginning of the
imaging, and almost all of the
107
Cd in the culture solution was absorbed by the roots
within approximately 5 h in all cultivars (Figure 1d). Therefore, the plateau observed
in Figure 1c shows immobilization of Cd in the roots but not constant flow of Cd from
the culture solution, and thus this
shows that the low-Cd japonica cultivars have a
greater ability to retain Cd in the root tissue compared with the high-Cd indica
cultivars.
Imaging of
107
Cd transfer to shoots in different rice cultivars
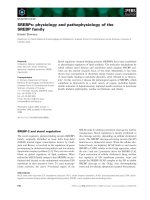
Figure 2 shows the imaging and analysis of Cd transport into the shoots of the six rice
cultivars in the vegetative stage. The field of view (FOV) was focused on the shoots
(Figure 2a), and serial images of Cd movement in each cultivar were monitored for 36
h (Figure 2b). An animation of Cd dynamics is displayed in Additional file 2. Cd first
appeared and started to accumulate in the lower parts of the stems (shoot bases), or
non-elongated stem part [26], showing intensive
107
Cd signals for all cultivars. The
time-course curves of Cd amounts in ROI-1 (shoot base) and ROI-2 (leaf sheaths and
leaf blades) are shown in Figure 2c and d, respectively. The Cd in ROI-1 began to
accumulate within 1 h of
107
Cd supplementation and increased dramatically up to 10
h, particularly for the high-Cd indica cultivars. The amounts of Cd in ROI-1 were
significantly higher in the high-Cd indica cultivars than in the low-Cd japonica
cultivars up to 36 h. After 10 h, the amounts of Cd reached plateaus for all cultivars,
but slight decreases were found in the high-Cd indica cultivars. Unlike the
accumulation patterns of Cd in ROI-1, the amounts of Cd in ROI-2 (leaf sheaths and
leaf blades) continued to increase linearly until the end of the experiment. There was
an approximately 3-fold difference in the amount of Cd between the high-Cd indica
cultivars and the low-Cd japonica cultivars.
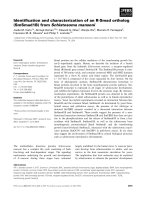
After the PETIS experiment, autoradiography was performed to obtain static
distributions of Cd for each plant part at the vegetative stage (Additional file 3), and
the distribution ratios of total Cd in their parts were calculated (Figure 3).
Approximately 90% of the Cd absorbed by the japonica rice cultivars accumulated in
their roots, whereas only 60–70% of the Cd in the indica rice cultivars was distributed
in their roots. In the shoot parts, Cd accumulated at the shoot base in the highest
proportions; this accounted for approximately 15–20 % of the total Cd in the plant
body for the high-Cd indica cultivars, whereas it was less than 10% for the low-Cd
japonica cultivars. On the other hand, the proportions of Cd in the shoot base were
approximately 50% of those in the total shoot and did not differ greatly between
cultivars. In the leaves (leaf sheaths and leaf blades), Cd was mostly distributed in the
younger leaves, that is, the 4th and 5th leaves, suggesting that Cd moves preferentially
to new leaves after moving from the roots to the shoot bases.
Imaging of
107
Cd transfer to panicle in different rice cultivars
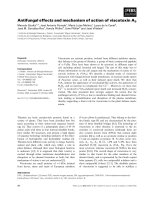
Figure 4 shows the imaging and quantitative analyses of Cd transport into the panicles
of Koshihikari and backcross inbred line 48 (BIL48). BIL48 was used as a high-Cd
accumulator, because it possesses a major quantitative trait locus (QTL) responsible
for high Cd accumulation derived from Jarjan with the Koshihikari genetic
background [27], and it shows synchronous panicle headings with Koshihikari by the
short-day treatment. The FOV focused on the panicle (Figure 4a), and serial images of
Cd movement into the panicle were monitored for 36 h (Figure 4b). The highest
intensities of Cd, especially for BIL48, appeared in the culm, rachis, and neck node of
the panicle within 12 h of
107
Cd supplementation. Cd showed a strong presence in the
spikelets of BIL48 after 18 h, increasing steadily up to 36 h. In contrast,
107
Cd
intensity in Koshihikari was lower throughout the experiment. Cd accumulation was
not found in the flag leaf blade of either plant. Animation films of these images are
also available (Additional file 4). The time course of Cd accumulation in ROI-3 (neck
node of the panicle) and ROI-4 (panicle) are quantitatively analysed as shown in
Figure 4c and d, respectively. The Cd accumulation in ROI-4 (Figure 4d) was
calculated as the amount of Cd per one glume because the total numbers of glumes
differ between Koshihikari and BIL48 (see Figure 4a). The initial increasing slopes
(Figure 4c and d, circled plots) were fitted with lines depicting the kinetics of initial
arrival of Cd in the respective ROI. The X-intercepts of the fitting lines were adopted
as the arrival times of the theoretical “leading edge” of the Cd pulse, which are
independent from the detection limit. Cd arrived in ROI-3 (Figure 4c) at 10.3 h and
then accumulated at a gentle, linear slope up to 36 h in Koshihikari. In the Cd-
accumulator BIL48, Cd arrived in ROI-3 8.4 h after supplementation and then
increased at a steep, linear slope up to 18 h, finally reaching a plateau at
approximately 7–8 pmol. In ROI-4 (Figure 4d), Cd arrived in Koshihikari at 11.4 h
and then increased in concentration linearly at a gentle slope. For BIL48, Cd in ROI-4
arrived at 10.2 h and increased continuously at a steep slope up to 36 h. On the basis
of the culm lengths (68.1 cm for Koshihikari and 67.4 cm for BIL48) and the
estimated arrival times to the panicles (11.4 h for Koshihikari and 10.2 h for BIL48),
the Cd transport velocities were calculated to be 6.0 cm h
-1
for Koshihikari and 6.6 cm
h
-1
for BIL48. At the end of the PETIS experiment, the amount of Cd accumulated in
ROI-4 was approximately 5-fold higher in BIL 48 than in Koshihikari.
Both plants were subjected to autoradiography after the PETIS experiment (Figure 5a
and b). A strong accumulation of Cd was observed in each node from the base to the
top in both plants. In addition, Cd was present in the culms, rachises, and panicles in
both plants. The Cd signals in these plant parts were remarkably stronger in BIL48
than in Koshihikari. The middle part of each glume in BIL48, where the ovary should
be developing, showed a significantly strong Cd signal. In contrast, either no signal or
a weak signal of Cd was detected in the leaf blades, even in the high-Cd accumulator
BIL48.
Discussion
Improvement of the PETIS applicable to direct imaging of roots
It has long been considered technically impossible to observe the radiotracer-treated
culture and the roots directly and simultaneously, because traditional imaging
methods do not have a sufficiently broad range of detection that can accept such
contrast. In this study, we principally improved three areas: 1) use of a root box with
flat, shallow compartments, allowing detectors to focus on the roots; 2) use of a
simple nutrient solution to avoid competition between Cd and other minerals at
adsorptive sites in roots; and 3) ensuring application of adequate radioisotope activity
for the quantitative measurements by taking into consideration the dynamic range of
the PETIS. These technical improvements first enabled direct visualization of real-
time Cd dynamics in the whole plant body, that is, from roots to grains.
We applied the improved system to analyse the time-varying distribution of Cd to
characterize the differences in Cd dynamics in rice cultivars varying in grain Cd
concentrations.
Dynamic characterization of root Cd uptake and root-to-shoot translocation in
rice cultivars differing in grain Cd concentration
The time courses of Cd amount in the root regions (Figure 1c) showed similar curves
at the first 30 min as a rapid increase in all the cultivars tested, but were then followed
by very different patterns between the cultivars. Three low-Cd japonica cultivars
showed gentle saturation curves, whereas three high-Cd indica cultivars showed a
drastic drop (Figure 1c). We consider that the curves in Figure 1c reflect the
combination of the four successive functions of the root: adsorption to the outer root
apoplast, absorption into the root symplast, retention within the cytoplasm or vacuole,
and xylem loading. The very rapid increase at the first 30 min may reflect adsorption
to the outer root apoplast, suggesting that this process was similar in all six cultivars.
The subsequent drastic drop after 30 min in the high-Cd indica cultivars should be
attributed to the simultaneous occurrence of two phenomena. One is depletion of Cd
supply from the culture into the root as shown in Figure 1d, and the other is vigorous
transfer of Cd from the root to the xylem. In contrast, the gentle saturation curves in
the low-Cd japonica cultivars should indicate very low transfer from the root, because
depletion of Cd supply from the culture was also the case in these cultivars (Figure
1d). Therefore, the different abilities between the low-Cd japonica cultivars and the
high-Cd indica cultivars to transfer Cd from the root tissue into the xylem may have
caused the most significant feature of Cd dynamics observed in the underground part.
This difference most probably depends on whether the rice plant inherently conserves
the functional OsHMA3, which is a membrane transporter protein involved in Cd
storage in root vacuoles. All high-Cd indica cultivars used in this study showed a loss
of function of OsHMA3, resulting in failure to sequester Cd in their root vacuoles [9,
10, 28]. Our results indicate that loss of the sequestrating function of OsHMA3 into
root vacuoles triggered transfer of Cd from the root tissue into the xylem within 30
min of contact between the root and Cd (Figure 1c). This result accords with a
previous study that the radial transport of Cd in rice root from the culture to the xylem
requires less than 10 min [2
4]. This transfer process was completed within 5 h (Figure
1c), which suggests that a concerted transport by absorption from the outer root
apoplast into the symplast, and xylem loading from the symplast, takes place after
very fast adsorption to the outer root apoplast. Moreover, the lack of drop after 30 min
in the low-Cd japonica cultivars (Figure 1c) suggests that the sequestration function
into root vacuoles is much more efficient than the xylem loading. These rapid
dynamics seem to be specific to rice, because a previous study [29] showed that
differences in root Cd concentrations between near-isogenic lines of durum wheat that
differ in grain Cd concentrations were not observed until at least 4 days after Cd
exposure. It should be noted that the kinetic curves in root Cd uptake were obtained
with limited Cd (including
107
Cd) supply in this study, and this could be considered as
a kind of pulse feed experiment. The curves obtained would naturally be different
from those of roots with continuous Cd supply. The point is that the pulse feed
experiments provide snapshots (temporal differentiation) of dynamics and the result
with continuous feed could be described as their integration. In fact, the results from
this study agreed well with our previous results obtained from the rice genotypes
grown continuously in the Cd-polluted soil [5]; root Cd concentrations were higher in
the low-Cd japonica cultivars than in the high-Cd indica cultivars.
In aerial parts,
107
Cd had a strong presence in the non-elongated stems at the shoot
bases (Figure 2b) that contained densely packed nodes with complicated vascular
bundle structures [30]. Other metals, such as Fe, Mn, and Zn, have also been shown to
accumulate preferentially in this region in graminaceous crops [21-23], designated as
the “traffic control centre” [31] or “discrimination centre” [32], and which plays
important roles in distributing solutes taken up by the roots to each aerial tissue. The
quantitative differences in Cd amounts in the shoot bases between low-Cd and high-
Cd rice cultivars were apparent in the time course data (Figure 2c), and these were
clearly in accord with the differing abilities of the cultivars to transfer Cd into the
xylem. In addition, the slight decrease after the peak (at approximately 15 h) in the
high-Cd cultivars (Figure 2c) indicates the relatively higher mobility of Cd from the
shoot base (ROI-1) to the upper shoot parts (ROI-2). This tendency also seemed to be
influenced by OsHMA3 gene expression in the shoot base, although the expression
levels in the shoots are reported to be considerably lower than those in the roots [10].
The xylem parenchyma cells, having large vacuoles, are located in the centre of the
enlarged xylem in the enlarged elliptical bundle of the node [26]. Xylem parenchyma
and transfer cells play important roles in the selective absorption of solutes from the
transpiration stream and their transport to the shoot apex [30, 33]. If OsHMA3
function is defective in the xylem parenchyma cells in the high-Cd indica cultivars,
Cd might move up to the upper leaf sheaths and leaf blades more easily through the
transpiration stream, with reduced interception by the xylem parenchyma cells.
However, in general, the proportions of Cd that finally accumulated in the shoot base
after 36 h were approximately 50% of those in the total shoot, and did not differ
greatly between the cultivars (Figure 3). This might suggest that the xylem unloading
function was barely influenced by the genetic difference between the cultivars tested
even though the Cd amounts loaded into the xylem were largely varied. Cd deposited
temporarily in the shoot base seems to be translocated preferentially into the youngest
developing leaves (Figure 3). The preferential translocation of Zn [34] and Fe [21]
into the youngest leaves in graminaceous crops has also been reported. In a previous
study, it was found that
52
Fe translocation to the youngest leaves of barley seedlings
can be severely suppressed by a steam-girding treatment of the leaves, which
inactivates phloem but not xylem transport, suggesting that Fe is mainly translocated
to the youngest leaves via the phloem [21]. Fujimaki et al. [24] showed that Cd
moved from the shoot base into the crown roots, which were split and kept away from
direct contact with the Cd solution, suggesting that Cd was transferred from the xylem
to the phloem at the nodes in the shoot base. These findings suggest that preferential
and high Cd accumulation in the youngest leaves, especially for the high-Cd cultivars,
could be partially explained by high levels of Cd in the phloem after the xylem-to-
phloem transfer of Cd at the shoot base, where the high Cd signals were observed for
the high-Cd cultivars.
Dynamic characterization of Cd accumulation in panicles of rice cultivars that
differ in grain Cd concentration
The Cd accumulation pattern of the neck node for the high-Cd accumulator BIL48
plants corresponded well to that of the node at the shoot base, showing the
characteristic steep and linear increase, and subsequent plateau pattern of Cd
accumulation (Figures 2c and 4c). Therefore, the neck node of the panicle may
participate in the traffic control centre that distributes Cd to each spikelet. The linear
accumulation pattern of Cd in the panicle was observed in both rice plants after
107
Cd
reached the respective panicle, although the accumulated levels differed substantially
between plants (Figure 4d). Fujimaki et al. [24] quantified the velocity of the long-
distance transport of Cd through the shoot at the grain-filling stage to be 5.4 ± 0.4 cm
h
-1
in the low-Cd cultivar Nipponbare. In this study, it was estimated to be 6.0 cm h
-1
for the low-Cd cultivar Koshihikari, and the value seemed to be similar. The transport
velocity of Cd for the Cd accumulator BIL48 (6.6 cm h
-1
) was found to be slightly
faster than that for Koshihikari. However, the differences in the Cd transport velocity
between genotypes were likely to be small. Instead, a remarkable difference
(approximately 5-fold) was observed in the slopes of Cd accumulation to panicles.
Therefore, this result indicates that the differences in root Cd dynamics also influence
the Cd concentration of the long-distance Cd transport to panicles in rice cultivars.
Interestingly, at 36 h no Cd was found to be distributed in the flag leaves of either
plant in the PETIS experiment, in which
107
Cd was supplied to the genotypes with
emerged ears (Figures 4b and 5). In contrast, significant Cd accumulation was seen in
all nodes of the elongated stems of both plants, especially at the uppermost node
I,
which is connected to the flag leaf and panicle. Node I functions in the distribution of
solutes from the roots to the flag leaf or panicle [26, 33]. The autoradiography results
suggest that the Cd at node I translocated preferentially to the developing panicle and
not to the developed flag leaf, but the method by which node I determines the
destination of Cd is unknown. Silicon transport to rice grains has been proposed to be
involved in the inter-vascular transfer from the enlarged vascular bundles to the
diffuse vascular bundles, passing through the xylem transfer cells present in the
parenchyma cell bridge at node I, and a transporter related to inter-vascular transfer
has been identified [35]. The diffuse vascular bundles of node I are assembled in
internode I to form large vascular bundles that connect toward the panicle tissues [26,
35]. Using a synchrotron micro X-ray fluorescence spectrometer and electron probe
micro analyser, Cd was detected in the phloem of large vascular bundles at node I
(Yamaguchi et al. 2011, submitted). In addition, it has been reported that the xylem-
to-phloem transfer of Cd takes place in the nodes of rice [24], and the dominant route
of Cd transport in brown rice is the phloem [15, 16]. Our findings and these reports
largely indicate that Cd passes through the phloem of the large vascular bundles in
internode I after the xylem-to-phloem transfer at node I, and the Cd concentrations in
the phloem may affect the genotypic differences in Cd accumulation in rice grains.
In paddy fields, rice is mostly grown under submerged conditions in which
bioavailable Cd is limited because of the rise in soil pH and decrease in the redox
potential. Midseason drainage in Japanese paddy fields is widely recommended at the
vegetative stage to avoid the root rot induced by continuous soil reduction. In addition,
early drainage after panicle emergence is often practised in paddy fields to facilitate
machine harvesting. Thus, rice is not continuously exposed to high bioavailable Cd in
the soil, and the PETIS data obtained by a limited Cd (including
107
Cd) supply might
be a description of the Cd dynamics in rice at the vegetative and heading stages after
water drainage in the paddy fields.
Thus, the PETIS is a very effective tool for comprehensively evaluating Cd dynamics
from roots to grains, and for predicting the physiological processes of Cd transport in
intact plants. The imaging and kinetics data have clearly demonstrated the differential
Cd dynamics in the living plants of rice cultivars. The dynamics could be influenced
by many physiological and biochemical steps, in which multiple genes controlling Cd
dynamics are involved. For instance, using the various mapping populations, the
major QTLs responsible for Cd accumulation in rice were detected on chromosomes 3,
4, 6, 7, 8, and 11[36-38], suggesting that the genotypic variation in Cd transport in
rice is controlled by multiple genes. In this study, we happened to select three high-Cd
indica cultivars that carry the non-functional alleles of OsHMA3, based on previously
screened data relating to Cd accumulation in many rice cultivars[5]. In the near future,
we intend to analyse the Cd dynamics in high-Cd cultivars carrying alterations in
responsible genes other than OsHMA3. This experimental system would be
appropriate for detailed functional analyses of the various genes responsible for Cd
transport.
Conclusions
Using the PETIS, we made the first direct observation of Cd uptake by the roots in the
culture solution, characterized the successive transport processes in the root tissues,
and described the differences in real-time Cd dynamics from the roots to the grains
between the high- and low-Cd accumulating rice cultivars. The apparent differences
were clearly shown as Cd retention in the roots, the rates of Cd translocation from the
roots to the shoots, and the long-distance Cd transport to the panicles. Our studies
have clearly connected the difference in gene function in the rice cultivars with in vivo
movement of Cd from the culture through the root to the shoot in rice plants.
Methods
Plant materials
For the experiments conducted at the vegetative seedling stage, we used six rice
cultivars (Oryza sativa L.) consisting of three indica rice cultivars (Choko-koku,
Jarjan, Anjana Dhan) with markedly high Cd concentrations in their grains and
shoots, and another three major japonica cultivars from Japan (Nipponbare,
Koshihikari, Sasanishiki) with lower Cd concentrations in their grains and shoots [5].
Koshihikari and a BIL derived from Koshihikari and Jarjan (BIL48) were used for the
experiments conducted at the grain-filling stage. BIL48 possesses a major QTL
responsible for high Cd accumulation in shoots [27]. The seeds were soaked in
deionized water for 2 days at 32°C and transferred to a nylon mesh floating on 20 L of
a 1/2 strength Kimura B solution. The complete nutrition solution consisted of 0.36
mM (NH
4
)
2
SO
4
, 0.36 mM Ca (NO
3
)
2
·4H
2
O, 0.54 mM MgSO
4
·7H
2
O, 0.18 mM KNO
3
,
0.18 mM KH
2
PO
4
, 40 µM Fe(III)-EDTA, 18.8 µM H
3
BO
3
, 13.4 µM MnCl
2
·4H
2
O,
0.32 µM CuSO
4
·5H
2
O, 0.3 µM ZnSO
4
·4H
2
O, and 0.03 µM (NH
4
)
6
Mo
7
O
24
·4H
2
O.
Kimura B solution has been widely used for growing rice plants [5]. The solution was
replaced once a week, and the pH was adjusted to 5.2 every day. The seedlings of six
cultivars were grown for 2–3 weeks in a greenhouse under natural sunlight and used
for the vegetative stage experiments.
Three weeks after sowing, the seedlings of Koshihikari and BIL48 were transplanted
to the full-strength Kimura B solution and grown to the heading stage in a growth
chamber. The plants were exposed to a short-day treatment with an 8-hour
photoperiod, day/night temperatures of 30°C/25°C, relative humidity of 70%, and
light intensity of 400 µmol m
-2
s
-1
in order to synchronize the first-ear emergences of
Koshihikari and BIL48. Koshihikari was examined at 9 days, and BIL48 at 5 days,
after the first ear emergence for the grain-filling stage experiments.
107
Cd tracer and PETIS imaging
The
107
Cd isotope was produced following the method of Fujimaki et al.[24]. Briefly,
a silver foil was bombarded with a 17 MeV energetic proton beam at a current of 2
µA from a cyclotron at Takasaki Ion Accelerators for Advanced Radiation
Application (Japan Atomic Energy Agency). The
107
Cd in the irradiated target was
purified by an AgCl
2
precipitation reaction after the addition of 2 M HCl. Finally,
7.6–60.2 MBq of
107
Cd was fed to each test plant depending on the experiments
described below.
The PETIS imaging experiments were conducted following the method of Fujimaki et
al. [24] with modifications to visualize the dynamics of Cd uptake by the root. First,
an acrylic root box 187 mm (height) × 120 mm (width) × 10 mm (depth) was
partitioned into six cells, each cell being 187 mm (height) × 17.5 mm (width) × 10
mm (depth). This box was devised to focus the detectors on the root surfaces in the
radiotracer-treated culture solution, enabling observation of the multiple roots
simultaneously. The root box consisted of two parts: an acrylic board with partitioned
cells, and a flat acrylic plate for covering (Figure 1a). The lower leaf sheaths of the
test plants were held with surgical tapes onto the board and the roots were placed in
each cell compartment, supported by plastic sheets with small holes, and covered by
the flat plate. The board and plate were completely sealed with screws and the culture
solution was poured into each cell compartment. Second, to avoid competition
between Cd and other minerals (e.g. Zn, Fe, and Mn) at adsorptive sites in the roots
and so prevent a consequently low spatial resolution of Cd dynamics, the culture used
for imaging was altered to a 0.5 mM CaCl
2
solution instead of the full-strength
nutrient solution used by Fujimaki et al. [24]. Finally, taking into consideration the
wide dynamic range of the PETIS, we determined the amounts of radioisotope
adequate for root imaging using the simple solution in the root box. These
improvements enabled direct and simultaneous observation of the radiotracer-treated
culture and the roots. The plants were acclimatized in a 0.5 mM CaCl
2
solution (pH
5.2) for 24 h before the start of the
107
Cd supplementation experiment. The solution
was continuously aerated, and the surface levels were set a few centimetres below the
boundaries between the shoot bases and roots by automatically supplying fresh
solution from the reservoir tank as the plants took up the water. Purified
107
Cd and
nonradioactive Cd at concentrations of 0.1 µM were simultaneously supplied as
carriers to the 0.5 mM CaCl
2
solution in which the plants were grown. Plants were
placed in the mid-plane between the two opposing detector pairs of the PETIS
apparatus (a modified PPIS-4800; Hamamatsu Photonics, Hamamatsu, Japan). A pair
of annihilation γ-rays emitted from the decaying positrons was detected
simultaneously, and the emission point was then determined as the middle point of the
two incident points. Repeated determinations of the emission points reconstructed a
static image of the tracer distribution. One frame, which is the unit of time required to
obtain one static image with sufficient quality, was set to 4 min, and 540 (36 h)
frames were collected to yield serial time-course imaging. The detectors were set at
the roots, non-elongated stem bases (shoot bases), and panicles to monitor the
dynamics of Cd in each part. The typical size of the FOV in the detector head was 12
cm in width and 19 cm in height, and the spatial resolution was approximately 2 mm.
All PETIS experiments were conducted in a growth chamber at 30°C and 70%
humidity, with continuous light at a density of 400 µmol m
-2
s
-1
.
Qualitative and quantitative analyses of PETIS data
To determine Cd dynamics in the plant body qualitatively and quantitatively, the
dataset obtained from the PETIS apparatus was reconstructed using the NIH Image J
1.42 software (
Because the ROI can be selected freely from
the image data using this software, the radioactivity of
107
Cd over time within each
ROI was extracted from the data. A time-course curve of Cd accumulation within the
ROI indicated the amounts of total Cd, consisting of the sums of radioactive and
nonradioactive Cd. All PETIS experiments were conducted two or three times, and
the representative data are shown in this paper.
Autoradiography
In the production process of
107
Cd, gamma-ray-emitting
109
Cd was also produced at a
minor ratio (approximately 1/3000). This isotope has a longer half-life (461 days)
than
107
Cd (6.5 h), and it was absorbed by the plants during the PETIS experiments
but not detected by the PETIS apparatus because it is not a positron emitter. After
sufficient decay of
107
Cd within the test plants, they were separated into several parts
and set on imaging plates (Fujifilm, Tokyo, Japan) in cassettes. After a few days of
exposure, the imaging plates were scanned using a bio-imaging analyser (BAS-1500,
Fujifilm, Tokyo, Japan) to obtain the autoradiographic images for examining
109
Cd
distribution in the plant bodies. The Cd concentrations in each plant part were
determined with a well-type gamma counter (ARC-7001; Aloka Co., Ltd., Tokyo,
Japan).
Authors’ contributions
SI
1
, NS, and SF initiated and coordinated the study. SI
1
, MI, TA, and MK prepared
the experimental plants and participated in the PETIS imaging. NS, SIT, SI
2
, NK, and
SF produced the
107
Cd tracers and carried out the PETIS imaging. NS and SIT
processed the imaging dataset obtained by the PETIS. SI
1
drafted the manuscript with
the assistance of NS and SF. All authors discussed the results and commented on the
draft manuscript, and read and approved the final manuscript.
Acknowledgements
This work was supported in part by the Program for the Promotion of Basic Research
Activities for Innovative Biosciences (PROBRAIN to SI
1
). We are grateful to Mr H.
Suto (Tokyo Nuclear Services Co., Ltd., Japan) for his technical assistance with the
irradiation for the
107
Cd production; Mr Masashi Itoh (Akita Prefectural Agriculture,
Forestry, and Fisheries Research Centre, Japan) for supplying the Choko-koku seeds;
and Drs Masahiro Yano and Fumio Taguchi-Shiobara (National Institute of Agro-
biological Sciences (NIAS)) for supplying the BIL48 seeds. The seeds of the rice
cultivars Jarjan and Anjana Dhan were kindly supplied by Gene-bank at the NIAS in
Japan.
References
1. Kawada T, Suzuki S: A review on the cadmium content of rice, daily
cadmium intake, and accumulation in the kidneys. J Occup Health 1998,
40:264-269.
2. Lux A, Martinka M, Vaculik M, White PJ: Root responses to cadmium in
the rhizosphere: a review. J Exp Bot 2011, 62:21-37.
3. Harris NS, Taylor GJ: Cadmium uptake and translocation in seedlings of
near isogenic lines of durum wheat that differ in grain cadmium
accumulation. BMC Plant Biol 2004, 4:4.
4. Hart JJ, Welch RM, Norvell WA, Sullivan LA, Kochian LV:
Characterization of cadmium binding, uptake, and translocation in intact
seedlings of bread and durum wheat cultivars. Plant Physiol 1998,
116:1413-1420.
5. Uraguchi S, Mori S, Kuramata M, Kawasaki A, Arao T, Ishikawa S: Root-to-
shoot Cd translocation via the xylem is the major process determining
shoot and grain cadmium accumulation in rice. J Exp Bot 2009, 60:2677-
2688.
6. Nakanishi H, Ogawa I, Ishimaru Y, Mori S, Nishizawa NK: Iron deficiency
enhances cadmium uptake and translocation mediated by the Fe
2+
transporters OsIRT1 and OsIRT2 in rice. Soil Sci Plant Nutr 2006, 52:464-
469.
7. Ramesh SA, Shin R, Eide DJ, Schachtman DP: Differential metal selectivity
and gene expression of two zinc transporters from rice. Plant Physiol
2003, 133:126-134.
8. Nocito FF, Lancilli C, Dendena B, Lucchini G, Sacchi GA: Cadmium
retention in rice roots is influenced by cadmium availability, chelation
and translocation. Plant Cell Environ 2011, 34:994-1008.
9. Miyadate H, Adachi S, Hiraizumi A, Tezuka K, Nakazawa N, Kawamoto T,
Katou K, Kodama I, Sakurai K, Takahashi H et al: OsHMA3, a P
1B
-type of
ATPase affects root-to-shoot cadmium translocation in rice by mediating
efflux into vacuoles. New Phytol 2011, 189:190-199.
10. Ueno D, Yamaji N, Kono I, Huang CF, Ando T, Yano M, Ma JF: Gene
limiting cadmium accumulation in rice. Proc Natl Acad Sci U S A 2010,
107:16500-16505.
11. Hussain D, Haydon MJ, Wang Y, Wong E, Sherson SM, Young J, Camakaris
J, Harper JF, Cobbett CS: P-type ATPase heavy metal transporters with
roles in essential zinc homeostasis in Arabidopsis. Plant Cell 2004,
16:1327-1339.
12. Williams LE, Mills RF: P
1B
-ATPases - an ancient family of transition metal
pumps with diverse functions in plants. Trends Plant Sci 2005, 10:491-502.
13. Chen F, Wu F, Dong J, Vincze E, Zhang G, Wang F, Huang Y, Wei K:
Cadmium translocation and accumulation in developing barley grains.
Planta 2007, 227:223-232.