báo cáo khoa học: " Exploiting EST databases for the development and characterization of EST-SSR markers in castor bean (Ricinus communis L.)" pptx
Bạn đang xem bản rút gọn của tài liệu. Xem và tải ngay bản đầy đủ của tài liệu tại đây (518.93 KB, 10 trang )
RESEARC H ARTIC LE Open Access
Exploiting EST databases for the development
and characterization of EST-SSR markers in
castor bean (Ricinus communis L.)
Lijun Qiu
1,3
, Chun Yang
1
, Bo Tian
1
, Jun-Bo Yang
2
, Aizhong Liu
1*
Abstract
Background: The castor bean (Ricinus communis L.), a monotypic species in the spurge family (Euphorbiaceae,
2n = 20), is an important non-edible oilseed crop widely cultivated in tropical, sub-tropical and temperate
countries for its high economic value. Because of the high level of ricinoleic acid (over 85%) in its seed oil, the
castor bean seed derivatives are often used in aviation oil, lubricants, nylon, dyes, inks, soaps, adhesive and
biodiesel. Due to lack of efficient molecular markers, little is known about the population genetic diversity and the
genetic relationships among castor bean germplasm. Efficient and robust molecular markers are increasingly
needed for breeding and improving varieties in castor bean. The advent of modern genomics has produced large
amounts of publicly available DNA sequence data. In particular, expressed sequence tags (ESTs) provide valuable
resources to develop gene-associated SSR markers.
Results: In total, 18,928 publicly available non-redundant castor bean EST sequences, representing approximately
17.03 Mb, were evaluated and 7732 SSR sites in 5,122 ESTs wer e identified by data mining. Castor bean exhibited
considerably high frequency of EST-SSRs. We developed and characterized 118 polymorphic EST-SSR markers from
379 primer pairs flanking repeats by screening 24 castor bean samples collected from different countries. A total of
350 alleles were identified from 118 polymorphic SSR loci, ranging from 2-6 per locus (A) with an average of 2.97.
The EST-SSR markers developed displayed moderate gene diversity (H
e
) with an average of 0.41. Genetic
relationships among 24 germplasms were investigated using the genotypes of 350 alleles, showing geographic
pattern of genotypes across genetic diversity centers of castor bean.
Conclusion: Castor bean EST sequences exhibited considerably high frequency of SSR sites, and were rich
resources for developing EST-SSR markers. These EST-SSR markers would be particularly useful for both genetic
mapping and population structure analysis, facilitating breeding and crop improvement of castor bean.
Background
Castor bea n (Ricinus communis L., Euphorbiaceae, 2n =
20) is an important non-edible oilseed crop and its seed
derivatives are often used in aviation oil, lubricants,
nylon, dyes, inks, soaps, adhesive and biodiesel. Among
all the vegetable oils, castor bean oil is distinctive due to
its high level of ricinoleic acid (over 85%), a fatty acid
consisting of 18 carbons, a double bond between C9
and C10, and a hydroxyl group attached to C12.
Ricinoleic acid is responsible for castor bean oil interest,
with the high est and most stable viscosity index among
all the vegetable oils combined with high lubricity, espe-
cially under low-temperature conditions. Although it
was found that castor bean seeds had been used by peo-
ple dating from about 4000 BC [1], it is still an unan-
swered question about the origin of castor bean
cultivation. Castor bean’s contemporary distribution in
the warmer regions is wo rldwide, although its origin is
obscured by wide dissemination in ancient times and
the ease and rapidity with which it becomes established.
Castor bean is indigenous to southeastern Mediterra-
nean Basin, Eastern Africa, and India, and most prob-
ably originated in tropical Africa [2,3]. Because of its
* Correspondence:
1
Key Laboratory of Tropical Forest Ecology, Xishuangbanna Tropical Botanical
Garden, Chinese Academy of Sciences, 88 Xuefu Road, Kunming 650223, PR
China
Full list of author information is available at the end of the article
Qiu et al. BMC Plant Biology 2010, 10:278
/>© 2010 Qiu et al; licensee BioMed Central Ltd. This is an Open Access article distributed under the terms of the Creative Commons
Attribution License ( which permits unrestricted use, distribution, and reprodu ction in
any medium, provide d the original work is properly cited.
high economic value, castor bean is widely cultivated in
tropical, sub-tropical a nd temperate countries, particu-
larly India, China and Brazil [4]. Due to increased
demand for castor bean in many countries, breeding
and improvement of varieties are drawing great atten-
tion from breeders [5].
Although the genus Ricinus is considered mon otypic,
castor bean v aries greatly in its growth habit, color of
foliage and stems, seed size a nd oil content [6,7]. Mo st
types are large perennials thatoftendevelopintosmall
trees in tropical or subtropical areas; however it is
usually shorter and smaller and grown annual ly in areas
prone to frost. It is obvious that castor bean exhibits
great phenotypic diversity and phenotypic plasticity to
environmental factors. However, little is known about
castor bean’s genetic diversity and the genetic basis of
its phenotypic plasticity. Castor bean is usually consid-
ered to be both self- and cross-pollinated by wind, but
controlled crossing studies suggest that outcrossing is a
frequent mode of reproduction [8,9].
Germplasm collections constitute one of the world’s
most readily available sources of plant genetic material
[10]. T he USDA-ARS Plant Genetic Resources Conser-
vation Unit (at Griffin, GA, USA) collected and main-
tained diverse germplasm resources of castor bean
worldwide, which provided valuable germplasms for cas-
tor bean breeding and improvement of varieties. There
is an increasing need for distinguishing the varieties reli-
ably, establishin g their purity, and fingerprinting
released varieties, hybrids and the parental lines of cas-
tor bean germplasm held in different countries by effi-
cient molecular markers during breeding and
improvement of varieties. Most cultivars have low pro-
ductivity. The castor bean seed, meanwhile, contains the
highly toxic protein ricin which seriously limits its
usage. The main goal of breeding and improvement of
varieties to bree ders is to develop high-productivity and
nontoxic varieties of castor bean. Developing robust and
reliable molecular markers associated with traits of
interest will enhance the breeding program efficiency.
Simple sequence repeats (SSRs) or microsatellites
showing extensive length polymorphisms have been
widely used in DNA fingerprinting, genetic diversity stu-
dies, construction of genetic linkage map and breeding
applications [11]. Previous studies of genetic diversity
suggested that SSRs are more informative and robust
than other available molecular marker resources, such
as amplified fragment length polymorphism (AFLP) and
random amplified polymorphic DNA (RAPD) in castor
bean [12,13]. In particular, SSR markers are readily
transferable between laboratories as each locus is
defined by the primer sequence. S SRs can be used not
only for identif ying cultivars but also for genetic map-
ping and marker-assisted selection [14,15] . Development
of SSR markers specific to castor bean is critical and
should be a priority for assisting in the breeding and
improvement of varieties [5]. The SSR markers of castor
bean are, however, very limited to date bec ause the
de novo development of SSRs is a costly and time con-
suming endeavor [16,17]. The advent of modern geno-
mics age has produced large amounts of publicly
available DNA sequence data. In particular, the
expressed sequence tags (ESTs) provide a valuable
resource for identifying and developing gene-associate d
SSR markers. Linkage of EST-SSR markers with desired
characters may lead to the identification of genes con-
trolling these traits [18]. In addition, EST-SSRs are uni-
versal and can be applied in comparative mapping and
linkage map construction [19,20]. Therefore, in recent
years, EST-SSRs have already been developed for various
crops such as wheat and rice [21-25], barley [26-28],
grape [29], tomato [30], sugar cane [19], cof fee [31-33],
oil palm [34] and rubber tree [35].
To our know ledge, there has been no report of devel-
opment of EST-SSR markers in castor bean to date.
Therefore, we report our work on EST-SSRs derived
from ca stor bean ESTs in the National Centre of Bioin-
formatics Information, USA database, based on (1) the
frequency and distribution of SS Rs in castor bean ESTs,
(2) the establishment and validation of EST-SSR mar-
kers for detection of polymorphism in castor bean, and
(3) the assessment of genetic relationships among 24
germplasm accessions collected from main diversity cen-
ters of castor bean by using EST-SSR markers devel-
oped. These rich SSR resources from castor bean EST
database are publicly available and the polymorphic
EST-SSR markers reported herein would be particularly
useful for genetic map-based analyses as well as popula-
tion genetic studies, facilitating breeding and crop
improvement of castor bean.
Results
Frequency and distribution of microsatellites
A total of 18,928 non-redundant castor bean EST
sequences trimmed were identified from 62,611 publicl y
available EST sequences by run ning the EST-TRIMMER
and the CD-HIT programs. The search for microsatel-
lites in 18,928 non-redundant castor bean ESTs repre-
senting approximately 13.68 Mb revealed 7,732
microsatellites in 5,376 ESTs; nearly one in 3.5 unique
ESTs (28.4%) contained at least one SSR; 2,356 ESTs
contained more than one SSR and 573 SSRs were found
as compound SSRs. This corresponds to an average dis-
tance between SSRs of approximately 1.77 kb (i.e. one
SSR per 1.77 kb) or one SSR-containing EST every 2.45
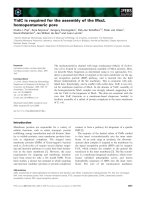
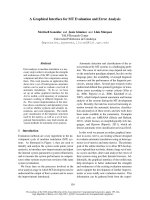
ESTs. The SSRs identified contained 1939 di-, 3698 tri-,
220 tetra-, 61 penta-, 138 hexa-, and 16 76 mononucleo-
tides (Table 1). The trinucleotides are the dominant
Qiu et al. BMC Plant Biology 2010, 10:278
/>Page 2 of 10
motifs (Figure 1). Among motif repeats, 1624 A/T
repeats accounting for 96.9% of total mononucleotide
repeats (1676) were the dominant mono- motifs; 1350
AG/CT repeat accounting for 69.6% of total dinucleo-
tide repeats (1939) are the dominant di- motifs. How-
ever, the trinucleotide motifs were relatively diverse with
321 AAG/CTT, the richest repeat among tri- motifs,
accounting for 8.7% of tot al trinucleotide motifs (3698).
Similarly, there wer e no obvious dominant motifs
among the tetra-, penta- and hexanucleotide motifs.
Inspection of SSR location on EST sequences showed
that 1344 mono- repeats (accounting for 80.2%), 1362
di- repeats (accounting f or 70.3%), 183 tetra- repeats
(accounting for 83.2%), and 47 penta- repeats (account-
ing for 77.1%) occurred within un-translated regions
(UTRs), while 2813 tri- repeats (accounting for 76.1%)
Table 1 Occurrence of 7732 SSRs identified in a set of 18,928 non-redundant castor bean ESTs
SSR motifs Number of repeats
4 5 6 7 8 9 101112131415 >15
A/T 435 288 209 138 119 83 352 1624
C/G 9 14 11 6 4 3 5 52
AC/GT 49 27 11 8 11 3 2 1 2 4 117
AG/CT 623 200 130 81 43 58 29 56 38 17 25 49 1350
AT/TA 181 63 37 40 28 17 28 15 14 6 7 33 469
CG/GC 2 1 3
AAC/GTT 142 41 31 11 5 1 2 233
AAG/CTT 419 184 109 58 42 20 18 17 1 1 869
AAT/ATT 166 96 39 34 2 8 2 2 1 1 351
ACC/GGT 326 125 54 28 7 13 1 554
ACG/CGT 41 18 8 2 3 2 74
ACT/AGT 24 17 8 3 1 53
AGC/GCT 349 135 47 28 22 7 5 1 614
AGG/CCT 177 50 24 19 10 3 1 1 285
ATC/GAT 295 82 30 27 18 6 1 2 461
CCG/CGG 136 34 18 16 204
AAAC/GTTT 12 1 13
AAAG/CTTT 54 24 5 3 4 90
AAAT/ATTT 33 3 1 37
Other Tetra-* 56 17 6 180
AAAGA 10 1 11
Other Penta-* 44 5 1 50
Hexa-* 106 19 11 2 138
N 444 302 220 144 123 86 357 1676
NN 855 290 179 129 82 78 59 71 53 23 34 86 1939
NNN 2095 782 368 226 110 59 27 22 5 0 0 2 2 3698
NNNN 155 45 11 4 4 0 0 0 0 0 0 0 1 220
NNNNN 54 5 0 1 0 1 0 0 0 0 0 0 0 61
NNNNNN 106 19 11 2 0 0 0 0 0 0 0 0 0 138
TOTAL 2410 1706 680 412 243 142 549 383 296 197 146 122 446 7732
* The motif with less 10 SSR was not listed.
0
500
1000
1500
2000
2500
3000
3500
4000
Mono Di Tri Tetra Penta Hexa
SSR Type
SSR Number
Exon Region
UTR Region
Figure 1 Number of mono-, di-, tri-, tetra-, penta- and hexa-
SSRs and their distribution between UTR and exon regions.
Qiu et al. BMC Plant Biology 2010, 10:278
/>Page 3 of 10
and 101 hexa- repeats (accounting for 73.2%) occurred
within expression regions (see Figure 1).
Polymorphism and genera transferability of EST-SSRs
markers
Out of 6056 SSR embedded within 3871 ESTs, exclud-
ing 1676 MNRs, primer pairs could be designed for
4223 SSR loci (69.7%) by u sing PRIMER3. The remain-
ing sequences contained either too little DNA sequence
flanking the SSR loci or the sequences were inappropri-
ate for primer modeling. Three hundred and s eventy-
nine primer pairs flanking 151 di-nucleotide repeats
(DNRs), 185 tri-nucleotide repeats (TNRs), 35 tetra-
nucleotide repeats (TeNRs), 4 penta- nucleotide repeats
(PNRs) and 4 Hexa-nucleotide repeats (HNRs) were
assayed to test the polymorphism and genera transfer-
ability of EST-SSRs in 24 accessions worldwide (see
additional file 1, Table S1, additional). In 308 (81.2%)
cases, PCR products could be amplified with genomic
DNA, while for 71 primer pairs PCR completely failed,
amplified too weakly, or amplified multiple bands and
the 71 primers were excluded from further analysis (see
additional file 2 Table S2, additional). In 21 cases, the
amplicons obtained were of obviously larger size than
expected from the EST sequence, probably due to the
presence of introns. The amplification of introns may
cause problems, since fragments above 300 bp could not
be scored accurately f or small differences in fragment
size. Additionally, it can be assumed that in several
cases the observed polymorphism is caused by a size
polymorphism within the intron, which may overshadow
a putative polymorph ism of t he microsatelli te. Thus the
21 primer pairs containing obvious introns and produ-
cing over 300 bp fragments were also excluded from
further analyses. One Hundred and sixty-nine primer
pairs were monomorphic, covering 56 di- motif loci, 104
tri- motif loci and 9 tetra- motif loci. In total, 118 poly-
morphic EST-SSR markers from 287 primer pairs were
identified, including 68 di- motif loci, 42 tri- motif l oci
and 8 te tra- motif loci (see add itional file 2, Table S2,
additional). The proportion of polymorphic primers was
41.1%. The polymorphic propo rtion of di-, tri-, and
tetra- motif loci were 54.8%, 28.8% and 47%, r espec-
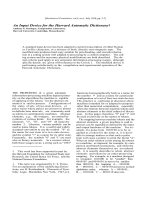
tively. From the 118 loci we identifi ed 350 alleles with
an average of 2.97 alleles per locus (Table S3, Figure 2).
Of the 350 alleles, 223 alleles were from di- loci with an
average of 3.28 per locus, 107 alleles were from tri- loci
with an av erag e of 2.49 per locus. Across 118 loci, gene
diversity (expected heterozygosity, He) ranged from 0.08
to 0.78 (mean = 0.41 ± 0.02). Among 68 dinucleotide
loci and 42 trinucleotide loci, the mean of He were 0.44
and 0.37, respectively. Across dinucleotide and trinu-
cleotide loci, dinucleotide SSRs w ere significantly more
polymorphic than trinucleotide SSRs (nA and He both
P < 0.01; 2-sample t te st). Across 118 loci, PIC values
ranged from 0.07 to 0.73 (mean = 0.36 ± 0.02), suggest-
ing the EST-SSR markers developed had mode rate level
of polymorphism. BLAST analyses showed that 76 EST
sequences from the developed 118 polymorphic SSR
markers shared significant homology to Arabidopsis loci.
The functional annotations of markers developed were
listed in Table S3 (see additional file 3, additional).
To test the genera transferability of EST-SSRs identified
in castor bean to Jatropha curcas and Speranskia canto-
nensis, the 308 primer pairs, which could successfully
amplify PCR products in ca stor bean were tested for
amplification of the genomic DNA of J. curcas and
S. cantonensis with the same PCR conditions used in
castor bean. 155 of 308 (50.2%) primer pairs amplified
in S. cantonensis, and 74 of 308 (24.0%) primer pairs
amplified in J. curcas (see additional file 1, Table S1,
additional).
Genetic relationships among germplasms
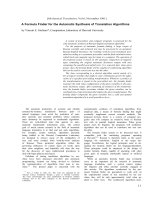
A dendrogram based on UPGMA Nei-Li’ s criteria was
generated with five distinct clusters (Figure 3). Cluster I
Figure 2 PCR products and their length polymorphisms of four EST-SSR markers (Rc05, Rc85, Rc28 and Rc158) on agarose gel among
24 germplasms (see Table 2 for the codes of germplasms).
Qiu et al. BMC Plant Biology 2010, 10:278
/>Page 4 of 10
included two African (SA and MA) and two South Ameri-
can (BR and PE) accessions; Cluster II contained one Afri-
can (DZ), one Russian (RU), and two west Asian (PK and
IR) accessions; Cluster III comprised of one North Ameri-
can (MX) and two Indian (IN-1 and IN-2) accessions;
Cluster IV covered all Chinese (CN1-9) and Vietnam
(VN1-2) accessions. The dendrogram based on Neighbor-
Joining criteria was very similar to the UPGMA tree, and
the five distin ct cl usters (Cluster I, Cluster II, Cluste r III,
Cluster IV and Cluster V in Figur e 3) were again identi-
fied, though there were slight differences in branch length
within clusters (data not shown).
Figure 3 Dendrogra m constructed from genetic distances estimate d from genotype s of 118 EST-SSRs among 24 germplasms using
the UPGMA Nei-Li criteria within PAUP*. The numbers beside lines denote the branch length (see Table 2 for the codes of germplasms).
Qiu et al. BMC Plant Biology 2010, 10:278
/>Page 5 of 10
Discussion
SSR frequency and distribution
The non-redundant EST sequences provided a more
accurate representation of the densiti es of SSR motifs in
the transcribed portions of the genome [20,32]. Based
on the 18,928 non-redundant castor EST sequences,
7732 SSRs were identified. The overall density of SSRs
is one SSR per 1.77 kb, nearly one in 3.5 unique ESTs
(23.6%). Using the same cut-off criteria, Ellis and Burke
inspected the frequency of EST-SSRs from 33 plant gen-
era and found that the frequency varied from one in
every 5 unique ESTs (21%) to one in every 40 unique
ESTs (2.5%), with a mean frequency of nearly one SSR-
ESTs in every 10 uniq ue ESTs (9.0%) [18]. Compared to
the 33 plant genera, castor exhibits considerably high
frequency of EST-SSRs. To further compare the overall
densities of SSRs in castor bean EST sequences with
that reported in other plants, we used the same cut-off
criteria as Cardle et al. [21] with 7, 5, 4 a nd 4 repeats
for di-, tri-, tetra- and penta-, respectively, excluding the
mono-repeats. Correspondingly, we identified 2710 SSRs
with one SSR per 5.0 kb (1/5.0kb) EST sequence in
castor. This density is higher than that in soybean
(1/7.4 kb), maize (1/8.1 kb), tomato (1/11.1 kb), Arabi-
dopsis (1/13.83 kb), poplar (1/14.0 kb), and cotton
(1/20.0 kb). However, it is lower than that in rice
(1/3.4 kb). Similarly, we separately used the same cut-off
criteria as Aggarwal et al. used in coffee [33], Low et al.
used in oil palm [34] and Feng et al. used in rubber tre e
[35], and identified 10,442 (1/1.31 kb), 4,177 (1/3.3 kb)
and 3,616 SSRs (1/3.8 kb) respectively, higher than that
in coffee (1/2.16 kb) and oil palm (1/7 .7 kb), and lower
than that in rubber tree (1/3.39 kb). Varshney et al.
assumed that the high frequency of SSR in rice EST
sequences may be due to its small genome size [36].
The genome size of castor was estimated to be 323 Mb
[37]. The high frequency SSR in castor EST sequences
may be related to its small genome size.
Like other plants, A/T is the main mononucleotide
motif in castor bean EST sequence [23]. Among the
dinucleotide repeat motifs identified, AG/CT repeats
(1350) were the most common in the dataset, account-
ing for 69.6% of the total dinucleotide motifs (1939).
These results are consistent with the frequency of DNRs
identified in Arabidopsis, rice, soybean, maize, oil palm,
coffee, barley, wheat and rubber tree [23,24,27,32,34,35].
Kantety et al. suggested that the high level of occurrence
of GA/CT motifs could be due to the high level of
occurrence of the translated amino acid products of the
motifs [38]. The GA/CT motifs are translated into GAG
(Glu), AGA (Arg), CUC (Leu) and UCU (Ser). We
inspected the codon usage from 200 ORFs containing
44,298 codons in castor bean EST sequences and
detected 10,892 codons for these four amino acids
(24.6% of the total codons analyzed), accounting for that
the four amino acids have a relatively higher frequency
than the amino acids produced by the other dinucleo-
tide repeats (data unshown). Thus, Kantety et al.’ s
assumption was supported in our study. The CG/GC is
the most rare di- repeat in accordance with that
reported in other plants compared [23,24,27,32,34,35].
Varshney et al. reported that among cereal species
TNRswerethemostfrequent(54-78%)followedby
DNRs (17.1-40.4%) and TTNRs (3-6%), excluding MNRs
[36]. Our results (e xcluding MNRs) are consistent with
cereal species with the most frequent TNRs (61.1%), fol-
lowed by D NRs (32.0%), and TTNRs (3.6%). The abun-
dance of trimetric SSRs in ESTs was attributed to the
absence of frameshift mutations in coding regions when
there is len gth variation in these SSRs [39]. Among the
tri- motifs AAG/CTT is the most frequently occurring
(23.5%) in castor bean ESTs, followed by AGC/GCT
(16.6%), ACC/GGT (15.0%), ATC/GAT (12.5%), AAT/
ATT (9.5%). Morgante et al.’s observation that AAG/
CTT is p redominant and CCG/CGG is relatively rare
tri- repeats in dicotyledonous plants [23] was confirmed.
The mono-, di-, tetra- and penta- repeat loci mainly
occurred within UTR region s, while tri- and hexa-
repeat loci occurred mainly within exon region s. This
seems to be a common feature of EST-SSRs and has
often been f ound in other organisms. This could be a
result of selection and evolution, since tri- and hexa-
SSRs do not change the coding frame in coding regions
when there is a SSR length variation, while mono-, di-,
tetra- and penta- SSR easily change the coding frame
within coding regions and give rise to negative mutation
when the SSR length variation occurred.
Polymorphism of EST-SSR markers and genera
transferability
Hitherto, little work has been done on the development
and application of SSR markers in castor bean genetic
and breeding studies. We obtained 118 polymorphic
EST-SSR markers from 379 primer pairs within 24
germplasm sampled with a polymorphic ratio of 41.1%,
excluding the null allele primer s and those that harbor
obvious introns. Compared to other plants, the poly-
morphic ratio of EST-SSR primers in castor bean is at
the medium level [20]. These polymorphic EST-SSR
markers derived herein, to our knowledge, are the first
report on development of genic microsatellite markers
in castor bean to date. Using these 118 polymorphic
EST-SSR markers, 350 alleles were identified from 24
accessions with an average of 2.97 alleles per marker.
Allan et al. reported nine genomic SSR markers with an
average of 0.403 gene diversity (PIC) and an a verage of
Qiu et al. BMC Plant Biology 2010, 10:278
/>Page 6 of 10
3.01 alleles per locus [13]. Bajay et al. developed 12
genomic SSR markers with an average of 0.416 gene
diversity (He) and an average of 3.3 alleles per locus
[40]. Our results displayed that the gene diversity (He)
and PIC value of the 118 polymorphic markers were
0.41 and 0.36, respectively. These results were consistent
with each an other, suggesting that SSR locus of castor
bean represents a moderate level of gene diversity . The
gene diversity values (He and PIC) reported herein can
serve as a guide i n selecting the loci that are most likely
to be informative in further castor bean research.
As mentioned above, di- and tetra- SSRs mainly
occurred within UTR regions, while tri- SSRs mainly
occurred within exon regions. Unsurprisingly, di-
(54.8%) and tetra- (47%) motif loci presented higher
polymorphic proportions than tri- motif loci (28.8%) in
castor bean, suggesting that the SSRs which occurred
within UTR are more polymorphic than those in exon
regions. Across di- and tri- motif loci, di- motif markers
presented significantly higher gene diversity than those
of the tri- motif markers. These observations showed
that the SSR loci harbored within UTR regions were
more polymorphic than these harbored within exon
regions in castor bean.
Transferability of EST-SSRs among closely related
genera has been reported in many crops. Ellis and Burke
summarized the transferability of EST-SSRs among plant
taxa and exhibited a variation range of EST-SSRs cross-
genera transferability from 10% to 80% [18]. O ur results
indicated that castor b ean EST-SSRs had a moderate
transfer rate (50.2%) in S. cantonensis and a relatively
lower transfer rate (24.0%) in J. curcas.Rajietal.
reported the transfer rate of EST-SSR markers devel-
oped from Manihot to castor bean was 15% [4 1]. The
different cross-genera transferability of E ST-SSRs may
be related to the evolutionary distance between the
three genera, since castor bean phylogenetically has a
more distant relationship with Jatropha than Speranskia
and Manihot [42].
Evaluation of genetic relationships among germplasms
As mentioned above, castor bean belongs to a
monotypic genus with great phenotypic diversity and
phenotypic plasticity. Castor bean is a fast-growing and
easily-establishing perennial shrub under various habi-
tats, and is widespread throughout tropical and subtro-
pical regions and is often found on wastelands today. It
is difficult to establish castor bean’s origin now, though
it is thought to be native to the southeastern Mediterra-
nean Basin, Eastern Africa, and India. According to
Moshkin, there are four main centers of genetic variabil-
ity viz., Irano-Afghanistan-USSR region, Palestine-SW
Asia, India-China and the Arabian Peninsula, each with
its own specific plant characteristics [43]. It is an
acceptable view that castor bean landraces collected
from South or Nor th America today were most likely
introduced from A frica or west Asia in early society due
to human activities.
Our current research identified five distinct groups
Clusters I-V within 24 samples using the genotypes of
350 alleles. Apparently, the five clusters lacked a g eo-
graphic structure because the two South American
germplasms (BR and PE) clustered with two African
members (SA and MA) in Cluster I, and the North
American accession (MX) clustered with two Indian
(IN-1 and IN-2) members in Cluster III. However , if we
assume that th e two So uth American germplasms (BR
and P E) and the one North American germplasm (MX)
were introduced from Africa or west Asia, our current
research seems to support, in a way, Moshkin’ sview
[43], namely, Cluster I represents African members,
Clusters II and III represen t Irano-Afghanistan-USSR
and Palestine-SW Asia members, and Clusters IV and V
represent India-China members. It is noteworthy that
the germplasms s ampled in the current study is limited
and incomplete. It remains to be determined whet her
this geographic pattern of germplasm group is present
in a more extensive survey of germplasm samples. Allan
et al.’s studies [13] di d not iden tify distinct geographic
groups among worldwide germplasm s. The possible rea-
sons could be that 1) the polymorphic markers used in
their studies were limited, or 2) many castor bean germ-
plasms were introduced or multi-introduced across sev-
eral continents due to human activities. It may be
difficult to figure out the origin and domestication of
castor bean without the genotype of the wild castor
bean germplasms. Without a do ubt, the polymorphic
EST-SSR markers developed herein will provide robust
genetic markers for further investigation of the origin
and evolution of castor bean, though the geographic
structuring of castor bean germplasms detected from
our current study is uncertain.
Conclusion
In summary, the castor bean EST database harbored
highly rich SSR sites and the EST-SSR markers reported
herein exhibited moderate levels of gene diversity. These
EST-SSR markers should prove useful for both genetic
mapping and population structure analysis, facilitating
breeding and crop improvement of castor bean.
Methods
Plant material and EST retrieval
Twenty-four worldwide accessions representing the
main germplasms of castor bean from 14 countries were
used to screen the polymorphism of SSR markers devel-
oped, and to investigate the genetic diversity of germ-
plasms based on the polymorphic SSR markers. Seeds of
Qiu et al. BMC Plant Biology 2010, 10:278
/>Page 7 of 10
each accession were obtained from the USDA National
Plant Germplasm System />and our collected landraces in China and Vietnam
(Table 2). Phylogenetically, the genus Speranskia has a
closer relationship with Ricinus than the genus Jatropha
[42]. The genomic DNAs of Jatropha curcas and Sper-
anskia cantonensis were used to test the cross-genera
transferability of EST-SSR mark ers which can amplif y
PCR products using castor bean genomic DNA. The
seeds of accessions were germinated at a greenhouse,
and the young leaves were collected for genomic DNA
extraction using a CTAB methodology [44].
Castor bean EST sequences were obtained via the
ENTREZ search tool of the EST database at the NCBI
A total of 62,611
castor bean ESTs originated from different tissues were
available for this study on January 1, 2009, including the
750 ESTs (GE632454-GE637384) from developing seeds
[45], 158 ESTs (AM267320-A M267478) from phloem
[46], 4307 ESTs (EV519634-EV523941) from endosperm
[47], 4,902 E STs (AM267321- AM267479) from d evel-
oping seeds [Kroon et al. released in 2008, unpublished],
329 ESTs (CF981112-CF981441) from seed [Cahoon et
al. released in 2003, unpublished], and the 11,633;
24,567; 5,619 and 10,346 ESTs (EG690439-EG702071,
EG665872-EG690438, EE254600- EE260857, EG656356-
EG6658 71, EE253769-EE254599) from developing seeds,
root, flower and leaf, respectivel y [Melake et al. released
in 2006, unpublished]. The FASTA-formatted files of
EST sequences were downloaded for further data
mining.
Data mining for SSRs
In a preliminary step, polyA and polyT stretches which
correspond to polyA-tails in eukaryotic mRNA were
removed with the help of the EST-trimmer software
/>trimmer.pl until no stretch of (T)5 or ( A)5 was present
in a range of 50 bp on the 5’-or3’ -end, respectively.
EST sequences of less than 100 bp were discarded and
sequences larger than 800 bp were clipped at their 3’
side to preclude the inclusion of low quality sequences
[27]. To remove redunda nt ESTs, the CD-HIT program
[48] was used with a 95% sequence similarity threshold.
Then trimmed non-redundant EST sequences were
scanned using the MISA (MIcroSAtellite) tool [27] to
identify all SSRs within a set of sequence s. We set the
script to identify all possible mono-, di-, tri-, tetra-,
penta- and hexanucleotide repeats (MNRs, DNRs,
TNRs, TeNRs, PNRs and HNRs) with a minimum of 10,
5, 4, 4, 4, and 4 subunits, respectively. The results of the
MISA run were transferred to a Microsoft Excel work-
sheet for further analyses.
To localize the distribution of SSRs on EST sequences,
the ESTscan2 />can2.html was used to inspect the ratio of SSR distribu-
tion on the transcribed regions (TRs) and UTRs.
PCR conditions and separation of microsatellites
Primer pairs were designed from the flanking sequences,
using PRIMER3 software [49] in batch mode via the
p3_in.pl and p3_out.pl Perl5 scripts within the MISA
package [27]. To test the polymorphisms of EST-SSRs
identified in casto r bean, we randomly selected 379 pri-
mer pairs. The target amplicon size was set as 100-300
bp, the optimal annealing temperature as 60°C, and the
optimal primer length as 20 bp.
PCR primers were developed and an M13 forward
(GGAAACAGCTATGACCAT) was added to the 5’ end
of one of each primer pair using OliGO 6.67 (Molecular
Biology Insights) to determine which tag would produce
the least offensive secondary structures. Inclusion of the
5’-tag allows use of a 3
rd
primer in the PCR (M13F) that
is fluorescently labeled for detection on ABI3730 DNA
Analyzer. M13F primers were labeled with a FAM fluor-
escent dye. PCR r eactions were carried out in a 10 μl
volumes containing 1x PCR buffer ( 10 mM Tris-HCl
Table 2 Germplasm accessions used for testing
polymorphism of EST-SSR markers and inspecting
genetic relationships
Code Genbank ID Homology in Arabidopsis
PI 253621 Morocco (MA) From USDA-ARS*
PI 257461 South Africa (SA) From USDA-ARS
PI 257654 Russia (RU) From USDA-ARS
PI 241369 Brazil (BR) From USDA-ARS
PI 215775 Peru (PE) From USDA-ARS
PI 250938 Iran (IR) From USDA-ARS
PI 255238 Mexico (MX) From USDA-ARS
PI 277025 Argentina (AR) From USDA-ARS
PI 167288 Turkey (TR) From USDA-ARS
PI 248961 India (IN-1) From USDA-ARS
PI 258388 Algeria (DZ) From USDA-ARS
PI 250622 Pakistan (PK) From USDA-ARS
CYB03_1-6 Yunnan, China (CN-1) From XTBG Seed Bank
CYN01_2-1 Yunnan, China (CN-2) From XTBG Seed Bank
CYN20_2-20 Yunnan, China (CN-3) From XTBG Seed Bank
CYN21_2-21 Yunnan, China (CN-4) From XTBG Seed Bank
CYN24_2-24 Yunnan, China (CN-5) From XTBG Seed Bank
CYB04_4-1 Yunnan, China (CN-6) From XTBG Seed Bank
INB01_5-6 India (IN-2) From XTBG Seed Bank
CYB05_6-9 Yunnan, China (CN-7) From XTBG Seed Bank
CYSH1_15-1 Shanxi, China (CN-8) From XTBG Seed Bank
CYD3_15-3 Yunnan, China (CN-9) From XTBG Seed Bank
VNBY1 Vietnam (VN-1) From XTBG Seed Bank
VNBH2 Vietnam (VN-2) From XTBG Seed Bank
*USDA-ARS: Plant Genetic Resources Conservation Unit (at Griffin, GA, USA);
XTBG: Xishuangbanna Tropical Botanical Gardens (at Menglun, Yunnan, China)
Qiu et al. BMC Plant Biology 2010, 10:278
/>Page 8 of 10
pH 8.4, 50 mM KCl, and 2 mM MgCl
2
), 100 μM each
dNTP, 0.04 μM tag labeled Forward primer, 0.16 μM
universal dye labeled primer, and 0.2 μM Reverse pri-
mer, and 2 U of Taq DNA polymerase. Approximately
10 ng of genomic DNA was used in each reaction. The
reagents for PCR amplification were from TAKARA
Biotechnology (DaLian) CO. LTD.
Primers were tested using TOUCHDOWN thermal
cycling program s encompassing a 10° span of annealing
temperatures ranging between 65-55°C, or 60-50°C.
Cycling parameters were: an in itial denaturing step of
3 min at 95°C, followed by ten cycles of 30 s at 94°C,
30 s at the highest annealing temperature (annealing
temperature was reduced by 1°C per cycle), 45 s at 72°
C, followed by 30 cycles of 30 s at 94°C, 30 s at 55°C
(for 65-55°C touchdown range) or 50°C (for 60-50°C
touchdown range), 45 s at 72°C, and a final extension
time of 10 min at 72°C. PCR products were initially
scored for amplification on agarose gels, and successful
PCR products were subsequently sized on an ABI 3730
DNA Analyzer, after clean-up with Millipore® 96 well
filter plate. Genescan 500 ROX size standards (Applied
Biosystems, Foster City, California) were run in each
lane to allow for the accurate determination of fragment
size, and alleles were called using the GeneMapper soft-
ware V4.0 (Applied Biosystems). Ambiguous samples
were run a second time.
The putative functions of identified polymorphic mar-
kers were annotated by BLASTX against the NCBI
Non-Redundant Protein />RefSeq/ . In order to test the cross- genera transferability
of SSR markers developed from castor bean EST
sequence, all primer pairs producing successful PCR
bands using castor bean g enomic DNA were tested
using J. curcas and S. cantonensis genomic DNA as
templates.
Statistical analysis
The level of polymorphism per locus (number of alleles,
nA, and expected heterozygosity [i.e., gene diversity],
He) was calculated using the program GDA [50]. The
polymorphic information content (PIC) is a tool to mea-
sure the informativeness of a g iven DNA marker. Thus
we calculated the PIC value for each locus using PIC
calculator />In order to investigate the genetic relationships among
germplasms using these polymorphic SSR markers i den-
tified, we scored these SSR product s as the presence (1)
and absence (0) of the band, thus generating a binary
matrix. The binary data matrix was transferred to the
software PAUP to construc t the dendrogram among
germplasms. The unrooted dengrograms were generated
with Neighbor -Joining and UPGMA Nei-Li’ s criteria
within PAUP*version 4.0 [51].
Additional material
Additional file 1: Table S1: A summary for the primer sequences of 379
EST-SSR markers tested and their PCR amplification using genomic DNA
as templates among castor bean, Jatropha curcas and Speranskia
cantonensis.doc.
Additional file 2: Table S2: Validation and characterization of
polymorphic SSR markers derived EST sequences.doc.
Additional file 3: Table S3: Homology with Aradidopsis and functional
annotations of the EST-SSR markers.doc.
Acknowledgements
We thank Dr Qihui Zhu from University of Georgia for her assistance in SSR
mining. We extend many thanks to anonymous reviewers for their
constructive comments during manuscript review. This work was jointly
supported by NSFC (Grant No.30871548) and the Knowledge Innovation
Program of the Chinese Academy of Sciences (Grant No. KSCX2-YW-G-035-1).
Author details
1
Key Laboratory of Tropical Forest Ecology, Xishuangbanna Tropical Botanical
Garden, Chinese Academy of Sciences, 88 Xuefu Road, Kunming 650223, PR
China.
2
SW China Germplasm Bank of Wild Species, Kunming Institute of
Botany, Chinese Academy of Sciences, Kunming 650204, PR China.
3
Graduate
University of Chinese Academy of Sciences, Beijing 100039, PR China.
Authors’ contributions
LQ and CY developed and screened the DNA markers, performed molecular
and statistical genetic analyses, BT performed data mining analyses and
assisted with developing the DNA markers, JBY assisted with molecular and
statistical genetic analyses. AL designed and coordinated the study and
assisted with statistical genetic analyses and drafting the manuscript. All
authors read and approved the final manuscript.
Received: 3 June 2010 Accepted: 16 December 2010
Published: 16 December 2010
References
1. Hayes WC: The Scepter of Egypt II. Cambridge, Mass. USA: Harvard
University Press; 1953.
2. Weiss EA: Castor bean, Sesame, and safflower. London, Leonard Hill; 1971.
3. Govaerts R, Frodin DG, Radcliffe-Smith A: World checklist and bibliography
of Euphorbiaceae (with Pandaceae). Trowbridge, Wiltshire, Redwood
Books Limited; 2000.
4. Atsmon D: Castor. In Oilcrops of the World, Their Breeding and Utilization.
Edited by: Robbelen G, Downey RK, Ashri A. New York, McGraw-Hill;
1989:438-447.
5. Sujatha M, Reddy TP, Mahasi MJ: Role of biotechnological interventions in
the improvement of castor bean (Ricinus communis L.) and Jatropha
curcas L. Biotechnol Adv 2008, 26:424-435.
6. Weiss EA: Oilseed crops. London, Blackwell; 2000.
7. Li FJ, Wang CL, Wang YF, Chen ZQ, Chen MH, Gao LF: Fatty acid
composition of the castor bean seed of nine castor bean hybrids. China
Oils and Fats 2008, 33:62-64.
8. Meinders HC, Jones MD: Pollen shedding and dispersal in the castor
bean plant Ricinus communis L. J Agron 1950, 4:206-209.
9. Brigham RD: Natural outcrossing in dwarf-internode castor bean, Ricinus
communis L. Crop Sci 1967, 7:353-355.
10. Allard RW, Alvim PDeT, Ashri A, Barton JH: Managing global genetic
resources; the U. S. national plant germplasm system: elements of the
national plant germplasm system. Washington DC, The National
Academies Press; 1991, 43-86.
11. Gupta PK, Varshney RK: The development and use of microsatellite
markers for genetic analysis and plant breeding with emphasis on
bread wheat. Euphytica 2000, 113:163-185.
12. Chakrabarty SK, Banu SS: Genetic diversity in pistillate lines of castor bean
(Ricinus communis). Indian J Agric Sci 1999, 69:729-730.
Qiu et al. BMC Plant Biology 2010, 10:278
/>Page 9 of 10
13. Allan G, Williams A, Rabinowicz PD, Chan AP, Ravel J, Keim P: Worldwide
genotyping of castor bean germplasm (Ricinus communis L.) using AFLPs
and SSRs. Genet Resour Crop Evol 2008, 55:365-378.
14. Powell W, Morgante M, Andre C, Hanafey M, Vogel J, Tingey S, Rafalski A:
The comparison of RFLP, RAPD, AFLP and SSR (microsatellite) markers
for germplasm analysis. Mol Breed 1996, 2:225-238.
15. Collard BCY, Jahufer MZZ, Brouwer JB, Pang ECK: An introduction to
markers, quantitative trait loci (QTL) mapping and marker-assisted
selection for crop improvement: The basic concepts. Euphytica 2005,
142:169-196.
16. Zane L, Bargelloni L, Patarnello T: Strategies for microsatellite isolation: a
review. Mol Ecol 2002, 11:1-16.
17. Squirrell J, Hollingsworth PM, Woodhead M, Russell J, Lowe AJ, Gibby M,
Powell W: How much effort is required to isolate nuclear microsatellites
from plants? Mol Ecol 2003, 12:1339-1348.
18. Ellis JR, Burke JM: EST-SSRs as a resource for population genetics analysis.
Heredity 2007, 99:125-132.
19. Cordeiro GM, Casu R, McIntyre CL, Manners JM, Henry RJ: Microsatellite
markers from sugarcane (Saccharum spp.) ESTs cross transferable to
erianthus and sorghum. Plant Sci 2001, 160:1115-1123.
20. Varshney RK, Sigmund R, Börner A, Korzum V, Stein N, Sorrells ME,
Langridge P, Graner A: Interspecific transferability and comparative
mapping of barley EST-SSR markers in wheat, rye and rice. Plant Sci
2005, 168:195-202.
21. Cardle L, Ramsay L, Milbourne D, Macaulay M, Marshall D, Waugh R:
Computational and experimental characterization of physically clustered
simple sequence repeats in plants. Genetics 2000, 156:847-854.
22. Tóth G, Gáspári Z, Jurka J: Microsatellites in different eukaryotic genomes:
Survey and analysis. Genome Res 2000, 10:967-981.
23. Morgante M, Hanafey M, Powell W: Microsatellites are preferentially
associated with nonrepetitive DNA in plant genomes. Nat Genet 2002,
30:194-200.
24. Nicot N, Chiquet V, Gandon B, Amilhat L, Legeai F, Leroy P, Bernard M,
Sourdille P: Study of simple sequence repeat (SSR) markers from wheat
expressed sequence tags (ESTs). Theor Appl Genet 2004, 109:800-805.
25. Kota R, Varshney RK, Thiel T, Dehmer KJ, Graner A: Generation and
comparison of EST-derived SSRs and SNPs in barley (Houdeum vulgare
L.). Hereditas 2001, 135:145-151.
26. Temnykh S, DeClerck G, Lukashova A, Lipovich L, Cartinhour S, McCouch S:
Computational and experimental analysis of microsatellites in rice (Oryza
sativa L.): Frequency, length variation, transposon associations, and
genetic marker potential. Genome Res 2001, 11:1441-1452.
27. Thiel T, Michalek W, Varshney RK, Graner A: Exploiting EST databases for
the development and characterization of gene-derived SSR-markers in
barley (Hordeum vulgare L.). Theor Appl Genet 2003, 106:411-422.
28. Holton TA, Christopher JT, McClure L, Harker N, Henry RJ: Identification and
mapping of polymorphic SSR markers from expressed gene sequences
of barley and wheat. Mol Breed 2002, 9:63-71.
29. Scott KD, Eggler P, Seaton G, Rossetto M, Ablett EM, Lee LS Henry RJ:
Analysis of SSRs derived from grape ESTs. Theor Appl Genet 2000,
100:723-726.
30. Areshchenkova T, Ganal MW: Comparative analysis of polymorphism and
chromosomal location of tomato microsatellite markers isolated from
different sources. Theor Appl Genet 2002, 104:229-235.
31. Bhat PR, Krishnakumar V, Hendre PS, Rajendrakumar P, Varshney RK,
Aggarwal RK: Identification and characterization of gene-derived EST-SSR
markers from robusta coffee variety ‘CxR’ (an interspecific hybrid of
Coffea canephora x Coffea congensis). Mol Ecol Notes 2005, 5:80-83.
32. Poncet V, Rondeau M, Tranchant C, Cayrel A, Hamon S, de Kochko A,
Hamon P: SSR mining in coffee tree EST databases: potential use of EST-
SSRs as markers for the Coffea genus. Mol Genet Genomics 2006,
276:436-449.
33. Aggarwal RK, Hendre PS, Varshney RK, Bhat PR, Krishnakumar V, Singh L:
Identification, characterization and utilization of EST-derived genic
microsatellite markers for genome analyses of coffee and related
species. Theor Appl Genet 2007, 114:359-372.
34. Low ETL, Alias H, Boon SH, Shariff EM, Tan CYA, Ooi LCL, Cheah SC,
Raha AR, Wan KL, Singh R: Oil palm (Elaeis guineensis Jacq.) tissue culture
ESTs: Identifying genes associated with callogenesis and embryogenesis.
BMC Plant Biol 2008, 8:62.
35. Feng SP, Li WG, Huang HS, Wang JY, Wu YT: Development,
characterization and cross-species/genera transferability of EST-SSR
markers for rubber tree (Hevea brasiliensis). Mol Breed 2009, 23:85-97.
36. Varshney RK, Thiel T, Stein N, Langridge P, Graner A: In silico analysis on
frequency and distribution of microsatellites in ESTs of some cereal
species. Cell Mol Biol Lett 2002, 7:537-546.
37. Arumuganathan K, Earle ED: Nuclear DNA content of some important
plant species. Plant Mol Biol Report
1991, 9:211-215.
38. Kantety RV, La Rota M, Matthews DE, Sorrells ME: Data mining for simple
sequence repeats in expressed sequence tags from barley, maize, rice,
sorghum and wheat. Plant Mol Biol 2002, 48:501-510.
39. Metzgar D, Bytof J, Wills C: Selection against frame shift mutations limits
microsatellite expansion in coding DNA. Genome Res 2000, 10:72-80.
40. Bajay MM, Pinheiro JB, Batista CEA, Nobrega MBM, Zucchi MI: Development
and characterization markers for castor bean (Ricinus communis L.), an
important oleaginous species for biodiesel production. Conservation
Genet Resour 2009, 1:237-239.
41. Raji AA, Anderson VJ, Kolade AO, Ugwu DC, Dixon GA, Ingelbrecht LI:
Gene-based microsatellites for cassava (Manihot esculenta Crantz):
prevalence, polymorphisms, and cross-taxa utility. BMC Plant Biol 2009,
9:118.
42. Wurdack KJ, Hoffmann P, Chase MW: Molecular phylogenetic analysis of
uniovulate Euphorbiaceae (Euphorbiaceae sensu stricto) using plastid
rbcL and trnL-F DNA sequences. Am J Bot 2005, 92:1397-1420.
43. Moshkin VA: History and origin of castor bean. In Castor bean. Edited by:
Moshkin VA. New Delhi, Oxonian; 1986:6-10.
44. Doyle JJ, Doyle JL: A rapid DNA isolation procedure for small quantities
of fresh leaf tissue. Phytochem Bull 1987, 19:11-15.
45. van de Loo FJ, Broun P, Turner S, Ville CS: An oleate 12-hydroxylase from
Ricinus communis L. is a fatty acyl desaturase homolog. Proc Natl Acad Sci
USA 1995, 92:6743-6747.
46. Doering-Saad C, Newbury HJ, Couldridge CE, Bale JS, Pritchard J: A
phloem-enriched cDNA library from Ricinus: insights into phloem
function. J Exp Bot 2006, 57:3183-3193.
47. Lu C, Wallis JG, Browse J: An analysis of expressed sequence tags of
developing castor bean endosperm using a full-length cDNA library.
BMC Plant Biol 2007, 7:42.
48. Li WZ, Godzik A: Cd-hit: a fast program for clustering and comparing
large sets of protein or nucleotide sequences. Bioinformatics 2006,
22:1658-1659 [ />49. Rozen S, Skaletsky HJ: Primer3 on the WWW for general users and for
biologist programmers. Bioinformatics Methods and Protocols: Methods in
Molecular Biology Humana Press, Totowa NJ; 2000, 365-386 [.
mit.edu/primer3/primer3_code.html].
50. Lewis PO, Zaykin D: Genetic data analysis: computer program for the
analysis of allelic data. 2001 [ />software.html].
51. Swofford DL: PAUP*: Phylogenetic analysis using parsimony (*and other
methods), Version 4b. Sunderland, MA: Sinauer Associates; 2001.
doi:10.1186/1471-2229-10-278
Cite this article as: Qiu et al.: Exploiting EST databases for the
development and characterization of EST-SSR markers in castor bean
(Ricinus communis L.). BMC Plant Biology 2010 10:278.
Submit your next manuscript to BioMed Central
and take full advantage of:
• Convenient online submission
• Thorough peer review
• No space constraints or color figure charges
• Immediate publication on acceptance
• Inclusion in PubMed, CAS, Scopus and Google Scholar
• Research which is freely available for redistribution
Submit your manuscript at
www.biomedcentral.com/submit
Qiu et al. BMC Plant Biology 2010, 10:278
/>Page 10 of 10