báo cáo khoa học: " Development of genic-SSR markers by deep transcriptome sequencing in pigeonpea [Cajanus cajan (L.) Millspaugh]" pptx
Bạn đang xem bản rút gọn của tài liệu. Xem và tải ngay bản đầy đủ của tài liệu tại đây (406.34 KB, 13 trang )
RESEARCH ARTICLE Open Access
Development of genic-SSR markers by deep
transcriptome sequencing in pigeonpea
[Cajanus cajan (L.) Millspaugh]
Sutapa Dutta
1,2
, Giriraj Kumawat
1
, Bikram P Singh
1
, Deepak K Gupta
1
, Sangeeta Singh
1
, Vivek Dogra
1
,
Kishor Gaikwad
1
, Tilak R Sharma
1
, Ranjeet S Raje
3
, Tapas K Bandhopadhya
2
, Subhojit Datta
4
, Mahendra N Singh
5
,
Fakrudin Bashasab
6
, Pawan Kulwal
7
, KB Wanjari
7
, Rajeev K Varshney
8
, Douglas R Cook
9
, Nagendra K Singh
1*
Abstract
Background: Pigeonpea [Cajanus cajan (L.) Millspaugh], one of the most important food legumes of semi-arid
tropical and subtropical regions, has limited genomic resources, particularly expressed sequence based (genic)
markers. We report a comprehensive set of validate d genic simple sequ ence repeat (SSR) markers using deep
transcriptome sequencing, and its application in genetic diversity analysis and mapping.
Results: In this study, 43,324 transcriptome shotgun assembly unigene contigs were assembled from 1.696 million
454 GS-FLX sequence reads of separate pooled cDNA libraries prepared from leaf, root, stem and immature seed of
two pigeonpea varieties, Asha and UPAS 120. A total of 3,771 genic-SSR loci, excluding homopolymeric and
compound repeats, were identified; of which 2,877 PCR primer pairs were designed for marker development.
Dinucleotide was the most common repeat motif with a frequency of 60.41%, followed by tri- (34.52%), hexa-
(2.62%), tetra- (1.67%) and pentanucleotide (0.76%) repeat motifs. Primers were synthesized and tested for 772 of
these loci with repeat lengths of ≥18 bp. Of these, 550 markers were validated for consistent amplification in eight
diverse pigeonpea varieties; 71 were found to be polymorphic on agarose gel electrophoresis. Genetic diversity
analysis was done on 22 pigeonpea varieties and eight wild species using 20 highly polymorphic genic-SSR
markers. The number of alleles at these loci ranged from 4-10 and the polymorphism information content values
ranged from 0.46 to 0.72. Neighbor-joining dendrogram showed distinct separation of the different groups of
pigeonpea cultivars and wild species. Deep transcriptome sequencing of the two parental lines helped in silico
identification of polymorphic genic-SSR loci to facilitate the rapid development of an intra-species reference
genetic map, a subset of which was validated for expected allelic segregation in the reference mapping
population.
Conclusion: We developed 550 validated genic-SSR markers in pigeonpea using deep transcriptome sequencing.
From these, 20 highly polymorp hic markers were used to evaluate the genetic relationship among species of the
genus Cajanus. A comprehensive set of genic-SSR markers was developed as an important genomic resource for
diversity analysis and genetic mapping in pigeonpea.
Background
Pigeonpea [Cajanus cajan (L.) Millspaugh] is an impor-
tant food legume predominantly cultivated in the tropi-
cal and subtropical regions of Asia and Africa. It is a
diploid (2n = 22), often cross-pollinated crop with a
genome size of 858 M bp [1]. Pigeo npea plays an impor-
tant role in food and nutritional security because it is a
rich source of protein, minerals and vitamins. Pige onpea
seeds are mainly consumed as split pea soups or ‘ dal’
but a significant proportion is also eaten as green pea
vegetable and as wholegrain preparations. In addition,
pigeonpea leaves, seed husks and pods are used as
animal feed, whereas the stem and branch es are used as
firewood. T he world acreage of pigeonpea is 4.67 Mha
* Correspondence:
1
National Research Centre on Plant Biotechnology, Indian Agricultural
Research Institute, New Delhi 110 012, India
Full list of author information is available at the end of the article
Dutta et al. BMC Plant Biology 2011, 11:17
/>© 2011 Dutta et al; licensee BioMed Central Ltd. This is an Open Access arti cle distributed under the terms of the Creative Comm ons
Attribution License ( which permits unrestricted use, distribution, and re production in
any medium, provid ed the original work is properly cited.
with an annual production of 3.30 Mt. India is the
largest producer and consumer of pigeonpea (local
names ‘arhar’ and ‘toor’) with an annual production of
2.31 Mt, followed by Myanmar (0.60 Mt), Malawi
(0.16 Mt) and Kenya (0.10 Mt) [2].
Knowledge of the genetic basis of yield, resistance to
diseases and insect pests and abiotic s tress tolerance are
important factors for deciding the breeding strat egies
for genetic improvement of pigeonpea. However, in
comparison to other economically important crops, rela-
tively less effort has b een invested in understanding the
genetics of important agronomic traits of pigeonpea.
Although there are ongoing efforts for pigeonpea
improvement through conventional bre eding, including
hybrid technology, molecular breeding has a greater
potential to accelerate the utilization of genetic
resources in pigeonpea, especially among land races and
related germplasm lines [3-8]. The avai lability of
molecular m arkers that are tightly linked to important
agronomic traits is a prereq uisite for undertaking mole-
cular breeding in plants. However, the genetic basis of
most agronomic traits in pigeonpea has been worked
out using conventional biometric techniques that have
inherent limitations. The molecular basis of traits
remains entirely unexplored and to date no molecular
linkage map has been reported for pigeonpea [9,10].
This can be attributed to: (i) the low level of DNA poly-
morphism within the primary (cultivated) gene pool
assessed by means of RAPD, RFLP, AFLP and recently
by diversity array technologies (DArT) [11-15]; and (ii) a
paucity of molecular markers available for genetic analy-
sis in pigeonpea [16-20].
Simple sequence repeat (SSR) markers have the advan-
tage of high abundance, random distribution within the
genome, high polymorphism infor mation content a nd
co-dominant inheritance. However, genomic SSR mar-
kers developed from SSR-enriched genomic libraries or
random genomic sequences are derived primarily from
inter-genic DNA regions, and therefore have uncertain
linkage to the transcribed regions of the genome. In
contrast, genic-SSRs specifically target the transcribed
region of the genome and have increased potential for
linkage to loci that contribute to agronomic phenotypes.
As a c onsequence, when polymorphic genic-SSRs are
identified in high value breeding lines they can have
considerable utility for marker assisted selection (MAS)
[21]. Genic-SSR markers can also facilitate better cross-
genome comparisons because they target protein-coding
regions that are more likely to be conserved between
related species [22]. Expressed sequence tags (ESTs)
based on Sanger’s sequencing technology have become
increasingly abundant in public DNA databases and are
being used for genetic analyses, comparative mapping,
DNA fingerprinting, diversity ana lysis and evoluti onary
studies [23,24]; b ut only a limited number of pigeonpea
Sanger ESTs are available in the public database [9].
We report the development of a large expressed
sequence dataset based on 454 GS-FLX pyrosequenci ng
of cDNA pools from two popular cultivars of pigeonpea,
which are parents of the reference mapping population.
We mined and validated a large se t of genic-SSR mar-
kers and describe their application for understanding
the genetic relationship among selected pigeonpea culti-
vars and wild Cajanus species. The dataset was also use-
ful for in silico mining of polymorphic genic-SSR loci
for the creation of an EST-based intra-species reference
genetic map.
Results
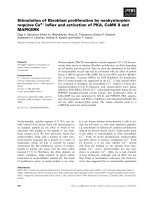
Assembly of non-redundant transcriptome shotgun
assembly (TSA) contigs of pigeonpea
Two runs of 454 GS-FLX pyrosequencing generated
1,696,724 high quality filtered expressed sequence reads
from two separate cDNA library pools of widely adapted
pigeonpea cultivars ‘Asha’ and ‘ UPAS 120’. In prepara-
tion for 454 sequencing, cDNAs were sheared stochasti-
cally to randomly represent all transcripts. Sequence
data described in this paper can be found in the
Sequence Read Archive (SRA) public database of the
NCBI (Ac. No. SRP002556, SRP002557). The total data-
set represents 566.6 Mbp of sequence with an average
rea d length of 334 bp. These reads were first assembled
separately into 35,204 TSA contigs for Asha (NCBI Ac.
No. EZ647865- EZ683068) and 30,147 TSA contigs for
UPAS 120 (NCBI Ac. No. EZ617718- EZ647864) using
the 454 ‘ Newbler’ sequence assembler with average
depths of coverage of 10.41 and 10.10, respectively
(Table 1). To obtain a non-redundant set of unigene
Table 1 Details of pigeonpea transcriptome shotgun sequence reads and their assembly into TSA contigs using
454-Newbler assembler
Variety No. of sequence
reads
Sequence
length (bp)
Average read
length (bp)
Average
depth
Total no.
of contigs
No. of bases in
contigs (bp)
Asha 906,300 303,202,320 335 10.41 35,204 25,404,562
UPAS 120 790,424 263,411,375 333 10.10 30,147 22,824,365
Total 1,696,724 566,613,695 334 10.25 65,351 48,228,927
Dutta et al. BMC Plant Biology 2011, 11:17
/>Page 2 of 13
sequences, the total 65,351 TSA contigs from the two
cultivars were assembled together using Lasergene Seq-
Man Pro™ Version8.0.12softwareinto43,324unigene
sequences with a total sequence length of 31.6 Mbp
(Table 2). Of the 31.6 Mbp sequence, 21.9 Mbp was
from 17,305 sequence contigs common to Asha and
UPAS 120, 5.9 Mbp from 15,525 contigs unique to
Asha, and 3.6 Mbp from 10,494 contigs unique to
UPAS 120. This 31.6 Mbp of TSA sequence was 3.7% of
the estimated 858 Mbp size of the pigeonpea genome
and was used for in silico mining and validation of
genic-SSR markers (Figure 1).
Frequency distribution of different types of genic-SSR loci
A total of 3,771 SSR loci were identified in 3,327 TSA
contigs, representing 7.6% of the total 43,324 unigene
TSA contigs (Figure 1). This study did not include
mononucleotide repeats, complex SSR or SSR loci with
lengths less than 10 bp. Among the SSR containing con-
tigs, 3,028 (91%) possessed single SSR loci, while 299
contigs (9%) had 2-4 SSR loci each. On an average there
was one SSR locus for every 8.4 kbp of TSA unigene
sequence, corresponding to one SSR for every 11.5 TSA
unigene contigs. Dinucleo tide was the most common
repeat unit with a frequency of 60.41%, followed by tri-
(34.52%), hexa- (2.62%), tetra- (1.67%) and pentanucl eo-
tide repeats (0.76%) (Additional file 1a). SSR loci with
di- and trinucleotide r epeats constituted 3, 580 (95%) of
the identified loci. The number of reiterations of a given
repeat unit varied from 5 to 22 (Addit ional file 1b), and
SSRs with f ive reiterations (the minimum limit set dur-
ing the SSR marker discovery) were the most abundant.
The frequency of a given SSR structure and the number
of repeat units in it showed an inverse relationship (Addi-
tional file 1b). Hence, SSR loci with l ess than five repeats
are expected to be even more abundant but were not
included in the present investigation because they would
not be useful in the study of detectable polymorphism
[25]. Motifs showing more than 10 reiterations were rare
with a frequency of <1% (Additional file 2). SSR markers
with a length of 10 bp, the low end cut-off for SSR reten-
tion, were the most frequent (36%) followed by 15 bp
(19%), 18 bp (12%) and 12 bp (11%) lengths; the longest
SSR locus was of 66 bp (A dditional file 1c). From the
3,771 genic-SSR sequences, 207 distinct repeat motifs
were identified, (the 10 most f requent motifs are shown
in Additional file 2). Dinucleotide repeat units TC/GA,
AG/CT and TA/TA were the most abundant with fre-
quencies of 17.20%, 16.67% and 9.41%, respectively.
Among the trinucleotide repeat motifs, GAA/TTC and
CTT/AAG were the most abundant with frequencies of
3.87% and 2.65%, respectively (Additional file 2).
Development and validation of genic-SSR markers
PCR primers were designed from the unique sequences
flanking 2,877 SSR loci identified in the TSA contigs for
the developme nt of genic-SSR markers and were desig-
nated ASSR1 to ASSR2877 (A= ‘Ar har’ , Additional
file 3). Primers could not be designed for the remaining
894 SSR loci because their flanking sequences were
either too short or the nature of seque nce did not fulfill
the criteria for primer design using BatchPrimer3 v 1.0
Table 2 Size distribution of the TSA contigs from two
pigeonpea varieties generated using Newbler assembler
and then aligned together using Lasergene SeqMan
Pro™ software
Contig
source
Contig size (bp)
1-
100
101-
200
201-
300
301-
400
400-
500
>500 Total
Asha 65 2968 2835 4277 2624 2756 15525
UPAS 120 49 2403 2250 3052 1424 1316 10494
Common 0 223 297 536 738 15511 17305
Total 114 5594 5382 7865 4786 19583 43324
906,300 reads
(cv. Asha )
3,771 SSR in 3,327 contigs
2,877 primer pairs
Assembly using 454
“Newbler” assembler
SSR discovery using
BatchPrimer3
Pi th i df
790,424 reads
(cv. UPAS-120 )
43,324 unigene contigs
35,204 contigs
Assembly using Lasergene
SeqMan Pro
TM
v 8.0.12
SSR primers designed
using BatchPrimer3
30,147 contigs
772 primer pairs
550
expected
size
51
larger than
expected size
18
multiple
bands
153
did not
amplify
71
polymorphic
479
monomorphic
P
r
i
mers s
y
n
th
es
i
ze
d
f
or
longer SSR (n 18 bp)
PCR amplification
validated in cv. Asha
Polymorphism tested
on 8 varieties
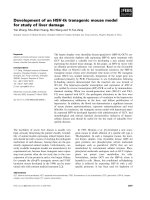
Figure 1 Flow diagram of pigeonpea genic-SSR marker
development. Flow diagram illustrating development of genic-SSR
markers in pigeonpea by deep transcriptome sequencing
Dutta et al. BMC Plant Biology 2011, 11:17
/>Page 3 of 13
software [2 6,27]. From the 2,877 SSR ma rkers, 772 loci
with n ≥ 18 bp including type I SSR markers (n ≥ 20
bp) were selected for prim er synthesis a nd validation
due t o their high chance of showing polymorphism on
agarose gel electrophoresis [25,28].
Of the 772 genic-SSR loci for which primers were
synthesized, 550 yielded PCR amplicons of expected size
andwedesignatedtheseas“valida ted genic-SSR mar-
kers”, as shown in Additional file 4. In addition, 51 pri-
mer pairs amplified larger than the expected size
products, 18 primer pairs amplified multiple products
(≥ 3 bands), and 153 primer pairs failed to amplify even
when the a nnealing temperature was reduced by 7°C.
All the 550 validated genic-SSR markers were scored for
amplicon size polymorphism among eight pigeonpea
varieties showing 71 (12.9%) polymorphi c loci. Sixty-six
of these polymorphic genic-SSR loci showed only two
alleles each a mong the eight tested varieties; f our loci
possessed three alleles each, while one SSR locus
(ASSR281) possessed five alleles. The PIC values of the
71 polymorphic genic-SSR markers ranged from 0.23 to
0.83 with an average of 0.38 (Table 3). A lthough a large
proportion of the SSR loci was monomorphic in the
Table 3 Details of 71 genic-SSR loci showing
polymorphism among 8 pigeonpea cultivars
S. No. Marker Id. (SSR Motif)
n
Product
size
No. of
alleles
PIC
value
1 ASSR1 (GA)
10
100 2 0.47
2 ASSR3 (AGAAAG)
5
145 2 0.47
3 ASSR5 (AAATT)
6
130 2 0.36
4 ASSR8 (AGA)
9
140 2 0.50
5 ASSR9 (AGA)
8
150 2 0.23
6 ASSR11 (CTC)
7
140 2 0.23
7 ASSR12 (AACAC)
6
165 2 0.38
8 ASSR13 (ATTAG)
5
160 2 0.37
9 ASSR15 (CAA)
8
150 2 0.38
10 ASSR16 (GTT)
9
150 2 0.23
11 ASSR17 (CCTTCT)
6
180 2 0.38
12 ASSR19 (TGTTCA)
5
160 2 0.38
13 ASSR20 (AT)
11
140 2 0.23
14 ASSR23 (CCTTCT)
5
150 2 0.47
15 ASSR48 (AAGAGG)
6
150 2 0.30
16 ASSR66 (CT)12 180 2 0.44
17 ASSR70 (GGTAGA)
6
170 2 0.45
18 ASSR77 (CT)
10
140 2 0.41
19 ASSR93 (CATTTG)
5
170 2 0.47
20 ASSR97 (ATGGAC)
8
150 3 0.66
21 ASSR100 (GGT)
7
150 2 0.23
22 ASSR108 (GAT)
7
150 2 0.23
23 ASSR109 (GAA)10 140 2 0.38
24 ASSR120 (CTT)
7
160 2 0.38
Table 3 Details of 71 ge nic-SSR loci showing polymorph-
ism among 8 pigeonpea cultivars (Continued)
25 ASSR148 (CAA)
7
110 2 0.50
26 ASSR153 (GAG)
8
150 2 0.23
27 ASSR155 (TGGACA)
5
130 2 0.23
28 ASSR169 (TCA)
7
160 2 0.23
29 ASSR182 (ATT)
7
220 2 0.38
30 ASSR205 (ATGAAG)
11
170 2 0.38
31 ASSR206 (GTAATA)
6
150 2 0.47
32 ASSR207 (ATCT)
5
190 2 0.23
33 ASSR221 (TCG)
8
165 2 0.23
34 ASSR228 (CTAAGG)
5
140 3 0.53
35 ASSR229 (TAAGGG)
5
160 3 0.53
36 ASSR230 (GAGCAT)
9
170 2 0.38
37 ASSR236 (ACTAGC)
10
230 2 0.23
38 ASSR237 (GGTGAA)
7
180 2 0.23
39 ASSR247 (CACCAA)
6
180 2 0.38
40 ASSR253 (CCCAAG)
6
150 2 0.23
41 ASSR258 (CCATA)
5
140 2 0.23
42 ASSR277 (TCCTGT)
5
130 2 0.50
43 ASSR280 (TGGCAT)
5
170 2 0.23
44 ASSR281 (CAAATG)
6
220 5 0.83
45 ASSR286 (TGTTCA)
5
160 2 0.38
46 ASSR293 (AGA)
7
130 2 0.38
47 ASSR295 (ATA)
8
140 2 0.38
48 ASSR297 (GCCACC)
5
180 2 0.38
49 ASSR304 (GTT)
7
110 2 0.50
50 ASSR317 (GAGCAT)
9
150 2 0.47
51 ASSR352 (TTTAA)
6
130 2 0.47
52 ASSR363 (GCATCA)
5
190 2 0.50
53 ASSR366 (CGT)
8
140 2 0.47
54 ASSR379 (TTCATG)
5
140 2 0.47
55 ASSR380 (TTTC)
5
170 2 0.23
56 ASSR390 (GAGCAA)
6
190 2 0.50
57 ASSR408 (CAC)6 190 2 0.37
58 ASSR416 (TGA)6 210 2 0.37
59 ASSR427 (CT)9 170 2 0.37
60 ASSR495 (CT)9 200 2 0.50
61 ASSR610 (GTG)6 150 2 0.50
62 ASSR613 (CCA)6 150 2 0.21
63 ASSR895 (ATT)6 150 2 0.22
64 ASSR911 (AAT)6 140 2 0.47
65 ASSR980 (AAC)6 150 2 0.37
66 ASSR1193 (CA)9 180 2 0.47
67 ASSR1432 (TTC)6 140 2 0.47
68 ASSR1486 (TTG)6 140 2 0.37
69 ASSR1689 (AAT)6 140 2 0.37
70 ASSR1737 (TA)9 150 2 0.50
71 ASSR1848 (CAT)6 150 3 0.59
Average 2.1 0.38
Annealing temperature for all 71 markers was 55°C. *Primer details and gene
annotation is shown in Additional file 4.
Dutta et al. BMC Plant Biology 2011, 11:17
/>Page 4 of 13
eight pigeonpea varieties, some of these are likely to
show polymorphism on analysi s of a large r set of
varieties. Use of more sensitive techniques for DNA
fragment size analysis, e.g. polyacrylamide gel electro-
phoresis or capillary electrophoresis, is also expected to
show a higher rate of polymorphism.
The 550 SSR loci were searched against the non-
redundant (nr) protein database of NCBI using BLASTX
to assig n functions to the TSA unigene sequences. This
database includes all non-redundant GenBank CDS
translations, PDB (Protein Data Bank), SwissProt, PIR
(Protein Information Resource) and PRF (Protein
Research Foundation), excluding environ mental samples
from Whole Genome Sequencing projects. The search
output was used to categorize these expressed sequences
into two classes: (i) putative known function, and (ii)
unknown function, similar to that used for rice genes
[29], except that there can be no hypothetical protein
category here due to the transcriptomic origin of the
sequences, hence matches with hypothetical protein
annotations were also classified as unknown (A dditional
file 4). Putative known functions could be assigned to
297 (54%) sequences that showed a significant homology
to reported proteins. The remaining 253 (46%)
sequences were of unknown function, including 105
(19%) sequences which did not show a significant match
in the database and therefore may encode proteins that
are unique to the pigeonpea genome, or may correspond
to a n untranslated region (UTR) and/or d iverged
C-terminal coding region. Our analysis of the location
of SSR markers within the TSA contigs revealed that
among the 550 validated genic-SSR markers, 339
(61.6%) were located in the protein coding region, 87
(15.8%) in the 5’-UTR and 124 (22.5%) in the 3’-UTR
(Additional file 4). Analysis of polymorphism among the
three categories of genic-SSR loci revealed that those
located in the 3 ’-UTR were the most polymorphic
(23.4%), followed by 5’ -UTR (12.6%) and coding
sequences (9.1%). Further annotation of all the 43,324
TSA unigen e contigs and single nucleotide polymorph-
ism characterization between the reference varieties
Asha and UPAS 120 is in progress.
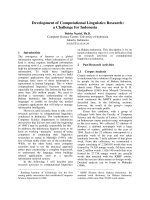
Assessment of genetic diversity among pigeonpea
varieties and related species
The 20 highly polymorphic genic-SSR markers designed
in this study were used to assess the genetic diversity in a
set of 30 genotyp es repr esenting diverse cultivated geno -
types, wild species of Cajanus and inter-specific deriva-
tives (Figure 2, Additional file 5). In total, 125 different
DNA fragments with an average of 6.25 alleles per locus
were amplified among the 30 genotypes. The number of
alleles per SSR marker ranged from 4 for ASSR66 to 10
for ASSR3, whereas the PIC values ranged from 0.46 to
0.72 with an average of 0.63 per marker. As expected, a
higher average number of alleles and PIC values were
observed for the wild species (4.1 alleles per locus and
0.72 PIC value) compared to those for C. cajan cultivars
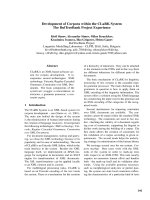
(3.75 alleles per locus and 0.49 PIC value) (Table 4). Jac-
card’s similarity coeffic ients were calculated for pair-wise
combinations of all the genotypes and a dendrogram was
constructed to resolve the members of the primary, sec-
ondary and tertiary gene pools in the two main groups
(Figure 3). Cluster I corresponded to the primary gene
pool, including all the C. cajan cultivars in sub-cluster
Ia
1
, while sub-cluster Ia
2
was represented by a single
entry Rhynchosia aurea. Cluster Ib included two geno-
types of C. platycarpus,suggestingthatitisclosertoC.
cajan than C. cajanifolius. Intra sub-cluster similarity in
Cluster I ranged from 16.5% to 52%. Cluster II included
M 1 2 3 4 5 6 7 8 9 10 11 12 13 14 15 16 17 18 19 20 21 22 23 24 25 26 27 28 29 30 M
50 bp
100 bp
150 bp
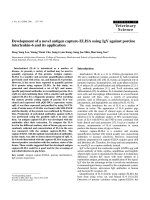
Figure 2 Allelic variation for genic-SSR marker ASSR-2 77 among pigeonpea genotypes. Agarose gel showing allelic variation among 30
pigeonpea genotypes with genic-SSR marker ASSR-277: 1 Asha, 2 UPAS 120, 3 HDM04-1, 4 Pusa dwarf, 5 H2004, 6 Bahar, 7 Maruti, 8 TTB7, 9
Pusa 992, 10 PS-971, 11 PS-956, 12 Pusa-9, 13 JA-4, 14 Kudarat, 15 PCMF40, 16 PCMF43-7, 17 PCMF39-1, 18 GT288A, 19 GTR-9, 20 GTR-11, 21
ICPA2089A, 22 ICPR2438, 23 R. aurea,24C. platycarpus (1), 25 C. cajanifolius, 26 C. platycarpus (2), 27 R. braoteaca, 28 C. sericea, 29 C. albicans 30
C. lineatus. M-50 bp DNA ladder
Dutta et al. BMC Plant Biology 2011, 11:17
/>Page 5 of 13
Table 4 Details of 20 highly polymorphic pigeonpea genic-SSR markers, including a range of allele sizes, number of
alleles and PIC values among 30 genotypes
Sr. No. Marker Id. Allele size (bp) Number of alleles PIC Value
Cultivars Wild Total Cultivars Wild Total
1. ASSR1 75-120 3 4 7 0.46 0.67 0.65
2. ASSR3 125-150 3 3 4 0.43 0.85 0.69
3. ASSR8 130-150 5 4 5 0.68 0.72 0.69
4. ASSR23 130-170 4 4 5 0.40 0.55 0.62
5. ASSR66 170-210 2 6 8 0.35 0.82 0.68
6. ASSR70 150-190 4 3 7 0.23 0.78 0.48
7. ASSR93 140-170 4 4 6 0.48 0.50 0.56
8. ASSR97 90-150 3 7 10 0.29 0.86 0.56
9. ASSR148 90-120 5 3 5 0.59 0.82 0.71
10. ASSR206 115-155 2 2 6 0.63 0.77 0.69
11. ASSR228 130-150 5 2 5 0.68 0.83 0.71
12. ASSR277 90-145 2 7 8 0.30 0.61 0.53
13. ASSR281 210-245 5 3 5 0.69 0.67 0.72
14. ASSR304 90-120 6 6 9 0.35 0.82 0.64
15. ASSR317 13-170 5 5 8 0.65 0.85 0.72
16. ASSR352 110-145 3 3 5 0.77 0.69 0.65
17. ASSR363 170-195 4 5 5 0.48 0.78 0.66
18. ASSR366 135-150 3 5 6 0.33 0.63 0.52
19. ASSR379 120-140 4 2 5 0.73 0.47 0.72
20. ASSR390 160-195 3 4 6 0.41 0.72 0.46
Average 3.75 4.1 6.25 0.4965 0.7205 0.633
Asha
GTR9
HDMO4-1
H2004-1
JA4
PCMF39-1
PCMF40
PCMF43-7
GT288A
PS 971
Pusa 9
Kudarat
ICPA2089A
ICPR2438
UPAS 120
PS 956
C. Cajan Cultivars
TTB7
Pusa Dwarf
Bahar
Maruti
Pusa 992
GTR 11
R.aurea
C.Platycarpus (1)
C.Platycarpus (2)
C. cajanifolius
C. lineatus
C. scricea
R. bracteata
C. albicans
0.04
0.16 0.28 0.40
0.52
I
II
Ia
Ib
Ia
1
Ia
2
IIa
IIb
Wild s
p
ecies
Similarity coefficient
Figure 3 Phylogenic relationship among pigeonpea varieties and wild species based on genic-SSR markers. Dendrogram showing
phylogenetic relationship among 22 Cajanus cajan varieties and 8 wild species generated from 20 genic-SSR markers. Scale at the bottom of the
dendrogram indicates the level of similarity between the genotypes.
Dutta et al. BMC Plant Biology 2011, 11:17
/>Page 6 of 13
the remaining five wild speci es of the secondary and ter-
tiary gene pool (Figure 3). Cluster II was divided into two
sub-clusters IIa and IIb, at a cut-off similarity index of
26%. The three wild species, namely R. aurea, C. platy-
carpus 1 and 2, showed close relatedness to C. cajan cul-
tivars but were in the tertiary gene pool due to lo w
crossability with cultivated pigeo npea. Among the
C. cajan cultivars, three pairs- PCMF40/PCMF43-7, Pusa
9/Kudarat and PS 971/PS 956 showed the highest simi-
larity (52%).
In silico analysis of SSR polymorphism between
Asha and UPAS 120
One aim of the present in vestigation was in silico iden-
tification of SSR polymor phism between pigeonpea vari-
eties Asha and UPAS 120 for the development of an
EST-based intra-species referen ce genetic map. TSA
contigs were first assembled s eparately for Asha and
UPAS 120 using the 454-Newbler assembler and then
aligned together using Lasergene SeqMan Pro™ Version
8.0.12 software to obtain the SSR size differences
between Asha and UPAS 120 varieties. A total of 1,484
SSRlociwerepresentinthe17,305TSAcontigscom-
mon to Asha and UPAS 120. Only 318 of these loci
were type I SSR (n ≥ 20 bp) of which 47 we re
polymorphic between Asha and UPAS 120 with size dif-
ferences of 2-15 bp based on the in silico alignments.
Further, only 24 of these loci showed allelic size differ-
ences of ≥4 bp, which is considered amenable for analy-
sis on gel electrophoresis. For wet laboratory validation
of polymorphism we chose these 24 SSR loci and desig-
nated them as ASSR1 to ASSR24. Four of the markers
(ASSR4, ASSR6, ASSR18, ASSR22) did not amplify any
PCRproduct,onemarker(ASSR21)showedalarger
than expected product size, while nine markers ampli-
fied but did not show distinct polymorphism on agarose
gel electrophoresis perhaps due to small product size
difference (average 4.8 bp difference), or actual lack of
polymorphism . The remaining 10 primers (ASS R1, 3, 8,
9, 12, 13, 15, 17, 19, 23) showed distinct size poly-
morphism between Asha and UPAS 120 as expected
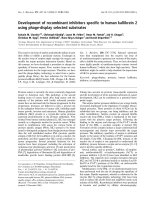
from the in silico analysis (average 7 bp difference).
Figure 4 presents such an example with ASSR8, where
agarose gel electrophoresis confirmed the expected 15
bp size difference between Asha and UPAS120 and a
Mendelian segregation ratio of 1:2:1 in the F
2
mapping
population derived from the cross between Asha and
UPAS 120. Thus, 40% of the 24 in silico identified poly-
morphic SSR loci were validated successfully by wet
laboratory analysis.
Discussion
Conventional breeding of pigeonpea has continued
entirely without the aid of molecular methods and made
limited u se of germplasm resources, resulting in a very
narrow genetic base in the domesticated species. As a
consequence, pigeonpea genetic improvement programs
have made relatively little progress in addressing the
primary constraints to crop production, which include a
range of abiotic (e.g. drought, salinity and water-
logging) and biotic (e.g. Fusarium wilt, sterility mosaic
disease and pod boring insect Helicoverpa a rmigera)
stresses. With the advent of next generation sequencing
technologies several crop legumes have recently been
subjected to intensive analyses, making marker-assisted
breeding a reality [30]. Margulis et al. [31] demon-
strated a 100-fold sequencing capability with 454 GS-
FLX pyrosequencing but with relatively lower accuracy
M A U 1 2 3 4 5 6 7 8 9 10 11 12 13 14 15 16 17 18 19 20 21 22
Ă
ď
Figure 4 Wet laboratory validation of in silico identified genic-SSR length polymorphism between pigeonpea parental lines. Pigeonpea
genic-SSR locus ASSR-8 showing: a. in silco polymorphism between the aligned TSA contigs of parental lines Asha (A) and UPAS 120 (U), b.
agarose gel analysis of segregation of the ASSR-8 alleles in F
2
population. Positions of flanking primers and the polymorphic SSR sequence are
highlighted.
Dutta et al. BMC Plant Biology 2011, 11:17
/>Page 7 of 13
at the homopolymer positionsthanSanger-basedcapil-
lary electrophoresis sequencing. We used 454 GS-FLX
pyrosequencing to de velop an extensive colle ction of
expressed sequence reads from two parental pigeonpea
cultivars and mined and validated a comprehensive set
of genic-SSR markers.
A total of 1.696 million high quality sequence reads
were assembled to generate 43,324 TSA unigene contigs,
which together represented a large fraction of the
pigeonpea transcriptome and helped develop a compre-
hensive set of genic-SS R markers. Application of a sub-
set of t hese markers in pigeonpea was sufficient to
assess the genetic diversity among cultivars and position
domesticated accessions rela tive to related species and
genera. These markers represent a significant addition
to the limited set of genic-SSR markers available in
pigeonpea [16-20].
Only 81.8% of the SSR-containing unigene sequences
showed significant hits in the NCBI non-redundant pro-
tein database. This may be due to: (i) EST fragments
sequenced directly instead of after cloning; this leads to
truly rando m sequencing of all the expressed genes that
may facilitate the discovery o f new rare transcripts as
evidenced by Emrich et al. [32]; or (ii) unique contigs
being part of a consensus sequence representing
3’-UTRs; C-termini or 3’ sequences which are often less
conserved than other transcript regions [33].
The deep transcriptome sequence data allowed the
discovery of a set of 3,771 perfect SSR loci of ≥10 bp
length in pigeonpea. About 7.6% of the pigeonpea TSA
unigene c ontigs possessed at least one SSR- similar to
previously reported SSR prevalence in the ESTs of
wheat ( 7.41%), higher than grapes (2.5%), barley (2.8%)
and flax (3.5%), but lower than coffee (18.5%)
[22,34-37]. The genic-SSR frequency also depended on
the parameters used in exploring SSR markers, e.g. the
repeat length and number of repeat unit thresholds. The
abundance of genic-SSR (kbp/SSR) in pigeonpea was 8.4
compared to 3.4 in rice, 5.4 in wheat, 7.4 in soybean,
11.1 in tomato, 14.0 in Arabidopsis, and 20.0 in cotton
[37,38]. Differences in genic-SSR abundance could be
partly due to the size of the EST unigene assembly data-
set and use of different search criteria and data mining
tools [21]. Frequency distribution of EST-SSR motifs in
our study was not comparable with earlier work on
pigeonpea by Raju et al. [20] because we developed TSA
unigene contigs using FLX-454 sequencing, instead of
Sanger sequencing. The number of SSRs identif ied in
the present study was 3,771 from 43,324 unigene
sequences, whereas Raju et al. described 3,583 SSRs
from only 5,508 unigenes. The main reason for the
overestimation of SSR frequency by Raju et al. is the
inclusion of compound SSRs a nd homopolymers which
are the most frequent repeats.
Dinucleotide SSR loci were most frequent in the
pigeonpea TSA contigs analyzed here, re presenting
60.41% of the SSR loci identified, i.e. about double that
of the trinucleotide SSR loci (34.52%), the second most
abundant motifs. T his was in agreement with the genic-
SSR distribution reported in peach, pumpkin, spruce,
coffee and kiwifruit, where dinucleotide repeats are
most frequent [39-42]. However, this is in contrast t o a
number of earlier reports showing trinucleotides as the
most abundant class of SSR loci in ESTs [22,35,43-47].
A possible explanation for the high frequency of dinu-
cleotide SSR loci in pigeonpea TSA is that these include
large amounts of information representing UTRs due to
deep transcriptome sequencing. Yu et al. [48] reported
19% of dinucleotide repeats in the coding region and
81% in the 5’ -and3’-UTRs, whereas 74% of the trinu-
cleotide repeats were in the coding regions and only
26% in UTRs. Among the 55 0 validated SSR loci with
n≥18 bp in the present study, only 97 (17.6%) w ere
dinucleotide repeats and 56 were in the UTR. Most of
the dinucleotide SSR loci showed a smaller size range of
10-12 bp (Additional file 2). Our study also showed that
the overall proportion of polymorphic SSR markers was
much higher in UTRs compared to the coding region-
there were 40 polymorphic SSR markers in UTRs (11 in
5’ -UTR and 29 SSR in 3’-UTR), whereas only 31 were
polymorphic in the coding region, despite 61. 7% of all
amplified SSR markers being located i n the coding
region. This is due to the tendency of sequence conser-
vation in the coding regions.
Only 80% of the 772 tested SSR pri mers amplified the
target pigeonpea genomic DNA. The success rate is
comparable to barley, where 67-70% of t he primers
amplified [43,34], but higher than sugarcane (48.5%) and
lower than flax (92.2%) [35,49]. A possible explanation
for the lack of amplification could be flanking primers
extending across a sp lice site with a large intron or chi-
meric cDNA contigs [34]. Although the majority (519
numbers) of the designed SSR markers amplified a sin-
gle expected product size at the annealing temperature
of 55°C, we optimized the annealing temperature of 31
additional primers to maximize the availability of genic-
SSR markers for pigeonpea.
Generally genic-SSR markers show a lower level of
polymorphism than genomic-SSR markers [22,50-52],
but in this study the use of type I genic-SSR markers
showed a high level of polymorphism. Previous diversity
studies with pigeonpea species using genomic-SSR mar-
kers reported an average of 3.1-4.9 alleles per locus with
average PIC values of 0.41-0.52 [15,17-19]. An earlier
study with genic-SSR markers in pigeonpea reported the
average number of alleles per marker as 4 and an aver-
age PIC value of 0.40 [20]. We observed a higher aver-
age of 6.25 alleles per locus and an average PIC value of
Dutta et al. BMC Plant Biology 2011, 11:17
/>Page 8 of 13
0.63 by using type I genic-SSR markers. The possible
reasons are: (i) choice of 20 highly polymorphic SSR
markers for the diversity assessment on 30 genotypes
after initial testing of 550 markers on eight variet ies; (ii)
higher depth of coverage generated by the 454 GS-FLX
sequencing technology that produced larger sequence
contigs including UTRs which are more polymorphic;
(iii) use of a diverse genotype set including interspecific
derivatives and wild Cajanus species for diversity assess-
ment. Contrary to other plant species where dinucleo-
tide repeats showed high polymorphism [33,43,46],
hexanucleotide repeats werehighlypolymorphic
(38.57%) in pigeonpea genic-SSR markers, followed by
pentanucleotides (29.14%) and trinucleotides (15.25%).
Larger repeats have been linked to a higher degree of
polymorphism in earlier studies [25,53]; we also found
the maximum polymorphism with 40-50 bp SSR length
on agarose gel electrophoresis.
On the b asis of SSR polymorphism, cluster analysis
and earlier diversity studies involv ing RFLP, AFL P,
RAPD, SSR and DArT ma rkers, it is concluded that
genetic diversity in the pigeonpea g ene pool is very low
[11-20]. The genic-SSR markers reported here open up
new opportunities to assess the genotypic diversity in
the pigeonpea germplasm. Most of the earlier reported
SSR markers in pigeonpea are of genomic origin except
for 84 genic-SSR markers reported recently [20]. This
study is the first report a comprehensive set of genic-
SSR markers for pigeonpea.
Wild species of crop plants are p laced in different
gene pools based on their crossability with the cultivated
species. Closely related and easily crossable species are
placed in the prima ry or secondary gene pools, whereas
species which are distantly related and are incompatible
with the cultivated species, are placed in a tertiary gene
pool. Species in the primary and secondary gene pools
can be readily utilized for varietal improvement. In this
study, the “unweighted pair group method with arith-
metic mean” (UPGMA)-based cluster analysis grouped
the genotypes according to their gene pool. The variabil-
ity within the C. cajan cultivars which easily cross-hybri-
dize among themselves formed the primary gene pool
(Cluster I), whereas four species that have poor cross-
ability with the C. cajan formed the secondary gene
pool (Cluster II). Sub cluster Ib (C. platycarpus 1 and 2)
and sub-sub cluster Ia
2
(R. au rea) included species from
the tertiary gene pool even though they were closely
related to C. cajan based on the marker analysis. The
varieties of C. cajan showed different levels of similarity,
e.g. PCMF 40 and PCMF 43-7, both in ter-specific deri-
vatives belonging to the short maturity group, shared
52% similarity between them and 40% similarity wi th
PCMF 39-1 having similar pedigree. Likewise, short
duration variety pair (PS-971/PS-956) and long duration
variety pair (Pusa-9/Kudarat) were closer to each other
than varieties belonging to different maturity groups.
Genotypes of secondary and tertiary gene pools
clustered separately into two sub-clusters. R. aurea and
C. platycarpus belong to the tertiary gene pool due to
poor crossability with the cultivated pigeonpea, but they
showed genetic similarities with C. cajan.Theseresults
are also supported by Raju et al. [20] who used 15
EST-SSRs to study the genetic diversity of 3 2 cultivars
and eight accessions of two Cajanus species C. platycar-
pus and C. scarabaeoides. Earlier, a close relationship
was reported between C. cajanifolius and C. cajan using
genomic SSR markers [ 17,19], but our study b ased on
genic-SSR markers showed that C. cajanifolius is more
distant to C. cajan compared to C. platycarpus.UPAS
120, TTB 7, Pusa Dwarf and Bahar genotypes belonging
to different maturity groups were part of a single cluster.
Genotypes of secondary and tertiary gene pools clustered
separately in two sub-clusters, but R. bracteata which
belongs to the tertiary gene pool based on the crossability
criteria clustered with genotypes of the secondary gene
pool. The closeness between Cajanus and Rhynchosia is
also supported by morphological and genetic evidence, i.
e. the presence of strophiole, an important characteristic
used to distinguish between the genera. Seeds of Cajanus
and Rhynchosia are generally described without stro-
phioles. Various species of Rhynchosia,eventhough
genetically closer to Cajanas, fail to produce hybrids
bec ause of reproductive barriers, and therefore Rhyncho-
sia and Cajanus are classified as separate genera. High
resolution mapping of these genotypes using a large
number of genomic markers for diversity analysis may
provide different results because genic-SSRs represent
the transcribed portion of the genome, while the repeti-
tive heterochromatin portion of the genome plays a
major role in the evolution of species [54].
This is the first report of development and validation
of a comprehensive set of genic-SSR markers in pigeon-
pea b y deep transcriptome sequencing using next gen-
eration sequencing technology. A set of 2,877 genic-SSR
markers was developed, and 550 SSR marke rs from this
were validated for robust amplification in eight pigeon-
pea varieties, that will be useful for diversity analysis as
well as mapping and tagging of genes and quantitative
trait loci for economically important traits in pigeonpea.
Conclusions
A d ataset of 43,324 TSA unige ne contigs derived from
1.69 million 454 GS-FLX sequence reads of two pigeon-
pea varieties was produced. A comprehensive set of
2,877 genic-SSR ma rkers was developed and 550 o f
these were vali dated for amplifi cation and polymorph-
ism, which will be useful for the development of mole-
cular maps based on genic markers. Of the 550,
Dutta et al. BMC Plant Biology 2011, 11:17
/>Page 9 of 13
20 highly polymorphic markers identified all the indivi-
duals of a set of 30 genotypes including cultivars and
wild species. Due t o conservation of genic sequences
these markers have a higher chance of transferability
across species, compared to genomic SSR markers
which show high polymorphism but are less conserved
between species. A combination of these genic-SSR
markers, single nucleotide polymorphism markers being
mined from the TSA cont igs assembled in this study
and genomic SSR markers developed in other labora-
tories will be a powerful resource for molecular taxo-
nomic studies and construction of a reference molecular
map of the pigeonpea g enome. Since genic-SSR markers
belong to the gene-rich regions of the genome, some of
these can be exploited for use in marker-assisted breed-
ing of pigeonpea. Therefore, the set of genic-SSR mar-
kers developed here is a promising genomic resource.
Methods
Plant materials
Root, leaf, stem and immature seeds from two pigeonpea
varieties, namely Asha and UPAS 120, were used for RNA
extraction and transcriptome sequencing. The 30 geno-
types used for validation of SSR markers and diversity ana-
lysis included members of primary (20 cultivars of C.
cajan), secondary (C. albicans, C. cajanifolius, C. lineatus,
C. sericeus) and tertiary (C. platycarpus, R. aurea, R. brac-
teata) gene pools. The genotypes were originally obtained
from IARI, New Delhi, ICRISAT Hyderabad, IIPR Kanpur,
CCSHAU Meerut, JNKVV Jabalpur, GAU S.K. Nagar, and
maintain ed at the Indian Agricultural Res earch Institute,
New Delhi (Additional file 5 ).
RNA extraction and cDNA sequencing
PlantRNAwasisolatedusingthemodifiedCTAB
method [55]. One gram of frozen leaf, root, stem or
immature seed tissue was separately ground in liquid
nitrogen and mixed with 15 ml of extraction buffer (100
mM Tris-HCL (pH 8) , 2% CTAB, 30 mM EDTA, 2 M
NaCl, 0.05% spermidine, 2% polyvinylpolypyrrolidinone
(PVP) and 2% 2-mercaptoethanol. The homogenate was
incubated at 65°C for 10 min and extracted with chloro-
form-isoamyl alcohol (24:1), and RNA precipitated with
12 M LiCl. After washing with 70% ethanol the RNA
pellet was dissolved in diethylpyrocaronate (DEPC) trea-
ted w ater. Equimolar concentrations of extracted RNA
from the four different tissues of each variety were
mixed to create two RNA pools and sent to Roche for
454 GS-FLX sequencing.
Development of genic-SSR markers and in silico analysis
of parental polymorphism
Expressed sequence reads were generated by deep tran-
scriptome sequencing fro m two sets of normalized
cDNA libraries. High quality filtered sequence reads
were obtained by 454 GS-FLX sequencing, and sequence
contigs were generated for the two v arieties separately
by de novo assembly using 454 ‘ Newbler ’ assembler.
Sequence data for C. cajan Short Read Archive (SRA)
described in this paper can be found in the public data-
base (Ac. no. SRP002556, SRP002557). A non-redundant
set of unigene sequences was created by further align-
ments of the Newbler contigs from the two varieties
using Lasergene SeqMan Pro™ Version 8.0.12 assembler
with default parameter s to develop 43,324 unigene con-
tigs. This unigene set was used for mining genic-SSR
markers and primer design using BatchPrimer3 v1.0
software [26,27]. In this study, the SSR loci containing
perfect repeat units of 2-6 nucleotides only were consid-
ered. The m inimum SSR length criteria were defined as
five reiterations for e ach repeat unit. Mon onucleotide
repeats and complex SSR types were exclu ded from the
study.
The parameters for designing primers from the SSR
flanking sequences were: primer length range of 20-25
bases with an optimum of 22 bases; PCR product size
range of 100-200 bp; optimum annealing temperature
of 50-60°C; GC content of 40-60% with an optimum
of 50%; the specified number of consecutive Gs and
Cs at the 3’ end of both primers was one. Other para-
meters were at the default setting of BatchPrimer3
v1.0 [26].
We also performed in silico analysis of parental poly-
morphism for SSR loci present in the 17,305 TSA con-
tigs common to Asha and UPAS 120. Type I SSR loci
with n≥20 bp were targeted and pair-wi se alignment of
these contigs was inspected manually to identify SSRs
with a minimum size difference of 4 bp between Asha
and UPAS 120. Primers were synthesized for the 24 SSR
loci with size difference of ≥4 bp f or validation by PCR
amplification and agarose gel electrophoresis as
described below.
Plant DNA extraction, genotyping and annotation
of gene function
Genomic DNA was isolated from leaf samples of 30
genotypes (Additional file-2) according to the CTAB
method [56], quantified by UV
260
absorbance and
adjusted to a final concentration of 30 ng/μl. All the 772
genic-SSR loci with SSR lengths of 18 bp or longer were
first tested for amplification using genomic DNA from
Asha for optimization of the annealing temperature.
The PCR reactions w ere performed using PTC225 Gra-
dient Cycler (MJ Research). Each PCR reaction consisted
of 1.5 μl of 10x reaction buffer, 0.20 μlof10mM
dNTPs (133 μM), 1 .5 μ l each of forward and reverse
primers (10 pmol), and 2.5 μl of template genomic
DNA (75 ng), 0.15 μl of Taq DNA polymerase
Dutta et al. BMC Plant Biology 2011, 11:17
/>Page 10 of 13
(0.75 U) Vivantis Technologies) in a final reaction
volume of 15 μl. The PCR reaction profile was: DNA
denaturation at 94°C for 5 min. followed by 35 cycles
of 94°C for 1 min., 55°C for 1 min., 72°C for 1 min.
and finally, 72°C for a final extension of 7 min.
Re-screening of primers that did not amplify at these
conditions was done by decreasing the annealing tem-
perature sequentially b y 1°C, and for the primers pro-
ducing multiple bands, by increasing the annealing
temperature by 1°C. The optimized SSR primers were
then used for PCR amplification in eight varieties of
pigeonpea. The PCR products were separated by elec-
trophoresis in 4% Metaphor agarose gels (Lonza,
Rockland ME USA) containing 0.1 μg/ml ethidium
bromide in 1x TBE buffer at 130 V for 4 h. After elec-
trophoresis, PCR products were visualized and photo-
graphed using gel documentation system Fluorchem™
5500 (Alfa Innotech Crop., USA). The TSA sequences
containing 550 SSRs were used for gene prediction using
gene finding software MolQuest (FGENESH+) [57]. The
position of SSRs was then analyzed for their exact location
in the gene with respect to the open reading frame. To
annotate the putative functions of the genes containing
550 validated SSRs, their unigene sequences were com-
pared by BLASTX tool of NCBI at a cutoff bit score of 50
against the non-redundant protein database.
SSR marker scoring and data analysis
The genotype profiles produced by SSR markers were
score d manually. Each allele was scored as present (1) or
absent (0) for each of the SSR loci. A total of 550 genic-
SSR markers giving consistent expected size products
were used for genotyping eight pigeonpea varieties; and 20
highly polymorphic loci of these were used for the diver-
sity analysis on 30 genotypes. Markers that produced
exp ected size of amplicons (100-200 bp) were sco red for
variation in amplicon size and the data analyzed for PIC
using the formula described by Botstein et al. [58].
PIC 1=−∑Pi
2
Where, Pi is the frequency of the i
th
allele in the set
of genotypes analyzed, calculated for each SS R locus.
The genetic similarity betwe en any two genotypes was
estimated based on Jaccard’ s similarity coefficient.
All the 30 genotypes were clustered with the UPGMA
analysis and SAHN procedure of the NTSYS-PC
v2.10t [59].
Additional material
Additional file 1: Frequency distribution of the pigeonpea genic-
SSR of different sizes. a. Unit length; b. Number of repeats; c. SSR
length.
Additional file 2: Frequency distribution of SSR loci with different
repeat motifs and number of repeats in the pigeonpea EST unigene
contigs. *Other 197 type of motifs out of total 207 motifs found in the
pigeonpea transcriptome consisted of varied combinations. S. no. 1-10
are most frequently occurring motifs.
Additional file 3: Details of 2877 genic-SSR markers in pigeonpea.
The SSR motif, number of repeats, sequence of forward and reverse
primers, annealing temperature and expected product size (bp) is
indicated
Additional file 4: Details of 550 validated pigeonpea genic-SSR
markers and predicted function of their genes based on BLASTX
search results. Sequence of forward and reverse primers, SSR repeat
motifs, annealing temperature, expected allele size (bp) and putative
gene function are indicated
Additional file 5: Cajanus cajan cultivars and wild relative species
used for the validation and genetic diversity study using genic-SSR.
*Interspecific derivative involving C. scarabaeoides; ** Interspecific
derivative involving C. cajanifolius; SD-Short duration; MD- Medium
duration; LD-Long duration; PR-Perennial
Acknowledgements
This study was financially supported by the Pigeonpea Genomics Initiative
(PGI) of the Indian Council of Agricultural Research (ICAR), New Delhi under
the framework of Indo-US Agricultural Knowledge Initiative (AKI).
Contribution of Doug Cook was supported by the National Science
Foundation (NSF), USA. GK acknowledges fellowship suppor t from
Department of Biotechnology, Government of India.
Author details
1
National Research Centre on Plant Biotechnology, Indian Agricultural
Research Institute, New Delhi 110 012, India.
2
Department of Molecular
Biology and Biotechnology, University of Kalyani, Kalyani, WB 741235, India.
3
Division of Genetics, Indian Agricultural Research Institute, New Delhi,
110012, India.
4
Indian Institute of Pulses Research, Kanpur, UP 208024, India.
5
Institute of Agricultural Sciences, Banaras Hindu University, Varanasi, UP
221005, India.
6
University of Agricultural Sciences, Dharwad, Karnataka
580005, India.
7
Panjabrao Deshmukh Krishi Vidyapeeth, Krishinagar, Akola,
Maharasthra 444 104, India.
8
International Crops Research Institute for the
Semi-Arid Tropics, Patancheru, AP 502324, India.
9
Department of Plant
Pathology, University of California, Davis, CA 95616-8680, USA.
Authors’ contributions
SD carried out RNA work, SSR mining and drafted the manuscript. SD, GK
and BPS performed genotyping of SSR markers. DKG and VD carried out
analysis of data generated by 454 GS-FLX sequencing. RR assembled the
genotype set and provided plant materials. NKS in consultation with TRS
and KG conceptualized the study, designed experiments and coordinated
the study. GS-FLX sequencing and Newbler assembly was outsourced from
Roche, Germany. GK, SS, SD, RR, MNS, BF, PK, RKV and DRC participated in
drafting the manuscript. NKS finalized the manuscript. All authors read and
approved the final manuscript.
Received: 29 April 2010 Accepted: 20 January 2011
Published: 20 January 2011
References
1. Greilhuber J, Obermayer R: Genome size variation in Cajanus cajan
(Fabaceae): a reconsideration. Plant Syst Evol 1998, 212:135-141.
2. FAOSTAT 2006. [].
3. Reddy BVS, Green JM, Bise SS: Genetic male sterility in pigeonpea. Crop
Sci 1978, 18:362-364.
4. Saxena KB, Wallis ES, Byth DE: A new gene for male sterility in pigeonpea
(Cajanus cajan (L.) Millsp.). Heredity 1983, 51:419-421.
5. Tikka SBS, Panwar LD, Chauhan RM: First report of cytoplasmic genic male
sterility in pigeonpea (Cajanus cajan (L) Millsp.) through wide
hybridization. GAU Res J 1997, 22:160-162.
Dutta et al. BMC Plant Biology 2011, 11:17
/>Page 11 of 13
6. Saxena KB, Kumar RV: Development of a cytoplasmic nuclear male
sterility system in pigeonpea using C. scarabaeoides (L.) thours. Ind J
Genet Plant Breed 2003, 63:225-229.
7. Wanjari KB, Patel MC: Fertility restorers isolated from germplasm for
cytoplasmic male sterility in pigeonpea. PKV Res J 2003, 27:111-113.
8. Saxena KB: Genetic improvement of pigeonpea–a review. Trop Plant Biol
2008, 1:159-178.
9. Varshney RK, Close TJ, Singh NK, Hoisington DA, Cook DR: Orphan legume
crops enter the genomics era. Curr Opin Plant Biol 2009, 12:202-210.
10. Varshney RK, Penmetsa RV, Dutta S, Kulwal PL, Saxena RK, Datta S,
Sharma TR, Rosen B, Carrasquilla-Garcia N, Farmer AD, Dubey A, Saxena KB,
Gao J, Fakrudin B, Singh MN, Singh BP, Wanjari KB, Yuan M, Srivastava RK,
Kilian A, Upadhyaya HD, Mallikarjuna N, Town CD, Bruening GE, He G,
May GD, McCombie R, Jackson SA, Singh NK, Cook DR: Pigeonpea
genomics initiative (PGI): an international effort to improve crop
productivity of pigeonpea (Cajanus cajan L.). Mol Breed 2009.
11. Ratnaparkhe MB, Gupta VS, Ven Murthy MR, Ranjekar PK: Genetic finger
printing of pigeonpea (Cajanus cajan (L.) Millsp.) and its wild relatives
using RAPD markers. Theor Appl Genet 1995, 91:893-898.
12. Choudhury PR, Singh IP, George B, Verma AK, Singh NP: Asessment of
genetic diversity of pigeonpea cultivars using RAPD analysis. Biologi
Planta 2008, 52(4):648-653.
13. Nadimpalli RG, Jarret RL, Phatak SC, Kochart G: Phylogenetic relationships
of the pigeonpea (Cajanus cajan) based on nuclear restriction fragment
length polymorphism. Genome 1994, 36:216-223.
14. Panguluri SK, Janaiah K, Govil JN, Kumar PA, Sharma PC: AFLP
fingerprinting in pigeonpea (Cajanus cajan (L.) Millsp.) and its wild
relatives. Genet Resour Crop Evol 2006, 53:523-531.
15. Yang S, Ash G, Harper J, Varling J, Wenzl P, Huttner E, Kilian A: Low level of
genetic diversity in cultivated pigeonpea compared to its wild relatives
is revealed by diversity arrays technology. Theor Appl Genet 2006,
113:585-595.
16. Burns MJ, Edwards KJ, Newbury HJ, Ford-Lloyd BV, Baggott CD:
Development of simple sequence repeat (SSR) markers for the
assessment of gene flow and genetic diversity in pigeonpea (Cajanus
cajan). Mol Ecol Notes 2001, 1:283-285.
17. Odeny DA, Jayashree B, Ferguson M, Hoisington D, Crouch J, Gebhardt C:
Development, characterization and utilization of microsatellite markers
in pigeonpea. Plant Breeding
2007, 126:130-136.
18.
Odeny DA, Jayashree B, Gebhardt C, Crouch J: New microsatellite markers
for pigeonpea (Cajanus cajan (L.) millsp.). BMC Research Notes 2009, 2:35.
19. Saxena RK, Prathima C, Saxena KB, Hoisington D, Singh NK, Varshney RK:
Novel SSR markers for polymorphism detection in pigeonpea (Cajanus
spp.). Plant Breed 2010, 129:142-148.
20. Raju NL, Gnanesh BN, Lekha P, Jayashree B, Pande S, Hiremath PJ,
Byregowda M, Singh NK, Varshney RK: The first set of EST resource for
gene discovery and marker development in pigeonpea (Cajanus cajan
L.). BMC Plant Biology 2010, 10:45.
21. Varshney RK, Graner A, Sorrells ME: Genic microsatellite markers in plants:
features and applications. Trends Biotechnol 2005, 23:48-55.
22. Scott KD, Eggler P, Seaton G, Rossetto M, Ablett EM, Lee LS, Henry RJ: Analysis
of SSRs derived from grape ESTs. Theor Appl Genet 2000, 100:723-726.
23. Yu JK, La Rota M, Kantety RV, Sorrells ME: EST derived SSR markers for
comparative mapping in wheat and rice. Mol Genet Genomics 2004,
271:742-751.
24. Luro FL, Costantino G, Terol J, Argout X, Allario T, Wincker P, Talon M,
Ollitrault P, Morillon R: Transferability of the EST-SSRs developed on Nules
clementine (Citrus clementina Hort ex Tan) to other Citrus species and
their effectiveness for genetic mapping. BMC Genomics 2008, 9:287.
25. Singh H, Deshmukh RK, Singh A, Singh AK, Gaikwad K, Sharma TR,
Mohapatra T, Singh NK: Highly variable SSR markers suitable for rice
genotyping using agarose gels. Mol Breeding 2010, 25:359-364.
26. BatchPrimer3. [ />batchprimer3.cgi].
27. You FM, Huo N, Gu YQ, Luo MC, Ma Y, Hane D, Lazo GR, Dvorak J,
Anderson OD: BatchPrimer3: A high throughput web application for PCR
and sequencing primer design. BMC Bioinformatics 2008, 9:253.
28. Temnykh S, DeClerck G, Lukashova A, Lipovich L, Cartinhour S, McCouch SR:
Computational and experimental analysis of microsatellites in rice (Oryza
sativa L.): frequency, length variation, transposon associations, and
genetic marker potential. Genome Res 2001, 11(8):1441-1452.
29. Singh NK, Dalal V, Batra K, Singh BK, Chitra G, Singh A, Ghazi IA, Yadav M,
Pandit A, Dixit R, Singh PK, Singh H, Koundal KR, Gaikwad K, Mohapatra T,
Sharma TR: Single-copy genes define a conserved order between rice
and wheat for understanding differences caused by duplication,
deletion, and transposition of genes. Funct Integr Genomics 2007, 7
:17-35.
30.
Varshney RK, Nayak SN, May GD, Jackson SA: Next-generation sequencing
technologies and their implications for crop genetics and breeding.
Trends Biotechnol 2009, 27:522-530.
31. Margulies M, Egholm M, Altman WE, Attiya S, Bader JS, Bemben LA, Berka J,
Braverman MS, Chen Y, Chen Z, et al: Genome sequencing in
microfabricated high-density picolitre reactors. Nature 2005, 437:376-380.
32. Emrich SJ, Barbazuk WB, Li L, Schnable PS: Gene discovery and annotation
using LCM-454 transcriptome sequencing. Genome Res 2007, 17:69-73.
33. Roy SW, Penny D, Neafsey DE: Evolutionary conservation of UTR intron
boundaries in Cryptococcus. Mole Bio and Evol 2007, 24(5):1140-1148.
34. Varshney RK, Grosse I, Hahnel U, Siefken R, Prasad M, Stein N, Langridge P,
Altschmied L, Graner A: Genetic mapping and BAC assignment of EST-
derived SSR markers shows nonuniform distribution of genes in the
barley genome. Theor Appl Genet 2006, 113:239-250.
35. Cloutier S, Niu Z, Datla R, Duguid S: Development and analysis of EST-
SSRs for flax (Linum usitatissimum L.). Theor Appl Genet 2009, 119:53-63.
36. Aggarwal RK, Hendre PS, Varshney RK, Bhat PR, Krishnakumar V, Singh L:
Identification, characterization and utilization of EST-derived genic
microsatellite markers for genome analyses of coffee and related
species. Theor Appl Genet 2007, 114:359-372.
37. Peng JH, Lapitan NL: Characterization of EST-derived microsatellites in
the wheat genome and development of eSSR markers. Funct Integr
Genomics 2005, 5:8-96.
38. Cardle L, Ramsay L, Milbourne D, Macaulay M, Marshall D, Waugh R:
Computational and experimental characterization of physically clustered
simple sequence repeats in plants. Genetics 2000, 156:847-854.
39. Fraser LG, Harvey CF, Crowhurst RN, De Silva HN: EST derived
microsatellites from Actinidia species and their potential for mapping.
Theor Appl Genet 2004, 108:1010-1016.
40. Gong L, Stift G, Kofler R, Pachner M, Lelley T: Microsatellites for the genus
Cucurbita and an SSR-based genetic linkage map of Cucurbita pepo L.
Theor Appl Genet 2008, 117:37-48.
41. Rungis D, Berube Y, Zhang J, Ralph S, Ritland CE, Ellis BE, Douglas C,
Bohlmann J, Ritland K: Robust simple sequence repeat markers for spruce
(Picea spp.) from expressed sequence tags. Theor Appl Genet 2004,
109:1283-1294.
42. Xu Y, Ma RC, Xie H, Liu JT, Cao MQ: Development
of SSR markers for the
phylogenetic analysis of almond trees from China and the
Mediterranean region. Genome 2004, 47:1091-1104.
43. Thiel T, Michalek W, Varshney RK, Graner A: Exploiting EST databases for
the development and characterization of gene derived SSR-markers in
barley (Hordeum vulgare L.). Theor Appl Genet 2003, 106:411-422.
44. La Rota M, Kantety RV, Yu JK, Sorrells ME: Nonrandom distribution and
frequencies of genomic and EST-derived microsatellite markers in rice,
wheat, and barley. BMC Genomics 2005, 6:23.
45. Chen C, Zhou P, Choi YA, Huang S, Gmitter FG Jr: Mining and
characterizing microsatellites from citrus ESTs. Theor Appl Genet 2006,
112:1248-1257.
46. Han ZG, Guo WZ, Song XL, Zhang TZ: Genetic mapping of EST-derived
microsatellites from the diploid Gossypium arboretum in allotetraploid
cotton. Mol Genet Genomics 2004, 272:308-327.
47. Hisano H, Sato S, Isobe S, Sasamoto S, Wada T, Matsuno A, Fujishiro T,
Yamada M, Nakayama S, Nakamura Y, Watanabe S, Harada K, Tabata S:
Characterization of the soybean genome using EST-derived
microsatellite markers. DNA Res 2007, 14:271-281.
48. Yu JK, Dake TM, Singh S, Benscher D, Li W, Gill B, Sorrells ME: Development
and mapping of EST-derived simple sequence repeat (SSR) markers for
hexaploid wheat. Genome 2004, 47:805-818.
49. Cordeiro GM, Casu R, McIntyre CL, Manners JM, Henry RJ: Microsatellite
markers from sugarcane (Saccharum spp.) ESTs cross transferable to
Erianthus and Sorghum. Plant Sci 2001, 160:1115-1123.
50. Chabane K, Ablett GA, Cordeiro GM, Valkounn J, Henry RJ: EST versus
genomic derived microsatellite markers for genotyping wild and
cultivated barley. Genetic Resources Crop Evol 2005, 52:903-909.
51. Cho YG, Ishii T, Temnykh S, Chen X, Lipovich L, McCouch SR, Park WD,
Ayres N, Cartinhour S: Diversity of microsatellites derived from genomic
Dutta et al. BMC Plant Biology 2011, 11:17
/>Page 12 of 13
libraries and GenBank sequences in rice (Oryza sativa L.). Theor Appl
Genet 2000, 100:713-722.
52. Eujayl I, Sorrells M, Baum M, Wolters P, Powell W: Assessment of genotypic
variation among cultivated durum wheat based on EST-SSRs and
genomic SSRs. Euphytica 2001, 119:39-43.
53. Yu K, Park SJ, Poysa V, Gepts P: Integration of simple sequence repeat
(SSR) markers into a molecular linkage map of common bean (Phaseolus
vulgaris L.). Am Genet Assoc 2000, 91:429-434.
54. Ammiraju J, Lu Fei, Sanyal A, Yu Y, Song X, Jiang N, Pontaroli AC, Rambo T,
Currie J, Collura K, Talag J, Fan C, Goicoechea JL, Zuccolo A, Chen J,
Bennetzen JL, Chen M, Jackson S, Winga RA: Dynamic evolution of Oryza
genomes is revealed by comparative genomic analysis of a genus-wide
vertical data set. The Plant Cell 2008, 20:3191-3209.
55. Azevedo H, Lino-Neto T, Tavares RM: An improved method for high-
quality RNA isolation from needles of adult maritime pine trees. Plant
Mol Biol Reporter 2003, 21:333-338.
56. Murray MG, Thompson WF: Rapid isolation of high molecular weight
plant DNA. Nucleic Acid Res 1980, 8:4321-4325.
57. MolQuest. [].
58. Botstein D, White RL, Skolnick M, Davis RW: Construction of a genetic
linkage map in man using restriction fragment length polymorphism.
Am J Hum Genet 1980, 32:3.
59. Rolf JF: NTSYS-PC. Numerical Taxonomy and Multivariate Analysis
System, version 2.11T Exeter Software. Setauket, NY, USA 2000.
doi:10.1186/1471-2229-11-17
Cite this article as: Dutta et al .: Development of genic-SSR markers by
deep transcriptome sequencing in pigeonpea [Cajanus cajan (L.)
Millspaugh]. BMC Plant Biology 2011 11:17.
Submit your next manuscript to BioMed Central
and take full advantage of:
• Convenient online submission
• Thorough peer review
• No space constraints or color figure charges
• Immediate publication on acceptance
• Inclusion in PubMed, CAS, Scopus and Google Scholar
• Research which is freely available for redistribution
Submit your manuscript at
www.biomedcentral.com/submit
Dutta et al. BMC Plant Biology 2011, 11:17
/>Page 13 of 13