báo cáo khoa học: " The development and geometry of shape change in Arabidopsis thaliana cotyledon pavement cells" doc
Bạn đang xem bản rút gọn của tài liệu. Xem và tải ngay bản đầy đủ của tài liệu tại đây (2.81 MB, 13 trang )
RESEARCH ARTICLE Open Access
The development and geometry of shape change
in Arabidopsis thaliana cotyledon pavement cells
Chunhua Zhang
1
, Leah E Halsey
1
, Daniel B Szymanski
1,2*
Abstract
Background: The leaf epidermis is an important architectural control element that influences the growth
properties of underlying tissues and the overall form of the organ. In dicots, interdigitated pavement cells are the
building blocks of the tissue, and their morphogenesis includes the assembly of specialized cell walls that surround
the apical, basal, and lateral (anticlinal) cell surfaces. The microtubule and actin cytoskeletons are highly polarized
along the cortex of the anticlinal wall; however, the relationships between these arrays and cell morphogenesis are
unclear.
Results: We developed new quantitative tools to compare population-level growth statistics with time-lapse
imaging of cotyledon pavement cells in an intact tissue. The analysis revealed alternating waves of lobe initiation
and a phase of lateral isotropic expansion that persisted for days. During lateral isotropic diffuse growth,
microtubule organization varied greatly between cell surfaces. Parallel microtubule bundles were distributed
unevenly along the anticlinal surface, with subsets marking stable cortical domains at cell indentations and others
clearly populating the cortex within convex cell protrusions.
Conclusions: Pavement cell morphogenesis is discontinuous, and includes punctuated phases of lobe initiation
and lateral isotropic expansion. In the epidermis, lateral isotropic growth is independent of pavement cell size and
shape. Cortical microtubules along the upper cell surface and stable cortical patches of anticlinal microtubules may
coordinate the growth behaviors of orthogonal cell walls. This work illustrates the importance of directly linking
protein localization data to the growth behavior of leaf epidermal cells.
Background
The elaboration of b lade shaped organs is a common
morphological process in the plant kingdom. It is also
quite plastic. Developmental gradients and environmen-
tal inputs can generate highly variable leaf shapes over
the lifespan of the plant [1,2]. An important challenge is
to understand the complex interplay of cell number and
the geometry of cell growth at regional scales that can
dictate the spatial patterns of organ formation [3]. In
the leaf, the epidermis is an important architectural con-
trol element. Genetic mosaics indicate that the genotype
of the epidermis has a major impact on the growth
properties of und erlying tissues and the overall form of
the organ [4-6]. Therefore, the morphogenesis of epider-
mal pavement cells is of particular interest. As in other
tissues, both cell division and irreversible cell expansion
in the ep idermis contribute to tissue morphology. How-
ever, cell size increase is the dominant factor during
organ expansion. For example, epidermal pavement cells
in the dicot Arab idopsis thal iana undergo multiple
rounds of endoreduplication [7], and simultaneously
increase in cell volume by almost 2 orders of magnitude
compared to their protodermal precursors [8-11]. As
pavement cells increase in size they remain highly
vacuolated, and the thickness of the cell wall does not
increase significantly [8,10]. Therefore pavement cell
size increase is true cell g rowth that includes the
balanced synthesis of new vacuole, plasma membrane,
and cell walls. Unlike animal cells [12], the shape
changes of plant cells during cell growth are defined b y
the mechanical properties of the cell wall [13,14]. In the
epidermis, the thick external cell wall impedes expan-
sion perpendicular to the leaf surface [15]; consequently
* Correspondence:
1
Department of Agronomy, Purdue University, West Lafayette, Indiana 47907-
2054, USA
Full list of author information is available at the end of the article
Zhang et al. BMC Plant Biology 2011, 11:27
/>© 2011 Zhang et al; licensee BioMe d Central Ltd. This is an Open Access article distri buted under the terms of the Creative Commons
Attribution License (http://creative commons.org/licenses/by/2.0), which permits unrestricted use, distribution, and reproduction in
any medium, provided the original work is properly cited.
cell size increase occurs preferentially within the plane
of the epidermis.
Pavement cell expansion in the lateral dimension often
occurs in a sinusoidal pattern, generating highly interdi-
gitated cells [16]. The striking undulation of the cell
wall is widespread in the plant kingdom and is not lim-
ited to epidermal cell types. For example, in the fern
Adiantum capillus-veneris, leaf mesophyll cells that are
in physical contact with one another initiate lobes that
are in d irect opposition [17]. Polar ized expansion of the
opposing lobes generates air spaces between cells that
facilitate efficient gas exchange between the plant and
the environment. In the epidermis adjacent pavement
cells initiate protrusions that are offset from one
another. The subsequent pattern of cell expansion gen-
erates an interdigitated, mechanically stabilized tissue.
There is a correlation between the occurrence of loca-
lized anticlinal (perpendicular to the l eaf surface) micro-
tubule bundles (AMBs) and the presence of cell
indentations that form a local concave shape [18-21]. In
concave regions of the growing pavement cells there
also is a correlation between the location of A MBs and
the presence of dense pads of cellulose microfibrils at
the interface of the anticlinal and outer periclinal (paral-
lel to the le af surface) cell walls [17]. This activity is sig-
nificant because cellulose microfibrils are the primary
load-bearing polymer in the plant cell wall and their
pattern of deposition at the plasma membrane is dic-
tated by cortical microtubules [22-24]. However, the
morphogenesis of lobed cells is complicated and
includes many cellular activities in addition to those
that directly affect cellulose deposition. For example,
mutations that affect the actin cytokeleton, targeted
vesicle secretion, and non-cellulosic components of the
extracellular matrix cause pavement cell growth defects
[rev. in: [16,25]].
Despite genetic and ultrastructural descriptions of
pavement cell growth there is still very little clear
knowledge about the geometry and cellular dynamics
of pavement cell shape change. Current models of the
growth process are varied, and are deriv ed from static
images collected from populations of cells. Some mod-
els propose that pavement cell growth includes
sequential phases o f cell expansion along the proximo-
distal and lateral leaf axes [9], with selective expansion
in lobes driving cell expansion primarily in the lateral
dimension [26]. Other models propose a continuous
and iterative lobe initiation process during cell mor-
phogenesis [20,27]. The role of AMBs in the epidermal
tissue is also unclear. These specialized microtubule
zones are presumed to direct the synthesis of oriented
cellulose microfibrils. Based on ROP small GTPase and
AMB localization in cells that had a lobed morphology,
it was hypothesized that localized synthesis of parallel
arrays of cellulose microtubules in the anticlinal wall
locally restricts protrusive growth perpendicular to the
cellulose microfibril network, initiates lobe formation,
and promotes polarized lobe expansion [rev. in:
[16,26,27]]. The analogy to the restriction o f radial
expansion of cylindrical cells is valid for pavement
cells only if parallel arrays of microfibrils in the anticli-
nal wall extend into the periclinal wall. In addition, the
restricted growth model cannot explain persistent
interdigitating growth during which the protrusive
(convex geometry) growth of one cell must be accom-
modated by the complimentary growth of the concave
indentation of the neighboring cell. The model above
also does not account for the detection of AMBs
within the lobes of cotyledon pavement cells [20],
which is presumed to be a subcellular domain o f accel-
erated growth [26,27].
In this paper we take advantage of the developmental
synchrony and simplicity of cotyledon development to
monitor the microtubule organization and cell shape
changes that occur during pavement cell morphogenesis.
Time series imag es of cotyledon pavement cells and the
use of fiduciary extracellular marks reveal distinct
phases of lobe initiation and subsequent uniform cell
expansion in the plane of the epidermis. Our microtu-
bule localization experiments during the lateral isotropic
growth phase confirm previous reports of clustered anti-
clinal microtubules along cell indentations [16,26,28]
and within lobes [20]. In this paper we demonstrate that
asymmetric patterns of cortical microtubules persist for
days, but are not necessarily associated with polarized
growth.
Results
We began our analysis of pavement cell morphogenesis
by analyzing the shape and growth properties of popula-
tions of cells at the early cell expansion phase (2 days
after germination (DAG)), rapidly expanding cells
(5 DAG), and fully expanded cells (12 and 18 DAG
cotyledons) in which growth had ceased [20]. At each
time po int, cells i n the apical 1/3 of the cotyledon were
visualized with the lipid-binding dye FM4-64 and
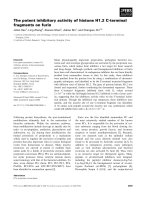
sampled as described previously [29]. Example images of
fields of pavem ent cells from each time point are shown
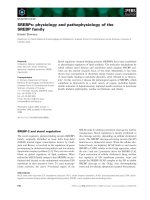
in Figure 1.
Pavement cell shape became more complex over time.
Circularit y is a dimensionless shape factor based on the
perimeter:area ratio that is normalized to a value of 1
for a circle [30]. As the complexity of the shape
increases, the circularity value decreases. During cotyle-
don development the complexity of pavement cell shape
clearly increased and was significantly different when 2
and 5 DAG cells were compared and when 5 and 12
DAG cells were compared (Table 1). As expected the
Zhang et al. BMC Plant Biology 2011, 11:27
/>Page 2 of 13
non-growing 12 and 18 DAG cells were not significantly
different for this, or any other shape descriptor. Lobe
formation and cell growth appear to drive cell shape dis-
tortion. One way to objectively estimate lobe formation
in a cell is t o calculate a midline skeleton of an i ndivi-
dual cell [11]. The mean number of skeleton tips
approximately doubled from 2 to 12 DAG (Table 1) and
were significantly different between growing cells at the
different time points. However, the timing and extent of
lobe formation is not clear from this analysis because
small and broad symmetrical protrusions are often not
detected with this technique (Figure 1, lower panels).
In order t o unders tand more precisely the shape tran-
sitions that occur in developing pavement cells, we col-
lected images of the same field of cells at two different
time points. The irreversible nature of plant cell growth
eliminates the complexity of cell retraction, and greatly
simplified our search for lobe initiation events. We
began by looking for evidence of lobe initiation in pave-
ment cells during the 3 to 5 DAG interval. In 3 different
Figure 1 Visualization and sampling criteria for cotyledon pavement cells at different time points after germination. Fields of cotyledon
epidermal cells stained with FM4-64 and subjected to simple morphometric analyses. Top row, left to right, fields of 2, 5, and 12 DAG cotyledon
epidermal cells stained with FM4-64. Middle row: Same fields as top row showing the sampling scheme for cell measurements of complete cells
that intersect a diagonal transect across the image field. Bottom row: example cells from each time point that were digitally dissected from the
field, thresholded, and skeletonized. Bar = 100 μm.
Table 1 Size and geometry of pavement cells at different stages of cotyledon development
Age (DAG) Area (μm
2
) Perimeter (μm) Circularity Number of Skeleton Ends Growth Rate (%/hour)
2 (N = 41) 2169 ± 597
(1)
279 ± 66
(2)
0.35 ± 0.08
(3)
8±2
(4)
5 (N = 44) 3756 ± 1973 401 ± 175 0.30 ± 0.09 11 ± 4 1.02 ± 0.53
(5)
12 (N = 43) 16160 ± 4434 1181 ± 278 0.15 ± 0.05 18 ± 4 1.97 ± 0.54
(6)
18 (N = 35) 15399 ± 4476 1070 ± 253 0.17 ± 0.04 15 ± 4 No growth
(7)
(1),(2),(3),(4)
Mean ± SD.
(5)
Mean ± SD, Growth rate from 2 DAG to 5 DAG.
(6)
Growth rate from 5 DAG to 12 DAG.
(7)
Growth rate from 12 DAG to 18 DAG.
The parameters of cell area, perimeter, circularity and number of skeleton ends are significantly different between 2 DAG and 5 DAG cells (t-test, p < 0.05). These
parameters are significantly different between 5 DAG and 12 DAG cells as well (t-te st, p < 0.05). These parameters are not significantly different between 12 DAG
and 18 DAG cells.
Zhang et al. BMC Plant Biology 2011, 11:27
/>Page 3 of 13
fields of pavement cells from 3 different cotyledons we
found no evidence for lobe initiation (Table 2). In every
example, lobes in 5 DAG cells could be traced back to
local regions of curvature in the corresponding region of
the 3 DAG cells. We exten ded our search window for
lobe initiation to the 3 to 7 DAG growth interval, and
of the 21 cells examined, we found only 1 lobe initiation
event (Table 2 ). We found that lobe initiation was very
common at earlier s tages, because of the 28 cells that
were imaged at 2 and 5 DAG, 17 underwent an obvious
boundary transition from a linear segment to one that
had at least one and often several newly formed protru-
sions. These data indicate that in deve loping cotyledons
there are at least 2 distinct phases of pavement cell
morphogenesis: an early phase during which polarized
lobe initiation and asymmetric growth is prevalent and a
subsequent phase of persistent growth during which an
established cell shape appears to influence the growth
pattern.
Because most of the cotyledon area is generated dur-
ing the latter growth phase [20], we sought to better
understand the cell shape transitions that occurred
within this interval. During this phase both cell shape
and microtubule organization were detected using the
well-characterized and non-toxic GFP:TUB6-expressing
line [31]. As an alternative to static population level
measurements, we imaged the same fields of cells at 3
DAG and again at 5 DAG. Neither the reporter nor our
imaging protocols noticeably affected the growth,
because the average growth rates of the cells imaged
during time lapse (Table 3) wereverysimilartorates
calculated from the mean values of developmen tally
staged cells (Table 1). In 3 DAG cells the microtubules
along the cortex of the apical surface internal to the
periclinal wall (hereafter referred to simply as the peri-
clinal) adopted different configurations. In many cases,
such as those seen in cells 4, 7, and 8 (Figure 2A), the
microtubules displayed a parallel alignment. However,
the orientations of the periclinal microtubule networks
varied among cells within the field; e.g. compare cells 4,
6, and 7 (Figure 2A). In other cells, the microtubules
had mixed orientations (Figure 2A, cells 5 and 9).
In many lobed cell types, parallel arrays of AMBs are
distributed unevenly along the cell perimeter and are
thought to have a strong influence on the morphogen-
esis process [19,20,26,27]. In both 3 and 5 DAG cells,
many but not all cell indentation s corre sponded to si tes
where periclinal microtubules coalesced with clearly
resolved AMBs (Figure 2A,F). A region from a confocal
image of two such indentations was digitally resliced to
examine the AMBs in xz and yz views (Figure 2B,D,G,
and 2I). The AMBs had a clear parallel alignment, and
intensity profiles across the region demonstrated our
ability to resolve distinct microt ubule structur es (Figure
2C,E,H and 2J) . Although the lifetime of individual bun-
dles was not measured, specific domains of the cortex of
individual cells were populated by AMBs over a 2 day
period. For example, cort ical domains inside the anticli-
nal wall that were populated by AMBs at 3 DAG were
also enriched in AMBs at the 5 DAG time point. At 5
DAG, the AMBs had increased in number and occupied
a more extended domain of the cortex (Figure 2C,E,H,
and 2J). Although zones populated by anticli nal bundles
persisted for days, the closely associated microtubule
network on the periclinal cell surface was obviously
reorganized during the same growth interval. For exam-
ple, in the inset, red-boxed region of cell 4, many micro-
tubules coalesced at or emanated from an indentation
(Figure 2A, inset), but at 5 DAG the periclinal microtu-
bules in the same region had no clear pattern (Figure
2F, inset).
Table 2 Lobe initiations and splits at different time
points during cotyledon pavement cell development
Time
Interval
Cells with
lobe
initiation
Total cells
counted
Total
cells
% of cells
with
lobe initiation
2-5 DAG 17 28 (N = 4)
(1)
28 60.7
3-5 DAG 0 17 (N = 3) 17 0
3-7 DAG 1 22 (N = 5) 22 4.5
(1)
Number of cotyledons observed.
Table 3 Linear regression analysis of cell area, perimeter and single segment changes from 3 DAG to 5 DAG using
time-lapse images
Field R
2
(area)
(1)
R
2
(perimeter) R
2
(segments) IF (%)
(2)
Growth rate (%/hour)
(3)
1 (N = 6) 0.999 0.999 0.963 ± 0.030
(4)
91 ± 3
(5)
1.89 ± 0.26
(6)
2 (N = 4) 0.998 0.996 0.991 ± 0.007 89 ± 4 1.11 ± 0.18
3 (N = 5) 0.975 0.992 N.D.
(7)
88 ± 2 1.42 ± 0.24
(1)
R
2
represents the R-squared values in linear regression analysis of surface area, cell perimeter, and anticlinal wall segment lengths plotted for populations of
cells at 3 and 5 DAG. All p values are smaller than 0.01 during regression analysis.
(2)
IF: Isotropy Factor is calculated as the overlap between digitally isotropically amplified 3 DAG cells and the real cell imaged at 5 DAG.
(3)
Growth rate was calculated as ((5 DAG area - 3 DAG area)/(3 DAG area * 48))*100%.
(4), (5) , (6)
Mean ± SD.
(7)
N.D. Not determined.
Zhang et al. BMC Plant Biology 2011, 11:27
/>Page 4 of 13
Although AMBs at i ndentations figure prominently in
models for pavement cell shape control [16,27], similar
structures have been reported in the tips of expanding
lobes in fixed cells [20]. In fields of cells expressing
GFP:TUB6 it is difficult to distinguish the anticlinal
bundles in the protrusion of one cell from those that
are present along the indentation of a neighboring cell.
To overcome this problem we used two different label-
ing techniques to localize m icrotubules in subsets of
pavement cells in the c otyledon epidermis. In fixed
whole-mounted cotyledons that were subjected to freeze
shattering f or cell wall disruption, AMBs were detected
along indentations and were also frequently localized
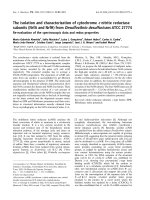
within the lobes of 3 DAG pavement cells (Figure 3A).
In a live cell assay, bombardment of the GFP:TUB6 into
individual cotyledon pavement cells frequently revealed
AMBs both at indentations and within the tips
and flanks of expanding lobes (Figure 3B). Of the 17
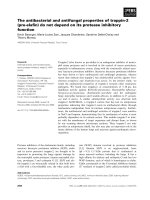
Figure 2 Reorganization of GFP:TUB6 labeled cortical microtub ule arrays in actively expanding cotyledon pavement cells. (A) to (E)
Image and analysis of a field of pavement cells at 3 DAG (A) Maximum projection of the upper half of adaxial epidermal cells. Cells of interest
are numbered. White inset box: higher magnification view of the periclinal surface in the red-boxed region of cell 4. (B) XZ view of the anticlinal
wall of the region boxed in green in panel (A). (C) Fluorescent intensity values scanned along the horizontal line indicated in panel (B). (D) YZ
view of the anticlinal wall of the region boxed in red in panel (A). (E) Fluorescent intensity values scanned along the horizontal line indicated in
panel (D). (F) to (J) The same pavement cells in (A) to (E) analyzed again at 5 DAG. (F) Maximum projection of the upper half of adaxial
epidermal cells. Cells of interest are numbered. White inset box: higher magnification view of the periclinal surface in the red-boxed region of
cell 4. (G) XZ view of the anticlinal wall of the region boxed in green in panel (F). (H) Fluorescent intensity values scanned along the horizontal
line indicated in panel (G). (I) YZ view of the anticlinal wall of the region boxed in red in panel (F). (J) Fluorescent intensity values scanned
along the horizontal line indicated in panel (I). Bar = 10 μm.
Zhang et al. BMC Plant Biology 2011, 11:27
/>Page 5 of 13
GFP:TUB6 expressing 3 and 4 DAG pavement cells, 16
had anticlinal microtubules and/o r microtubule bundles
within one or more lobes. Therefore anticlinal microtu-
bules are common features of expanding lobes, and
models that consider the growth dynamics of lobes to
be controlled solely by the actin cytoskeleton may need
refinement [21,26,27,32].
We wanted to relate the microtubule array org aniza-
tion in the live cell imaging experiments (Figure 2) to
the corresponding cell shape changes that occurred.
Therefore, we quantitated the size and sha pe transitions
that occurred in these cells (Figure 4). The external
faces of pavement cells have thick cell walls that counter
a strong turgor force and limit cell bulging out from the
epidermal plane [15]. The cellulose microfibrils in the
external face of the pavement cell are randomly oriented
and embedded in a wall matrix that displays high levels
of xyloglucan endotransglycosylase (XET) activity that
may enable wall rearrangement and lateral cell expan-
sion [33]. Therefore, we measured the periclinal sur face
areas and lateral growth from 3 independent popula-
tions of digitally dissected 3 and 5 DAG cells. For each
field (Figure 4A and 4B) the surface area measurements
of the 3 and 5 DAG cells were plotted and subjected to
linear regression analysis (Figure 4C, Table 3). In all
three fields, the cell area measurements defined a
straight line, and the modeled linear equation explained
between 97.5 to 99.0% of the variation (Table 3). This
linear relationship indicated that when expansion rates
are calculate d relative to initi al cell area , pavement cells
within the imaging field increased in surface area at the
same rate. This g rowth behavior is expected if stable
physical connections are maintained as neigh boring cells
increase in size using a diffuse or intercalary growth
mechanism.
Similar relative growth rates were observed among the
cells despite their very different shapes (Figure 4A-C).
This implied that growth rate was independent of shape.
As an initial test o f this ideaweanalyzedthegrowth
behavior of individual cell segments along the perimeter
of the anticlinal wall. We used three-way cell wall junc-
tions as fiduciary marks to identif y equivalent cell seg-
ments in the 3 and 5 DAG cells. The results for one cell
areshowninFigure4Dto4F,andtheanalysiswas
completed for 10 different cells from fields sampled
from 2 different cotyledons (Table 3). In general, the
perimeter segments were of varying lengths and shapes.
Some contained multiple lobes (Figure 4 D,E, segment
4), and others defined relatively straight lines (Figure
4D,E, segment 6). T he segment lengths for cells within
each field were plotted and subjected to linear
Figure 3 Localization of anticl inal microtubules withi n the
expanding pavement cell lobes. (A) Microtubules in a single fixed
cell dete cted using freeze shattering and immunolocali zation.
Regions of interest in are labeled a’ xy view and b’ xy view. Insets
are projections of the xz and yz views of subregions a ’ and b’,
respectively. *, indicates the locatio n of the adaxial periclina l
surface of the cell in the xz and yz views. (B) Microtubules in a
living pavement cell detected using microproject ile bombardment
of the GFP:TUB6 expression construct. Regions of interest are
labeled c’ xy view and d’ xy view. Insets are projecti ons of the yz
and xz views of s ubregions c’ and d’, respectively. *, indicat es the
location of the adaxial periclinal surface of the cell in the yz and
xz views. Bar = 10 μm.
Zhang et al. BMC Plant Biology 2011, 11:27
/>Page 6 of 13
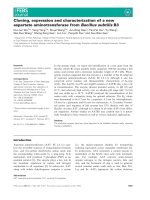
Figure 4 Equal growth rates and isotropic lateral expansion of the cotyledon epidermal cells. (A) to (B) Cell outlines of fields of 3 DAG
(A) and 5 DAG (B) pavement cells used for GFP:TUB6 localization in Figure 2A and Figure 2F, respectively. (C) Plot of surface areas at 3 DAG (x-
axis) and 5 DAG (y-axis). The points are labeled according to the corresponding cell that is numbered in (A) and (B). (D) to (F) Perimeter
segments of individual cells elongate at equal rates that are independent of shape. (D) and (E) segments of cell 4 at 3 DAG and 5 DAG
respectively. The white bars indicate the position of three-way cell wall junctions. (F) Plot of cell segment lengths for cell 4 at 3 DAG (x-axis) and
5 DAG (y-axis). (G) to (R) Shape change during the cell expansion phase of cotyledon development is mostly explained by isotropic expansion.
(G) Thresholded image indicating the shape and size of cell 1 at 3 DAG. (H) Image of (G) magnified by 1.42. (I) Thresholded image of cell 1 at 5
DAG. (J) Overlay of (H) and (I). (K) Thresholded image indicating the shape and size of cell 6 at 3 DAG. (L) Image of (K) magnified by 1.37. (M)
Thresholded image of cell 6 at 5 DAG. (N) Overlay of (L) and (M). (O) Thresholded image indicating the shape and size of cell 4 at 3 DAG. (P)
Image of (O) magnified by 1.31. (Q) Thresholded image of cell 4 at 5 DAG. (R) Overlay of (P) and (Q). Yellow represents regions of overlap, red
indicates non-overlapping regions of the magnified image, and green indicates the non-overlapping regions of the real 5 DAG cell. The dashed
lines indicate the expected behavior of non-growing cells (C) or segments (F). Bar = 10 μm
Zhang et al. BMC Plant Biology 2011, 11:27
/>Page 7 of 13
regression analysis (Figure 4F). If there was any signifi-
cant warping or unequal growth among the segments
we would observe scattered data points. To the contrary,
the cell segment length data fit well to a linear model.
Mean R
2
values from the two fields of cells were 0.96
and 0.99 (Table 3). Example images, fiduciary marks,
and plots for the cells in field 2 (Table 3) are shown in
Additional file 1. Therefore at the resolution of our fidu-
ciary marks, the relative ce ll perimeter increases occur
at equal rates along the cell perimeter and are indepen-
dent of the contour of the particular perimeter segment.
The anticlinal wall at three-way cell junctions also
expanded perpendicular to the cell surface; however, the
growth behavior in this direction was very different
from that observed for lateral growth. Based on many
plots of cell wall height during the 3 to 5 DAG growth
interval, the growth increments were variable at differ-
ent positions along the cell perimeter and were not
related to the initial cell height. As a result, the plots
did not show a linear relationship (Figure 5).
Visual comparisons of individual pavement cells at 3
and 5 DAG made it seem impossible that uniform cell
growth restricted to the cell periphery could explain the
observed shape transitions from 3 to 5 DAG cells. We
tested an alternative growth model of uniform lateral
isotropic expansion of periclinal cell wall surfaces by
digitally magnifying the thresholded image of a 3 DAG
cell (Figure 4G,K and 4O) by a constant so that its final
area (Figure 4H,L and 4P) was equal to the measured
area for that same cell at 5 DAG (Figure 4I,M and 4Q).
The digitally magnified cell was rotated to maximize the
overlap of the magnified image with the real 5 DAG
cell. An overlay of the 2 images (Figure 4J,N and 4R)
was used to measure the ratio of overlapping pixels
(Figure 4J,N and 4R, yellow) to the total number of pix-
els for the real 5 DAG cell (Figure 4J,N and 4R, green).
This ratio, which can be interpreted as an “isotropy fac-
tor”, would be equal to 1 if the overlap was perfect. In
three independent fields o f pavement cells, the mean
isotropy factor ranged from 0.88 to 0.91 (Table 3).
The extent of isotropic lateral growth was indepen-
dent of cell size, because small (cell 1, Figure 4G-J),
medium (cell 6, Figure 4K-N), and large (cell 4, Figure
4O-R) cells at the 3 DAG time point had very similar
isotropy factors. An isotropy factor value less than 1
could be caused by human error during the digital cell
dissection protocol. To characterize this error, 6 cell
images were repetitively dissected, digitally magnified,
and the overlap between all possible cell pairs was cal-
culated. For the repeat dissections, the measured overlap
value of 0.97 ± .01 (mean ± SD, n = 6) was close to the
expected complete overlap. The ~3% error in dissection
accuracy cannot explain the isotropy factor values calcu-
lated for growing cells (Table 3). Using time-lapse
images, we also analyzed the circularity v alues for cells
at 3 and 5 DAG. The mean circularity values of 3 (0.26
± 0.08, mean ± SD, N = 15) and 5 (0.24 ± 0.08, mean ±
SD, N = 15) DAG cells were clearly higher than those
of fully expanded cells (Table 1). These findings suggest
that an additional phase of polarized cell growth occurs
at later stages of cotyledon development. Pair-wise com-
parisons of the circularity values of 3 and 5 DAG cells
did not detect significant differences. However, there
was a clear trend toward lower values in 5 DAG cells;
because80%ofthe5DAGcellshadacircularityvalue
that was lower than the corresponding 3 DAG cell.
Based on the significant increase in cell shape complex-
ity and the number of skeleton ends between 5 and 12
DAG (Table 1), additional lobe initiation events are
likely to be common at later times of cotyledon
development.
Discussion
The size and shape of aerial organs in plants can be
understood as an emergent property that arises from
complex interactions between tissues [4,5] and regional
differences in the growth behavior of sectors of cells
[34]. The epidermis features prominently in growth
control models, and yet there is a lack of basic knowl-
edge about the morphogenesis of pavement cells,
which are the fundamental b uilding blocks of the t is-
sue. This paper provides important new methods to
analyze the morphogenesis and cell biology of the epi-
dermal tissue and its constituent pavement cells. These
data provide specific geometric rules that govern a per-
sistent maint enance phase of p avement cell growt h
that contributes signific antlytothesizeincreaseofthe
cotyledon.
Figure 5 Growth behavior of cell height from 3 DAG to 5DAG.
Example plot of cell height at three-way cell wall junctions at 3
DAG (x-axis) and 5 DAG (y-axis). The dashed line indicates the
behavior of a cell wall that does not change height from 3 to 5
DAG.
Zhang et al. BMC Plant Biology 2011, 11:27
/>Page 8 of 13
Our time course observations of developing pavement
cells reveal an initial wave of lobe initiation followed by
an extended phase of isotropic cell expansion. This dif-
fers from previous models of pavement cell shape
change that were based on static images and popula-
tion-level sampling [10,20,26]. The population-level
measurements here are also misleading, and depict lobe
initiation and growth as a continuous process (Table 1).
This is clea rly not the case. Lobe formation in cotyle-
dons, like cell division rates, metabolism, and stomatal
development [35-37], underg oes a sharp transition at or
near the 2 DAG stage (Table 2). Sequential images of
developing pavement cells clearly revealed an early
phase of growth and lobe initiation that was completed
at or near 3 DAG, and a subse quent period of diffuse
growth from 3 to 7 DAG during which lobe formation
was rare. Sequential patterning and maintenance phases
of growth are also observed in t richomes, a highly
branched unicellular epidermal cell type [38,39]. In
future experiments we will try to learn more about the
symmetry break that occurs dur ing lobe initiation and
the extent to which the similar genetic control of pave-
ment cells and trichome shape [40] reflects a common
usage of patterning and growth control machineries.
Because of its importa nce during organ expansion, we
focused our analyses on the growth phase that occurs in
the absence of frequent lobe initiation. As expected for
cells that use a diffuse growth mechanism, the amount
of cell growth in the 3 to 5 DAG interval was related to
the initial cell area, because the magnitude of surface
area increase is positively correlated with cell size. In
three independent fields of cells, when cell size at 5
DAG is plotted as a function of initial cell surface area,
the data points define a straight line , with extremely
high R
2
values (Table 3). Therefore, within the sampled
fields of cells, growth is uniform and independent of cell
boundaries. This coordinated growth behavior would
minimize shearing forces between cells that are physi-
cally coupled by the cell wall, and is expected if groups
of cells employ a uniform diffuse growth mechanism
and all expanding surfaces experience an equal strain.
Detection of equal growth rates among fields of cells
does not address the geometric path of the cell shape
change. To learn about the spatial dynamics of growing
pavement cells we used three-way cell wall junctions as
fiduciary marks to monito r the spatial behavior of the
cell anticlinal wall, which unambiguously defines the
leading lateral edge of the growing cell. In 3 indepen-
dent populations of cells (Figure 4F), increases in anti-
clinal wall length were remarkably unifo rm along the
cell perimeter (Figure 4F, Table 3, Figure S1). This
would be expected for uniform diffuse growth of the
ribbon of anticlinal wall within the plane of the leaf.
Height increases in the anticlinal wall are unpredictable
(Figure 5) and the behavior of this cell surface requires
further study.
In terms of lateral cell growth, the low spatial resolu-
tion of our f iduciary marks cannot detect micro-hetero-
geneity in growth at mic ron or nanomet er scales.
However, the perimeter segments did resolve lobes and
indentations within individual pavement cells. Previous
localization data on lobed epidermal cells led to the idea
that lobed regions expand at a greater rate compared to
indentations and more central domains of the cell
[16,26]. To the contrary, our findings indicate that the
entire anticlinal cell wall grows at similar rates that are
independent of cell shape (Figure 4F). In fact, the entire
lateral surfa ce of the cell expands more or less isotropi-
cally (Figure 4G-R). Our analysis of cell growth behavior
in three independent fields of cells is consistent with
this idea. Regardless of their size or shape, the mean iso-
tropy factors ranged from 0.88 to 0.91 (Table 3) and cir-
cularity measurements of the pavement cells at the two
time points were very similar. Therefore, during this
maintenance phase of pavement cell morphogenesis,
fields of expanding cells follow a previ ously defined pat-
tern and accommodate the growth of their neighbors:
indentations, protrusions, and midzones of adjacent cells
expand in harmony. This contrasts with intrusive
growth behavior of fusiform cambial initials, in which
the growth of one cell occurs at the expense of its
neighbor [41]. The detection of equal cell expansion
rates within sect ors of the leaf that span ~ 6 cell dia-
meters (Figure 4A-C) suggests that the growth control
occurs at a regional scale in the tissue.
The regional growth behavior of sectors within an
organ contributes to macroscopic asymmetry [34]. In
our case the Arabido psis cotyledon is very symmetrical,
and this geometry may be the emer gent property of iso-
tropic lateral expansion in populations of pavement
cells. However, we do not want to gloss over the fact
that the lateral expansion during the 3 to 5 DAG inter-
val is not completely uniform. Real cells consistently dis-
played local deviati ons from iso tropic lateral expansion
(Figure 4G-R) that could not be explained by measure-
ment error. These local deviations may simply reflect
random variability in the geometric path of lateral dif-
fusegrowth.Alternatively,itmayreflectadistinct
mechanism for local asymmetric growth. Re gardless of
the mechanism, local asymmetry in cell growth patterns
can contribute to different tissue and organ geometries.
In the future it will be important to develop cell wall
marking techniques [42] that will allow us to monitor
the surface behavior of pavement cells at a high
resolution.
The cytoplasmic control of cell lobing is complex [25].
Genetic and cytological data point to the involvement of
microtubules and AMBs during local cellulose synthesis
Zhang et al. BMC Plant Biology 2011, 11:27
/>Page 9 of 13
and cell shape control [19,20,22,23,26-28,43,44]. Further-
more, the ability of AMBs to localize the cellulose bio-
synthetic machinery has been shown [45], although this
was in the context of localized wall synthesis in develop-
ing xylem cells that are no longer expanding. Although
the involvement of AMBs in pavement cell shape con-
trol and wall extensibility has not been proven, it is rea-
sonable to consider a mechanism that includes
microtubule-dependent t emplating of cellulose microfi-
bril synthesis. This cellular control mechanism is easiest
to understand in the context of uniform diffuse growth
along the periclinal surface of the pavement cells. The
pericl inal cell wall is thick and contains cellulose micro-
fibrils of mixed orientations [33] and correlates with the
variable configurations of periclinal cortical microtu-
bules that have been reported [20,27,33,46]. In fields of
cells undergoing isotropic lateral expansion, we detect
periclinal cortical microtubule ne tworks whose align-
ments vary greatly between and within cells (Figure 2 ).
Given the nearly isotropic growth of t hese cells (Table
3), the organization of the periclinal microtubule net-
work at a particular moment [27,46-48] has little predic-
tive value with respect to the growth trajectory of the
cell. Instead, this variability reveals a cell autonomous
control of the microtubulearraythatcouldinclude
modulation of the KATANIN-dependent severing of
intersecting microtubules [46] and the dynamic remo-
deling of the inner-most network of cellulose microfi-
brils that determine the elastic properties of the wall.
The relationships between AMBs and pavement cell
expansion are less obvious, and may vary depending on
the cell type and/or the particular stage of pavement cell
morphogenesis. In some cell types, lobe formation is
associated with cell wall detachment and the localized
expansion of protrusions that create air spaces within
the internal tissues of the leaf [17]. This cellular organi-
zation and shape change can be explained by a model in
which the parallel alignment of microtubules and micro-
fibrils locally restricts lateral expansi on perpendicular to
the cellulose microfibrils [reviewed in:[16]]. Over time,
uneven growth along the cell perimeter could generate a
narrow indentation as cell expansion preferentially
occurs in the developing lobes. In lobed epidermal cells
from a variety of species, clustered anticlinal microtu-
bules coincide with active sites of cell wall formation
[16], and a modified version of this local microtubule
growth restriction model has been adopted to explain
lobe formation and polarized outgrowth in Arabidopsis
leaf pavement cells [26,27]. Although it is not known if
cotyledon and leaf pavement cells adhere to same mor-
phogenetic rules, it is possible that AMBs are patterning
elements that define the positions of lobe initiation
[Table 2, [20]]. However, during lobe initiation turgor
pressures between two cells cancel along the anticlinal
wall in regions of cell-cell contact. Therefore, modifica-
tion of the local strain behavior of the cell wall alone is
unlikely to be sufficient for lobe initiation.
The concept of persistent differential growth at the
interface of a lobe and an indentation is also proble-
matic because normally there are no gaps and very little
overlap between pavement cells. Instead, the comple-
mentary cell expansion within the lobe of one cell and
the indentation of its neighbor is required to preserve
the integrity of the tissue [20]. Consistent with this
model of cell mechanics, we find that cotyledon pave-
ment cells within a field display nearly equal length
increases along the entire anticlinal wall, and the growth
is independent of the local contour of the cell (Figure
4F). In the lateral dimension, the anticlinal wall
responds uniformly to wall tension that is likely gener-
ated by the periclinal cell wall. A mechanical coupling
of the anticlinal wall with an expanding periclinal wall
could generate this tension.
Regardless of th e mechanism, it is clear from our ana -
lysis of the lateral isotropic growth phase that anticlinal
wall strain in the plane of the leaf is quite uniform and
also includes a growth vector that is perpendicular to
the anticlinal wall. At first glance this seems to be at
odds with the patchy distribution of AMBs (Figure 2)
and their presumed involvement in the synthesis of par-
allel arrays of cellulose microfibrils that would resist
radial expansion of the cell perpendicular to the microfi-
bril network. However, this growth control model
assumes that cellulose microfibrils in the anticlinal wall
are physically coupled to aligned microfibrils in the peri-
clinal cell wall that resist radial expansion. In contrast to
typical cylindrical cells that have a net transverse orien-
tation of cortical microtubules (and microfibrils) at a
whole cell scale, pavement cells only occasionally display
aligned microtubules that span the anticlinal and peri-
clinal walls (Figure 2A,F, insets). It may be that the phy-
sical coupling of the periclinal and anticlinal wall is
regulated during growth, and that forward progression
of the anticlinal boundary may not always be restricted
by linkages with the periclinal wall. We speculate that
phenomena such as regulated microtubule-dependent
nucleation [49,50] at the junctions of anticlinal and peri-
cli nal walls could, via the local activity of CESA, modu-
late the resulting physical connectivity of cellulose
microfibrils between these two cell surfaces.
Conclusions
Time-lapse live cell imaging and new quantitative ana-
lyses of the growing epidermis allowed us to study the
dynamic process of pavement cell morphogenesis and
its relationship to the microtubule cytoskeleton. During
pavement cell development, there are distinct phases of
lobe initiation punctuated by lateral growth that is
Zhang et al. BMC Plant Biology 2011, 11:27
/>Page 10 of 13
highly isotropic. During lateral isotropic growth cortical
AMBs are found both along cell indentations and within
lobes. In some cases cortical domains of AMBs spread
and persist for days. Although it is cl ear that AMBs do
not restrict cell expansion, their importance during the
symmetry breaking events of lobe initiation and the
coordination of isotropic growth within and between
cells is unknown. Further integration of live cel l ima-
ging, computational tools, and genetics can provide a
way to dissect morphogenesis at spatial scales that span
from the initiating pavement cell lobe to the macro-
scopic features of an expanding leaf.
Methods
Seedling growth conditions and cell staining
Arabidopsis thaliana (Col-0) seedlings were grown in
0.5 × MS (Casson, North Logan, UT) media in a Perci-
val chamber at 22°C under continuous illumination (90
μmol m
-2
sec
-1
). Seedlings that germinated at 36 h after
transfer from cold treatment to the growth chamber
were used in subsequent analyses. To obtain static
images of cells from synchronized populations, whole
seedlings were stained with 1 μM FM4-64 a s described
previously [29]. For time lapse imaging ~1 cm
2
of agar
was cut around each 3 DAG plant and the TUB6:GFP-
expressing seedlings were ali gned on a petroleum jelly
chambered slide and mounted in water. After one round
of imaging the seedlings were transferred to humidified
chambers and remounted 2 days later in the same
manner.
Immunolocalization and particle bombardment
Seedlings were staged as described above and processed
for immunolocal ization using the freeze shattering tech-
nique and the DMIA monoclonal antibody as previously
described [20]. For particle bombardment 2 DAG seed-
lings were bom barded using the PDS-1000 helium parti-
cle delivery system (DuPont, Biotechnology Systems
Division, Wilmington, DE) as previously described [26].
Briefly, 2 DAG seedlings were planted at high density
on 1/2 × MS plates and bombarded with 0.7 μgof1μm
gold particles that were coated with 2 μgofGFP:TUB6
expression plasmid [31]. Cellswereimaged36to48h
after bombardment.
Microscopy
FM4-64 stained samples were imaged using a Spot RT
CCD camera mounted on a Nikon Eclipse E800 fluores-
cence microscope using the filter set 532-587 nm excita-
tion, 595 nm long pass dichroic mirror, 608- 683 nm
emission. Excised cotyledons were pressed firmly within
a chambered slide. A 40X 0.75 NA objective was used
for 2 and 5 DAG fields, and a 20X 0.5 NA objective was
used for 12 and 18 DAG cells. Intact GFP-TUB6-
expressing seedlings were mounted in water in cham-
bered slides. Samples were imaged using a Bio-Rad 2100
laser scanning confocal microscope mounted on a
Nikon eclipse E800 stand. Images were obtained with a
60X 1.2 NA water immersion lens. Samples were excited
with 488 nm light and fluorescence signal was collected
using a 490 nm long pass dichroic, and a 500-560 nm
band pass emission filter was used for detection. The xy
pixel size was 0.4 μmandthez-stepsizewas1.2μm.
Two examples of the raw Biorad *.pic files from Figure
2 and the associated metadata are included as additional
data (Additional file 2 and Additional file 3)
Morphometry and image analysis
Three cotyledon fields from three different seedlings
were imaged at 3 and 5 DAG. To test the rate of cell
area expansion in the same imaging field during two
point time-lapse i maging, cell outlines were drawn
manually in ImageJ ( software
and the cell areas were measured. To measure perimeter
segment growth for cells, m aximum Z-projections of
confocal images from two point time-lapse imaging
were used to obtain the cell outline. The three-way cell
wall junctions were used as fiduciary marks to follow
perimeter segments. Cell segments were individually
marked and measured in 3 and 5 DAG cells using Ima-
geJ. To measure the height of the cell wall at three-way
cell wall junctions, confocal image stacks were resliced
perpendicular to the measured wall. Cell height was
measured from a maximum projection of the resliced
image and included only the wall domain where two
adjacent cells were in contact at three-way junctions.
Cell areas, cell segments and cell wall heights at 3 DAG
and 5 DAG were plotted and subjected to least squares
linear regression analysis using Minitab software (Mini-
tab, Quality Plaza, PA). To calculate the isotropy factor
for the 3 to 5 DAG growth interval, manually extracted
3 DAG cells were digitally magnified to yield a cell area
that was equal to the real 5 DAG cell. After rotation to
optimize overlap, the percent of overlapping pixels of
the d igitally amplified 3 dag cells and actual 5 dag cells
were quantified by ImageJ softwa re. The growth of cells
from 3 DAG to 5 DAG was calculated as (5 DAG area -
3 DAG area)/(3 DAG area)/48 hr*100%.
Additional material
Additional file 1: Example images and plots of the cell boundary
segment analysis from several additional cells taken from a
biological replicate. images of 4 additional cells in a field at 3 DAG and
5 DAG. The segments in each cell are labeled and plotted.
Additional file 2: Addi File 2_Fig2A_gfptub6_3dag_cot2_1714_raw.
pic. Raw confocal image used in Figure 2A-E.
Additional file 3: Add File 3_Fig2F_gfptub6_5dag_cot2_1655_raw.
pic. Raw confocal image used in Figure 2F-J.
Zhang et al. BMC Plant Biology 2011, 11:27
/>Page 11 of 13
Acknowledgements
The work was supported by NFS MCB Grant No. 0640872 to D.B.S. Thanks to
David Umulis and Dan Cosgrove for helpful discussions. Thanks to Eileen
Mallery for editorial assistance.
Author details
1
Department of Agronomy, Purdue University, West Lafayette, Indiana 47907-
2054, USA.
2
Department of Biological Sciences, Purdue University, West
Lafayette, Indiana 47907-2054, USA.
Authors’ contributions
All authors contributed to the experimental design. CZ guided data
collection, carried out the data processing for the time-lapse imaging. LH
collected the raw data for the population and time-lapse imaging and
analyzed the population data. DS carried out the GFP-TUB6 live cell imaging.
DS and CZ drafted the manuscript. All authors read and approved the final
manuscript.
Received: 11 October 2010 Accepted: 1 February 2011
Published: 1 February 2011
References
1. Tsiantis M, Langdale JA: The formation of leaves. Curr Opin Plant Biol 1998,
1:43-48.
2. Fleming A: The control of leaf development. New Phytol 2005, 166:9-20.
3. Coen E, Rolland-Lagan A-G, Matthews M, Bangham JA, Prusinkiewicz P: The
genetics of geometry. PNAS USA 2004, 101(14):4728-4735.
4. Savaldi-Goldstein S, Peto C, Chory J: The epidermis both drives and
restricts plant shoot growth. Nature 2007, 446:199-202.
5. Marcotrigiano M: A role for leaf epidermis in the control of leaf size and
the rate and extent of mesophyll division. Am J Bot 2010, 97:224-233.
6. Bai Y, Falk S, Schnittger A, Jakoby MJ, Hulskamp M: Tissue layer specific
regulation of leaf length and width in Arabidopsis as revealed by the
cell autonomous action of ANGUSTIFOLIA. Plant J 2010, 61:191-199.
7. Szymanski DB, Marks MD: GLABROUS1 overexpression and TRIPTYCHON
alter the cell cycle and trichome cell fate in Arabidopsis. Plant Cell 1998,
10(12):2047-2062.
8. Pyke KA, Marrison JL, Leech RM: Temporal and spatial development of
the cells of the expanding first leaf of Arabidopsis thaliana (L.) Heynh.
J Exp Bot 1991, 42:1407-1416.
9. Tsukaya H, Tsuge T, Uchimiya H: The cotyledon: A superior system for
studies of leaf development. Planta 1994, 195:309-312.
10. Tsuge T, Tsukaya H, Uchimiya H: Two independent and polarized
processes of cell elongation regulate leaf blade expansion in
Arabidopsis thaliana (L.) Heynh. Development 1996, 122:1589-1600.
11. Le J, Mallery EL, Zhang C, Brankle S, Szymanski DB: Arabidopsis BRICK1/
HSPC300 is an essential WAVE-complex subunit that selectively
stabilizes the Arp2/3 activator SCAR2. Curr Biol 2006, 16:895-901.
12. Machacek M, Hodgson L, Welch C, Elliott H, Pertz O, Nalbant P, Abell A,
Johnson GL, Hahn KM, Danuser G: Coordination of Rho GTPase activities
during cell protrusion. Nature 2009, 461:99-103.
13. Cosgrove DJ: Growth of the plant cell wall. Nat Rev Mol Cell Biol 2005,
6(11):850-861.
14. Szymanski DB, Cosgrove DJ: Dynamic coordination of cytoskeletal and
cell wall systems during plant cell morphogenesis. Curr Biol 2009, 19:
R800-R811.
15. Esau K: Plant Anatomy. New York: John Wiley & Sons; 1965.
16. Panteris E, Galatis B: The
morphogenesis of lobed plant cells in the
mesophyll and epidermis: organization and distinct roles of cortical
microtubules and actin filaments. New Phytol 2005, 167:721-732.
17. Panteris E, Apostolakos P, Galatis B: Microtubule organization and cell
morphogenesis in two semi-lobed cell types of Adiantum capillus-
veneris L. leaflets. New Phytol 1993, 125:509-520.
18. Wernicke W, Jung G: Role of cytoskeleton in cell shaping of developing
mesophyll of wheat (Triticum aestivum L.). Eur J Cell Biol 1992, 57:88-94.
19. Panteris E, Apostolakos P, Galatis B: Sinuous ordinary epidermal cells:
behind several patterns of waviness, a common morphogenetic
mechanism. New Phytol; 1994:127:771-780.
20. Qiu JL, Jilk R, Marks MD, Szymanski DB: The Arabidopsis SPIKE1 gene is
required for normal cell shape control and tissue development. Plant Cell
2002, 14:101-118.
21. Frank MJ, Smith LG: A small, novel protein highly conserved in plants
and animals promotes the polarized growth and division of maize leaf
epidermal cells. Curr Biol 2002, 12(10):849-853.
22. Paredez AR, Somerville CR, Ehrhardt DW: Visualization of cellulose
synthase demonstrates functional association with microtubules. Science
2006, 312(5779):1491-1495.
23. Gutierrez R, Lindeboom JJ, Paredez AR, Emons AM, Ehrhardt DW:
Arabidopsis cortical microtubules position cellulose synthase delivery to
the plasma membrane and interact with cellulose synthase trafficking
compartments. Nat Cell Biol 2009, 797-806.
24. Crowell EF, Bischoff V, Desprez T, Rolland A, Stierhof YD, Schumacher K,
Gonneau M, Hofte H, Vernhettes S: Pausing of Golgi bodies on
microtubules regulates secretion of cellulose synthase complexes in
Arabidopsis. Plant Cell 2009, 21(4):1141-1154.
25. Szymanski DB: Plant cells taking shape: new insights into cytoplasmic
control. Curr Opin Plant Biol 2009, 12:735-744.
26. Fu Y, Li H, Yang Z: The ROP2 GTPase controls the formation of cortical
fine F-actin and the early phase of directional cell expansion during
Arabidopsis organogenesis. Plant Cell 2002, 14:777-794.
27. Fu Y, Gu Y, Zheng Z, Wasteneys GO, Yang Z: Arabidopsis interdigitating
cell growth requires two antagonistic pathways with opposing action on
cell morphogenesis. Cell 2005, 11:687-700.
28. Panteris E, Apostolakos P, Galatis B: Microtubules and morphogenesis in
ordinary epidermal cells of Vigna sinensis leaves. Protoplasma 1993,
174:91-100.
29. Zhang C, Mallery EL, Schlueter J, Huang S, Fan Y, Brankle S, Staiger CJ,
Szymanski DB: Arabidopsis SCARs function interchangeably to meet
actin-related protein 2/3 activation thresholds during morphogenesis.
Plant Cell 2008, 20:995-1011.
30. Russ JC: The Image Processing Handbook. Boca Raton: CRC Press, Fourth
2002.
31. Nakamura M, Naoi K, Shoji T, Hashimoto T:
Low concentrations of the
propyzamide
and oryzalin alter microtubule dynamics in Arabidopsis
epidermal cells. Plant and Cell Physiol 2004, 45:1330-1334.
32. Xu T, Wen M, Nagawa S, Fu Y, Chen JG, Wu MJ, Perrot-Rechenmann C,
Friml J, Jones AM, Yang Z: Cell surface- and rho GTPase-based auxin
signaling controls cellular interdigitation in Arabidopsis. Cell 2010,
143(1):99-110.
33. Verbelen J-P, Vissenberg K, Kerstens S, Le J: Cell expansion in the
epidermis: microtubules, cellulose orientation and wall loosening
enzymes. J Plant Physiol 2001, 158:537-543.
34. Rolland-Lagan A-G, Bangham JA, Coen E: Growth dynamics underlying
petal shape and asymmetry. Nature 2003, 422.
35. Mansfield SG, Briarty LG: The dynamics of seedling and cotyledon cell
development in Arabidopsis thaliana during reserve mobilization. Int J
Plant Sci 1996, 157:280-295.
36. Geisler MJ, Sack FD: Variable timing of developmental progression in the
stomatal pathway in Arabidopsis. New Phytol 2002, 153:469-476.
37. Masubelele NH, Dewitte W, Menges M, Maughan S, Collins C, Huntley R,
Nieuwland J, Scofield S, Murray AH: D-type cyclins activate division in the
root apex to promote seed germination in Arabidopsis PNAS USA. 2005,
102:15694-15699.
38. Szymanski DB, Marks MD, Wick SM: Organized F-actin is essential for
normal trichome morphogenesis in Arabidopsis. Plant Cell 1999,
11:2331-2347.
39. Mathur J, Spielhofer P, Kost B, Chua N: The actin cytoskeleton is required
to elaborate and maintain spatial patterning during trichome cell
morphogenesis in Arabidopsis thaliana. Development 1999,
126(24):5559-5568.
40. Smith LG, Oppenheimer DG: Spatial control of cell expansion by the
plant cytoskeleton. Annu Rev Cell Dev Biol 2005, 21:271-295.
41. Jura J, Kojs P, Iqbal M, Szymanowska-Pulka J, Wloch W: Apical intrusive
growth of cambial fusiform initials along the tangential walls of adjacent
fusiform initials: evidence for a new concept. Aust J Bot 2006, 54:493-504.
42. Shaw SL, Dumais J, Long SR: Cell surface expansion in polarly growing
root hairs of Medicago truncatula. Plant Physiol 2000, 124(3):959-970.
43. Ambrose JC, Shoji T, Kotzer AM, Pighin JA, Wasteneys GO: The Arabidopsis
CLASP gene encodes a microtubule-associated protein involved in cell
expansion and division. Plant Cell 2007, 19:2763-2775.
44. Kirik V, Herrmann U, Parupalli C, Sedbrook JC, Ehrhardt DW, Hulskamp M:
CLASP localizes in two discrete patterns on cortical microtubules and is
Zhang et al. BMC Plant Biology 2011, 11:27
/>Page 12 of 13
required for cell morphogenesis and cell division in Arabidopsis. J Cell
Sci 2007, 120(Pt 24):4416-4425.
45. Wightman R, Marshall R, Turner SR: A Cellulose Synthase-Containing
Compartment Moves Rapidly Beneath Sites of Secondary Wall Synthesis.
Plant and Cell Physiology 2009, 50(3):584-594.
46. Wightman R, Turner SR: Severing at sites of microtubule crossover
contributes to microtubule alignment in cortical arrays. Plant J 2007,
52:742-751.
47. Yang Z: Small GTPases: versatile signaling switches in plants. Plant Cell
2002, , Supplement: S375-S388.
48. Fu Y, Xu T, Zhu L, Wen M, Yang Z: A ROP GTPase signaling pathway
controls cortical microtubule ordering and cell expansion in Arabidopsis.
Curr Biol 2009, 19(21):1827-1832.
49. Murata T, Sonobe S, Baskin TI, Hyodo S, Hasezawa S, Nagata T, Horio T,
Hasebe M: Microtubule-dependent microtubule nucleation based on
recruitment of γ-tubulin in higher plants. Nat Cell Biol 2005, 7:961-968.
50. Chan J, Sambade A, Calder G, Lloyd C: Arabidopsis cortical microtubules
are initiated along, as well as branching from, existing microtubules.
Plant Cell 2009, 21:2298-2306.
doi:10.1186/1471-2229-11-27
Cite this article as: Zhang et al.: The development and geometry of
shape change in Arabidopsis thaliana cotyledon pavement cells. BMC
Plant Biology 2011 11:27.
Submit your next manuscript to BioMed Central
and take full advantage of:
• Convenient online submission
• Thorough peer review
• No space constraints or color figure charges
• Immediate publication on acceptance
• Inclusion in PubMed, CAS, Scopus and Google Scholar
• Research which is freely available for redistribution
Submit your manuscript at
www.biomedcentral.com/submit
Zhang et al. BMC Plant Biology 2011, 11:27
/>Page 13 of 13