báo cáo khoa học: " The effect of experimental warming on leaf functional traits, leaf structure and leaf biochemistry in Arabidopsis thaliana" pdf
Bạn đang xem bản rút gọn của tài liệu. Xem và tải ngay bản đầy đủ của tài liệu tại đây (2.35 MB, 10 trang )
RESEARCH ARTIC LE Open Access
The effect of experimental warming on leaf
functional traits, leaf structure and leaf
biochemistry in Arabidopsis thaliana
Biao Jin
1,4†
, Li Wang
3,4†
, Jing Wang
4
, Ke-Zhen Jiang
4
, Yang Wang
4
, Xiao-Xue Jiang
4
, Cheng-Yang Ni
4
,
Yu-Long Wang
5
, Nian-Jun Teng
2*
Abstract
Background: The leaf is an important plant organ, and how it will respond to future global warming is a question
that remains unanswered. The effects of experimental warming on leaf photosynthesis and respiration acclimation
has been well studied so far, but relatively little information exists on the structural and biochemical responses to
warming. However, such information is very important to better understand the plant responses to global
warming. Therefore, we grew Arabidopsis thaliana at the three day/night temperatures of 23/18°C (ambient
temperature), 25.5/20.5°C (elevated by 2.5°C) and 28/23°C (elevated by 5°C) to simulate the middle and the upper
projected warming expected within the 21st century for this purpose.
Results: The 28/23°C treatment significantly reduced the life span, total biomass and total weight of seeds
compared with the other two temperatures. Among the three temperature regimes, the concentrations of starch,
chlorophyll, and proline were the lowest at 28/23°C, whereas the total weight of seeds, concentrations of
chlorophyll and proline, stomatal density (SD), stomatal conductance (g
s
), net CO
2
assimilation rate (A) and
transpiration rate (E) were the highest at 25.5/20.5°C. Furthermore, the number of chloroplasts per cell and
mitochondrial size were highest at 25.5/20.5°C and lowest at 28/23°C.
Conclusions: The conditions whereby the temperature was increased by 2.5°C were advantageous for Arabidopsis.
However, a rise of 5°C produced negative effects, suggesting that lower levels of warming may benefit plants,
especially those which belong to the same functional group as Arabidopsis, whereas higher levels of warming may
produce negative affects. In addition, the increase in A under moderately warm conditions may be attributed to
the increase in SD, chlorophyll content, and number of chloroplasts. Furthermore, starch accumulation in
chloroplasts may be the main factor influencing chloroplast ultrastructure, and elevated temperature regulates
plant respiration by probably affecting mitochondrial size. Finally, high SOD and CAT activities may enable plants
grown at elevated temperatures to exhibit relatively high tolerance to temperature stress, thus alleviating the
harmful effects of superoxide anion radicals and hydrogen peroxide.
Background
Atmospheric concentrations of greenhouse gases such as
CO
2
,CH
4
, and N
2
O have increased dramatically since the
beginning of the industrial revolution due to fossil fuel
combustion, deforestation and land development; together,
theseprobablyledtoariseinground-levelair
temperatures at an unprecedented rate over the past three
decades [1,2]. Moreover, the global mean temperature will
continue to rise at a rapid rate, and our climate is likely to
warm by 1.1-6.4°C within the next century [2]. Most plant
species only grow in a certain temperature range. Thus,
some are likely to adapt to warmer temperatures by chan-
ging their growth and development or by shifting their
ranges, provided that the optimum temperatures are not
exceeded. Some species may fail to adapt to this global
change and may even become extinct if the air tempera-
ture is too high [3-5]. Therefore, projected atmospheric
* Correspondence:
† Contributed equally
2
College of Horticulture, Nanjing Agricultural University, Nanjing 210095, PR
China
Full list of author information is available at the end of the article
Jin et al. BMC Plant Biology 2011, 11:35
/>© 2011 Jin et al; licensee BioMed Central Ltd. This is an Open Access article distributed under the terms of t he Creative Commons
Attribution License (http: //creativec ommons.org/licenses /by/2.0), which permits unrestricted use, distribution, and reproduction in
any medium, provided the original work is p roperly cited.
warming is expected to have profound effects on plant
physiology and growth, structure and function of plant
populations, species distributions, and probabilities of
extinction [6,7]. Moreover, this change in plants may
result in complex impacts on vegetation and biodiversity,
leading to terrestrial ecosystem consequences [8,9]. Thus,
understanding the changes in plant growt h and develop-
ment in response to simulated climatic warming is impor-
tant to predict plant responses to global warming in the
near future.
Many studies have investiga ted plant responses to glo-
bal warming at different scales, with most performed at
community level, and only a few at the individual level
or a focus on responses of leaves to temperature
increase [5,10]. Because the leaf is the key organ per-
forming photosynthesis and transpiration, its develop-
ment, which varies with environmen tal factors, is an
important determinant of total plant productivity [11].
In addition, leaves can be indicators of plant community
responses to global warming, because their responses
are not only the basis of changes at the community
level, but they are among those organs that show visible
impacts of air temperatures [1,12]. Furthermore, leaf
traits can express phenotypically plastic responses to
growth temperature [13]. Consequently, experiments on
the effects of global w arming on leaf growth and devel-
opment will provide a better understanding of the
mechanism of plant responses to global warming at the
community level.
Previous studies mainly investigated the effects of
experimental warming on leaf photosynthesis and
respiration acclimation, but leaf structure (microstruc-
ture and ultrastructure) and biochemical processes were
seldom focused on [1,11,14]. Because leaf structure is
one of t he most important traits exhibiting phenotypic
plasticity to growth temperat ure, investigating responses
of leaf structure to warming is fundamental to project-
ing the impact of global change on plant growth. In
addition, leaf biochemical and physiological changes are
related to leaf structure and function. For example, tem-
perature stress is known to induce plants to produce
reactive oxygen species (ROS) and malondialdehyde
(MDA), which can damage both the leaf structure and
function [15,16]. To alleviate the damage, plants gener-
ally enhance the production of ROS scavenging
enzymes, such as superoxide dismutase (SOD) and cata-
lase (CAT), and osmoprotectants like proline and carbo-
hydrates. Although many studies have investigated the
effects of high temperature on the production of antiox-
idant enzymes and osmoprotectants, the periods of high
temperature were usually limited to several hours or
days; also, few studies examined these biochemical and
physiological changes under global warming conditions
for one generation [17-19]. Therefore, to obtain an
integrative understanding of the responses of leaf
growth to global warming, we examined the effects of
simulated climatic warming on SOD and CAT activities,
contents of MDA, proline, carbohydrates and chloro-
phyll of Arabidopsis thaliana leaves, and leaf micro-
structure and ultrastructure, apart from fitness
components. Arabidopsis is a model plant widely used
in molecular, genetic, and developmental biology. There-
fore, studying its responses may represent a valuable
assessment of the possible plant changes occurring at
the individual level in a future warmer world.
Methods
Experimental design and growth conditions
Seeds of A. thaliana (L.) Heynh. [Wild-type Columbia
(Col-0), Nottingham Arabidopsis Stock Centre, Notting-
ham University, UK] were exposed to stratification at
4°C for 2 d before planting. Then they were sown in
400-cm
3
plastic pots containing a 1:1 (v/v) mixture of
vermiculite and peat (Kaiyin Company, Beijing, China).
The plants were grown in growth chambers (RXZ-300B,
Ningbo Dongnan Instruments Co Ltd, China). The mid-
dle and upper projected warming in the 21st century is
expected to approximate 2.5 and 5°C, respectively [2].
This ecotype originally derives from Columbia in USA,
and t he spring /aut umn averag e temperature in this loca-
tion is 15-16/21-22°C />TairObject?type=species_variant&id=90. The common
growth temperature for this ecotype is 22-23°C/16-19°C
(day/night) in many laboratories, and this nearly corre-
sponds to grow th temperatures in nature. In addition,
some studies have used 23°C as the baseline or ambient
temperature to investigate the eff ects of t emperature on
Arabidopsis flowering [20,21]. Furthermore, the seeds
used here were obtained from plants that have grown in
growth chambers at 23/1 8°C for more than ten genera-
tions by seed propagation over the past several years. Con-
sequently, this ecotype may have adapted to this growth
temperature after so many generations were grown at
23/18°C. Therefore, in the present study, the day/night
temperatures in the growth chambers were maintained at
23/18°C, and this is referred to as ‘ambient temperature’,
whereas 25.5/20.5°C is ‘elevated temperature I’,and28/
23°C is ‘elevated temperature II’, respectively ((with 1
growth chamber per temperature regime). The results
from su ch experiments will help to predict the responses
of plants to the future middle and upper warming regimes.
The plants were grown under a 16-h photoperiod and 500
μmolm
-2
s
-1
of pho tosynthetically active radiation (PAR),
provided by fluorescent tubes (Philips Electronics Trading
& Services Co Ltd, Shanghai, China ), at 80/95% RH (day/
night). Every week, the plants were alternately watered to
saturation with 1/2 MS solution or de-ionized water.
The seedlings were thinned t o one individual closest to
Jin et al. BMC Plant Biology 2011, 11:35
/>Page 2 of 10
the center of each pot after emergence. The pots were ran-
domly rearranged every 3 d to negate any possible effects
of position within the chambers. When bolting had just
commenced (i.e. stage 5.10) [22], the leaves were sampled
for the following analyses, with all analyses repeated on
five plants. When over 95% of the siliques were mature (i.
e. stage 9.70) [22], all the plant material was sampled.
Except for the seeds, all other plant material was dried to
a constant weight at 60°C and then measured on an elec-
tronic balance. The seeds were weighed after they were
stored in a desiccator at room temperature for over 20
days. The life span and total biomass were then calculated
based on 35 plants per treatment.
Gas exchange measurements and determination of
stomatal density
Three fully expanded leaves from each of five plants per
treatment were selected during the middle of the light
period to measure the stomatal conductance (g
s
), tran-
spiration rate (E), and net CO
2
assimilation rate (A)
using an LI-6400 Portable Photosynthesis System (LI-
COR Inc., Lincoln, Nebraska, USA). The measurements
were carried out at 1500 μ mol m
-2
s
-1
PAR, 2.0-2.5 KPa
VPD, 23°C, and 370-390 ppm CO
2
. The stomatal density
(SD) was determined as outlined by Ceule mans et al.
[23]; three l eaves per plant were sampled from five
plants, and 20 separate fields of 0.16 mm
2
were analyzed
per leaf [24].
Determination of carbohydrate, protein, and chlorophyll
contents
Soluble sugars were extracted from leaf tissue by hot
ethanol extraction, and starch was extracted from the
pellet as follows. Leaves were sampled at the end of the
light period, oven-dried at 60°C, a nd homogenized.
Approximately50mgofdryleafpowerofeachsample
was extracted with 80% ethanol (v/v) at 85°C for
60 min. The extracts were then centrifuged at 12 ,000 g
for 10 min. The ethanol extraction step was repeated
three times. The three resulting supernatants were com-
bined, treated with activated charcoal, and evaporated to
dryness in a vacuum evaporator. The residues were
redissolved in distilled water and subjected to soluble
sugar analysis using the anthrone-sulfuric acid method
[25]. Following the removal of soluble sugars, the
remaining residues were oven-dried overnight at 60°C
and then subjected to starch analysis according to the
procedures described in Vu et al. [26].
Leaf protein concentrations were determined accord-
ing to Bradford [27] using bovine serum albumin as the
standard. Chlorophyll a and b were extracted with the
acetone method. After 0.5 g of leaf tissue was homoge-
nized in 5 mL of 100% acetone, the extract was added
to 5 mL of 80% (v/v) acetone and then centrifuged at
12,000 g for 10 min. The absorbance of the supernatan t
was read at 663 nm and 645 nm, respectively. The
chlorophyll a and b contents were calculated according
to the method of Porra [28].
Measurements of MDA, proline, and enzyme activity
MDA in leaves was measured by the thiobarb itur ic acid
(TBA)method[29]withslight modifications. Fresh
leaves (~ 0.5 g) were homogenized with a mortar and
pestle in 10% (w/v) trichloroacetic acid. Then the homo-
genate was centrifuged at 12,000 g for 10 min. Two mL
of supernatant were mixed with 2 mL of 10% trichloroa-
cetic acid containing 0.5% (w/v) thiobarbituric acid. The
mixture was boiled at 100°C for 30 min and then
quickly cooled in an ice bath. After centrifugation at
12,000 g for 10 min at 4°C, the supernatant absorbance
was read at 532 nm, and values corresponding to non-
specific absorption at 600 nm were subtracted. The
MDA concentration was calculated using its extinction
coefficient (155 mM
-1
cm
-1
).
The extraction and content determination of proline
in leaves was performed according to the method of
Bates et al [30]. Fresh leaves (~ 0.5 g) were homoge-
nized in 10 mL of 3% aqueous sulfosalicylic acid, and
the extracts were centrifuged at 4000 g for 10 min.
Two mL of supernatant were reacted with 2 mL of 2.5%
acidic ninhydrin and 2 mL glacial acetic acid in a test
tube for 1 h at 100°C; the reaction was terminated in an
ice bath. The reaction mixture was extracted with 4 mL
of toluene, mixed t horoughly, and warmed to room
temperature. The absorbance was read at 520 nm using
toluene as a blank, and the proline concentration was
calculated.
The methods for determining the SOD and CAT
activities are listed next. The total rosette leaves were
sampled and immediately frozen in liquid nitrogen after
fresh weight was measured, and then stored at -80°C
until further use. A 0.5-g sample of leaf tissue was
homogenized in 10 mL of 0.1 mol/L phosphate buffer
(pH 7.8) supplemented with 1% (w/v) polyvinylpyrroli-
done and then centrifuged at 12,000 g for 15 min. The
supernatants were used for enzyme assays. A ll steps of
the extraction procedure were carried out at 0-4°C. The
SOD activity was measured according to the method of
Beauchamp and Fridovich [31] with minor modifica-
tions. The reaction mixture (3 mL) contained 13 mmol/
L methionine, 75 μmol/L nitroblue tetrazolium (NBT),
2.0 μmol/L riboflavin, 0.1 mmol/L EDTA, and 0.1 mL of
enzyme extract in 50 mmol/L phosphate buffer (pH
7.8). Glass test tubes containing the reaction mixture
wereilluminatedwithafluorescentlampfor15minat
25°C. Non-illuminated and illuminated reactions without
the enzyme extract served as calibration standards. After
illumination, the photoreduction of NBT (production of
Jin et al. BMC Plant Biology 2011, 11:35
/>Page 3 of 10
blue formazan) was measured at 560 nm using a Beck-
man spectrophotometer (DU 640, Beckman C oulter,
Germany). One unit of SOD was defined as the enzyme
activity that inhibited the photoreduction of NBT to
blue formazan by 50%. The C AT activity was deter-
mined at 25°C by following the method of Claiborne
[32] with slight modifications. The reaction mixture
(3 mL) co ntained 10 mmol/L H
2
O
2
and 0.2 mL of
enzyme extract in 50 mmol/L phosphate buffer (pH
7.0). The CAT activity was determined based on the
decrease in absorbance of H
2
O
2
at 240 nm.
Leaf structural observation
At every temperature, three fully expa nded leaves from
each of five plants were dissected and immedi ately fixed
in 2.5% (v/v) glutaraldehyde (in 0.1 mol/L phosphate
buffer, pH 7.0) for 2 h at 4°C. Then the samples were
washed five times with the same buffer and post-fixed
in 1% osmium tetroxide for 3 h. After being washed
with the same buffer, the leaf tissues were passed
through an ethanol dehydration series, infiltrated, and
embedded in Spurr’s resin. The embedded leaf tissues
were sectioned with an LKB-V ultramicrotome
(Bromma, Sweden). The 1-μm-thick sections were
stained with 1% toluidine blue O in 2% sodium borate
for general tissue staining; they were then observed and
photographed under a microscope (Zeiss Axioskop 40:
Carl Zeiss Shanghai Company Limited, Shanghai,
China). At each temperature, three leaves from each of
five plants were sampled for measuring the leaf thick-
ness and number of cell layers. The cell size was calcu-
lated using AutoCAD 2004 (Autodesk, Inc, USA) from
digital pictures. In addition,sectionswerecutusingan
LKB-V ultramicrotome. Thin sections were stained with
uranyl acetate and lead citrate; they were then observed
and photographed under a transmission electron micro-
scope (JEOL Ltd, Tokyo, Japan) [24]. For each treat-
ment, the cell (the cells in palisade and spongy tissues)
size and number of chloroplasts per cell were deter-
mined from 300 cells. Chloroplast length and width,
area of chloropl ast profile, and ratio of total starc h
grains per chloroplast relative to chloroplast area were
determined from 100 chloroplasts. The area per starch
grain was determined from 100 starch grains, and the
mitochondrial length and width were determined from
100 mitochondria.
Statistical analysis
The data are shown as the mean values ± standard
deviation. The data were subjected to a one-way analysis
of variance using the SPSS software 16.0 (SPSS Inc,
Chica go, IL, USA), and the means were compared using
the Bonferroni t-test with alpha = 0.05 (the type I
experimentwise error rate).
Results
Life span and plant biomass
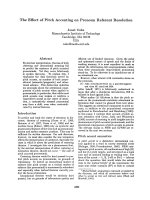
Experimental warming markedly enhanced Arabidopsis
growth and shortened its life span (Figure 1, Table 1).
For example, when compared with ambient temperature,
elevated temperatures I and II significantly shortened
thelifespanofArabidopsis by approximately 7% and
21%, respectively. There was no significant difference in
the plant biomass between ambient temperature and
elevated temperature I, but elevated temperature II sig-
nificantly reduced it by about 35% compared with the
other two temperatures. Relative to ambient tempera-
ture, elevated temperature I significantly increased total
weight of seeds by approximately 37%, whereas elevated
temperature II reduced it by approximately 14%.
Stomatal and photosynthetic characters
Compared with ambient temperature, the SD on the
adaxial and abaxial surfaces at elevated temperature I
was significantly increased by 24% and 29%, respectively.
However, no significant difference in SD was observed
between ambient temperature and elevated temperature
II (Table 1). In addition, elevated temperature I also sig-
nificantly enhanced g
s
, E, and A relative to ambient tem-
perature. For instance, g
s
,E,andAatelevated
temperature I were increased by 12%, 12%, and 15%,
respectively (Table 1). There was no significant differ-
ence in g
s
and E between ambient temperature and ele-
vated temperatur e II, but A was significantly reduced by
about 13% at elevated temperature II compared to ambi-
ent temperature.
Figure 1 Growth curves of Arabidopsis grown at three
temperatures. The growth stages 1.02, 1.1, 5.1, 6.00, 6.50, 6.90, and
9.70 correspond to “2 rosette leaves >1 mm in length”, “10 rosette
leaves >1 mm in length”, “first flower buds visible”, “first flower
open”, “50% of flowers to be produced have opened”, “flowering
complete”, and “senescence complete”, respectively (Please refer to
Table two (p. 1501) and Figure two (p. 1502) of Boyes et al. 2001
[22]).
Jin et al. BMC Plant Biology 2011, 11:35
/>Page 4 of 10
Levels of carbohydrates, protein, and chlorophyll
Temperatures profoundly affected the leaf soluble sugar
and starch contents. Compared with ambient tempera-
ture, the foliar content of soluble sugars at elevated tem-
perature I was reduced by approximately 9%, but there
was no significant difference in the content of soluble
sugars between ambient temperature and elevated tem-
perature I. The foliar content of soluble sugars did not
differ significantly between ambient temperature and
eleva ted temperature II. Compared to elevated tempera-
ture I, the content of soluble sugars at elevated tempera-
ture II was increased by 13%. The starch content of
leaves was highest at ambient temperature and was fol-
lowed by elevated temperatures I and then II. There was
no significant difference in the protein content among
the three temperatures. Relative to ambient temperature,
elevated temperature I increased the contents of chloro-
phyll a and b, whereas lower values were recorded at
elevated temperature II. The ratio of chlorophyll a to b
at all three temperatures was approximately 3:1 and was
not markedly affected by temperature (Table 1).
MDA and proline contents and enzyme activity
Temperature influenced the MDA an d proli ne cont ents
in leaves. The foliar MDA cont ent was significantly
higher at elevated temperature II than at the other tem-
peratures. Compared with ambient temperature, elevated
temperature I slightly decreased the foliar MDA content
by 13%, whereas elevated temperature II significantly
increased its content by approximately 65%. The proline
Table 1 Effects of experimental warming on Arabidopsis
Growth, physiological, biochemical and structural parameters Ambient
temperature
(23/18°C)
Elevated temperature
I
(25.5/20.5°C)
Elevated temperature
II
(28/23°C)
Life span (days) 76.2 ± 2.2a 71.0 ± 3.6b 60.4 ± 1.9c
Plant biomass (mg) 2128.0 ± 349.4a 2116.7 ± 337.7a 1378.5 ± 370.4b
Total weight of seeds (mg) 392.5 ± 110.7b 536.6 ± 139.6a 338.5 ± 114.9b
SD (number per mm
2
) on the adaxial surface 181 ± 13b 224 ± 15a 200 ± 14ab
SD (number per mm
2
) on the abaxial surface 206 ± 14b 265 ± 16a 214 ± 13b
g
s
(m mol m
-2
s
-1
) 378 ± 24b 423 ± 28a 385 ± 21ab
E (m mol m
-2
s
-1
) 7.5 ± 0.4b 8.4 ± 0.6a 7.7 ± 0.4b
A(μ mol m
-2
s
-1
) 14.3 ± 1.1b 16.5 ± 1.4a 12.4 ± 0.9c
Soluble sugars (μgmg
-1
DW) 38.7 ± 3.0ab 35.2 ± 1.3b 40.0 ± 2.0a
Starch (μgmg
-1
DW) 61.4 ± 5.7a 53.7 ± 2.3b 48.8 ± 4.3b
Protein (μgmg
-1
DW) 19.7 ± 1.9a 20.0 ± 2.3a 22.0 ± 2.2a
Chlorophyll a (mg g
-1
FW) 0.93 ± 0.05b 1.04 ± 0.07a 0.84 ± 0.04b
Chlorophyll b (mg g
-1
FW) 0.30 ± 0.02ab 0.34 ± 0.03a 0.26 ± 0.03b
Chlorophyll a+b (mg g
-1
FW) 1.23 ± 0.06b 1.38 ± 0.09a 1.10 ± 0.07b
Chlorophyll a/b 3.1 ± 0.2a 3.1 ± 0.2a 3.2 ± 0.2a
MDA (nmol g
-1
FW) 2.3 ± 0.2b 2.0 ± 0.2b 3.8 ± 0.5a
Proline (ug g
-1
FW) 15.3 ± 2.1b 22.8 ± 3.2a 14.4 ± 1.7b
SOD (Unit g
-1
FW) 295 ± 16b 347 ± 25a 319 ± 18ab
CAT (Unit g
-1
FW min
-1
) 7.9 ± 1.1b 16.1 ± 1.5a 17.7 ± 1.9a
Leaf thickness (μm) 159 ± 14a 155 ± 14ab 146 ± 13b
Cell Size (μm
2
) 981 ± 398a 939 ± 372a 774 ± 337b
Number of cell layer 7.6 ± 1.1a 7.5 ± 1.2a 7.3 ± 1.2a
Number of chloroplasts per cell 8.5 ± 2.2a 9.0 ± 2.8a 6.6 ± 2.5b
Chloroplast length (μm)* 5.0 ± 1.3a 5.1 ± 1.4a 5.1 ± 1.3a
Chloroplast width (μm)* 2.3 ± 0.5a 1.9 ± 0.4b 1.6 ± 0.4c
Area of chloroplast profile (μm
2
) 9.2 ± 5.0a 7.8 ± 4.0b 6.7 ± 3.5b
Area per starch grain (μm
2
) 1.2 ± 0.7a 0.5 ± 0.3b 0.5 ± 0.3b
Ratio of total starch grains per chloroplast relative to chloroplast area
(%)
29 ± 9a 15 ± 5b 13 ± 5b
Mitochondrial length (μm)* 0.7 ± 0.2b 0.9 ± 0.2a 0.7 ± 0.1b
Mitochondrial width (μm)* 0.5 ± 0.1b 0.6 ± 0.1a 0.5 ± 0.1b
Values (mean ± standard deviation) with the same letter are not significantly different at a = 0.05 by the Bonferroni t-test. *The length of chloroplasts and
mitochondria is the longest dimension, and the width of chloroplasts and mitochondria is the widest dimension. SD: stomatal density; g
s
: stomatal conductance;
E: transpiration rate; A: net CO
2
assimilation rate; DW: dry weight; FW: fresh weight.
Jin et al. BMC Plant Biology 2011, 11:35
/>Page 5 of 10
content at elevated te mperat ure I was higher than that at
ambient temperature and elevated temperature II by 63%
and 67%, respectively. However, there was no signifi can t
difference in the proline content between ambient tem-
perature and elevated temperature II (Table 1).
Relative to ambient temperature, elevated temperatur e
I significantly increased the SOD activity by 18%,
whereas elevated temperature II slightly increased the
SOD activity by 8%. However, there was no significant
difference in SOD activity between elevated tempera-
tures I and II. There was a positive correlation between
CAT activity and temperature. In comparison with
ambient temperature, the CAT activity at elevated tem-
peratures I and II was significantly increased by 104%
and 124%, respectively. However, there was no signifi-
cant difference in the CAT activity between elevated
temperatures I and II, although the CAT activi ty for the
latter was 10% higher than the former (Table 1).
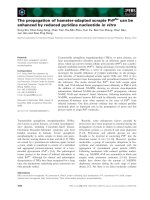
Leaf microstructure and ultrastructure
Leaf thickness and cell size were not significantly differ-
ent between ambient temperature and elevated tempera-
ture I, but at elevated temperature II they were
significantly reduced by approximately 8.2% and 21.1%,
respectively, compared to those at ambient temperature.
However, no difference was observed in the number of
cell layers among the three temperatures. Therefore, the
changes in leaf thickness were mainly due to changes in
cell size since the number of cell layers was not mark-
edly affected by temperature (Table 1, Figure 2).
Relative to ambient temperature, elevated temperatur e
II caused a decrease of 22% in the number of chloro-
plasts per mesophyll cell, but there was no significant
difference between ambient temperature and elevated
temperature I. In addition, chloroplast length was not
significantly influenced by temperature, but chloroplast
width was. For instance, compared with ambient tem-
perature, chloroplast width at elevated temperatures I
and II was decreased by 17% and 30%, respectively
(Table 1, Figure 2A-C). Chloroplast width at elevated
temperature I was 16% higher than at elevated tempera-
ture II. Given the unchanged chloroplast length, the
concomitant reduction in chloroplast profile area was a
result of the decreased widths at elevated temperatures I
and II.
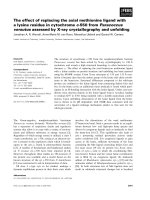
The size of starch grains and the ratio of total starch
grains per chloroplast relative to the chloroplast profile
area at ambient temperature were dramatically higher
than those at elevated temperatures I and II. The aver-
age size per starch grain decreased from 1.2 μm
2
at
ambient temperature to approximately 0.5 μm
2
at both
elevated temperatures I and II (Table 1, Figure 3A-D).
Starch grains accounted for an average of 15% and 13%
of the chloroplast profile at elevated temperatures I and
II, respectively ; these values were lower than the 29% at
ambient temperature (Table 1, Figure 3A-C). At ambi-
ent temperature, the starch grains took up approxi-
mately 50% of the chloroplast profile (Figure 3D). About
40% of chloroplasts lacked starch grains at elevated tem-
peratures I and II compared to approximately 25% at
ambient temperature.
The size and number of mitochondria were affected
by temperature. Mitochondria were larger at elevated
temperature I than at the other two temperatures (Table
1, Figure 3A-C). For example, relative to ambient tem-
perature, elevated temperature I significantly increased
mitochondrial length and width by 29% and 20%,
respectively. However, the re was no difference in mito-
chondrial size between ambient temperature and ele-
vated temperature II. In general, there were more
mitochondria near chloroplasts at el evated temperatures
I and II than at ambient temperature (Figure 3A-D). It
was interesting that chloroplasts contained few starch
grains at elevated temperatures I and II when many
mitochondria were near chloroplasts (Figure 3E, F).
Thus, there was a negative relationship between the size
and number of starch grains in chlor oplasts and the
number of mitochondria near the chloroplasts.
Discussion
Plant growth and optimum growth temperature
The growth temperature range for Arabidopsis is 21-23°C
in most laboratories, b ut this is higher than its minimum
growth temperature. Compared with vegetative growth,
the Arabidopsis reproductive growth (especially after fer-
tilization of most flowers) can tolerate higher tempera-
tures, because older plants are usually less sensitive to
temperature than younger ones [33]. Our results show
that 23°C is below the optimum temperature for the
growth of Arabidopsis, because the p lants grew better at
25.5°C than at 23°C. However, a temperature of 28°C
negatively affected leaf growth and significantly reduced
the total biomass and total weight of seeds. Therefo re,
25.5°C is closer to the optimum Arabidopsis growth tem-
perat ure, and 28°C is cl early above the optimum level for
growth. The results of this warming experiment using
Arabidopsis, a small annual herb with short life cycle,
may be useful for predicting how plants, especially those
belonging to the same functional group as Arabidopsis,
respond to an increasing air temperature. Fo r example,
some annual herbs might benefit from low levels of
warming that do not exceed their optimum growth tem-
perature; in contrast, higher levels of warming may pro-
duce negative effects since plants that belong to the same
functional group usually respond in similar ways to
changes in environmental factors [34,35].
Jin et al. BMC Plant Biology 2011, 11:35
/>Page 6 of 10
Photosynthetic and stomatal characteristics
A large body of work has shown that climatic warming
can stimulate plant photosynthesis and increase plant pro-
ductivity [36,37]. Compared to the measurements at ambi-
ent temperature, the chlorophyll content and A at elevated
temperature I increased by 12% and 15%, respectively,
consistent with previous reports. Increased A may be due
to the increased chlorophyll content and g
s
, because the
chlorophyll content and g
s
are usually positively correlated
to A [38]. However, relative to ambient temperature, ele-
vated temperature II had a significantly lower A and chlor-
ophyll content, but g
s
was not significantly a ffected; t his
result is in contrast with some findings reporting that
experimental warming increased A [37,39]. This apparent
discrepancy may be partly attributable to differences in the
extent of temperature increase, i.e. a rise of 0-3°C in the
previous studies compared to 5°C at elevated temperature
II. The temperature used in the previous experiments may
Figure 2 CrosssectionsofleavesofArabidop sis grown at three temperatures. Samples were taken at ambient temperature (A and B),
elevated temperature I (C and D), and elevated temperature II (E and F). Note that the leaf at elevated temperature II was the thinnest of the
three temperatures. In addition, there were more chloroplasts per cell at ambient temperature and elevated temperature I than elevated
temperature II. Bars, 150 μm (A, C and E); 50 μm (B, D and F).
Jin et al. BMC Plant Biology 2011, 11:35
/>Page 7 of 10
not have exceeded the optimum temperature of photo-
synthesis, whereas elevated temperature II may have.
When the temperature exceeds optimum range,
A declines by reducing the activation of ribulose-1,5-bis-
phosphate carboxylase/oxygenase [40]. In addition, the sig-
nificant reduction in the number of chloroplasts per cell at
elevated temperature II may be also a reason causing
low er A. In the present study, the signific ant decrease in
plant biomass at elevated temperature II may be a direct
effect of decreased A and a shorter life span. Although
A was significantly higher at elevated temperature I com-
pared to ambient temperature, there was no significant
difference in plant biomass between them. The first reason
accounting for this could be the shorter life span of the
plants at elevated temperature I compared to ambient
temperature, as we ll as the advantage of higher A at ele-
vated temperature I being offset by a shorter growth time.
Secondly, plants grown at elevated temperature I may
have had a higher E in the darkness, thus consuming
higher amounts of soluble sugars and starch compared
with those grown at ambient temperature.
Activities of antioxidant enzymes and MDA content
Temperature stress is known to induce plants to produce
reactive oxygen species (ROS) and MDA, both of whic h
can damage tissues [15,16]. To ensure survival, plants
generally enhance the production of ROS scavenging
enzymes, such as SOD and CAT, and osmoprotectants
like proline [16,17]. In the present study, the MDA con-
tent recorded at elevated temperature II was the highest of
the three temperatures, indicating that h igh temperature
stress negatively affected t he plants. However, no signifi-
cant differences were observed in the SOD and CAT activ-
ities bet ween elevated temperature I and II. This result
could be attributed to the following reasons. The high
SOD and CAT activities enabled the plants grown at ele-
vated t emperature I to exhibit a relatively high tolerance
to temperature stress, possibly accounting for their fast
growth. For the plants grown at elevated temperature II,
the high enzyme activities may enable them to quickly
clear superoxide anion radicals and catalyze the decompo-
sition of hydrogen peroxide to water and oxygen, thus alle-
viating the harmful effects of these detrimental products.
Therefore, high SOD and CAT activities at elevated tem-
perature II may be a positive feedback or protection
mechanism that is triggered when the plant is subjected to
relatively severe long-term warming stress. The proline
content, an indicator o f resis tance to heat stress, was the
lowest at elevated temperature II. It is possible that less
proline was produced because of the partially inhibition of
normal metabolic capability at elevated temperature II.
However, plants at elevated temperature I may have a
Figure 3 Transmission electron micrographs showing leaf c hloroplast and mitochondrial ultrastructure of Arabidopsis grown at three
temperatures. Samples were taken at ambient temperature (A and D), elevated temperature I (B, E and F), and elevated temperature II (C).
Note that there were larger starch grains in the chloroplasts of A. thaliana leaves grown at ambient temperature than at elevated temperatures I
and II. In addition, there were more mitochondria nearby chloroplasts at elevated temperatures I and II than at ambient temperature. St, starch
grain; Mi, mitochondrion; Ch, chloroplast. Bar, 1 μm (A-F).
Jin et al. BMC Plant Biology 2011, 11:35
/>Page 8 of 10
less-affected heat-resistant system that produces more
proline as a tolerance mechanism to heat stress, given that
the proline content was the highest at this temperature.
Leaf structure
Among the three temperatures, the number of chloro-
plasts was greatest at elevated temperature I and lowest
at II. The number of chloroplasts was proportional to
the chlorophyll content and A, indicating a concomitant
change in chloroplast number, chlorophyll content, and
photosynthesis. Our results are in agreement with the
general notion of a close correlation between A and
chloroplast number [41]. Similar findings have been
reported for the effects of elevated CO
2
on chloroplast
number [42]. Chloroplast width was mainly influenced
by starc h accumulation, and the chloroplast profile area
was largely affected by its width, since its length did not
vary much. In fact, increased starch accumulation
widened leaf chloroplasts in previous reports [24,42]. It
seems that there was a discrepancy between the foliar
starch content and A in the present study, because
A was recorded as the highest of the thre e temperatures
at elevated temperature I, whereas the starch content was
not. This observation may be due to the higher growth
rate and higher demand for energy and carb on skeletons
of plants grown at elevated temperatures compared to
those grown at ambient temperature. Thus, more starch
was consumed by rapid plant growth at elevated tem-
peratures, leaving fewer starch grains and soluble sugars
to be stored in leaves [24,43]. This explanation could be
supported by the interesting finding that there were
more and larger mitochondria at elevated temperature I,
because plants with higher growth rates have higher
energy demands and more mitochondria–the organelles
providing most of the ATP required for cell growth and
maintenance throug h oxid ative ph osphor ylati on [42,44].
In addition, plants at el evated temperatures have a higher
E in the darkness compared with those grown at ambient
temperature; thus, more soluble sugars and starch will be
consumed. Elevated temperatures profoundly affect plant
respiration [1,45], but relatively little information exists
on the underlying mechanism. Our current results sug-
gest that elevated temperature regulates plant respiration
probably by affecting mitochondrial number and size.
Conclusions
In conclusion, we investigated the effects of experimen-
tal warming on leaf functional traits, leaf structure, and
leaf biochemistry in A. thaliana, apart from fitness com-
ponents. Several findings are worth noting. Firstly, mod-
erate simulated climatic warming benefited Arabidopsis
growth, whereas severe warming produced detrimental
effects. This implies that global warming can have both
beneficial and detrimental impacts on plants, especially
on those belonging to the same functional group as Ara-
bidopsis, i.e., moderate warming is beneficial to plants
when it is below t heir optimum temperature, whereas
higher levels of warmi ng are detrimental to plants. Sec-
ondly, the increase in A we observed under moderately
warm conditions may be attributed to the increase in
SD, chlorophyll content, and number of chloroplasts.
Thirdly, starch accumulation in chloroplasts may be the
main factor influencing chl oroplast ultrastructure, and
elevated temperature regulates plant respiration by
probably affecting mitochondrial size. Finally, high SOD
and CAT activities may enable plant s grown at elevated
temperatures to exhibit relatively high tolerance to tem-
perature stress, thus alleviating the harmful effects of
superoxide anion radicals and hydrogen peroxide.
Acknowledgements
We are very grateful to the two anonymous reviewers assigned by the BMC
Plant Biology journal for carefully reviewing our manuscript and providing us
with many valuable suggestions. In addition, we would like to thank Prof.
Yu-Xi Hu and Prof. Jin-Xing Lin for valuable discussions during the early
experimental stages. We would also like to thank Gang Chen, Yan Lu, Ming-
Ming Lin, and Ye Pan for their help in the lab. This work was supported by
the National Science Fund of China (30870436, 30700081), and the funding
from the International Foundation for Science for Dr. Nianjun Teng
(Reference No.C/4560-1).
Author details
1
College of Biological Sciences and Biotechnology, Yangzhou University,
Yangzhou 225009, PR China.
2
College of Horticulture, Nanjing Agricultural
University, Nanjing 210095, PR China.
3
Key Laboratory of Photosynthesis and
Environmental Molecular Physiology, Institute of Botany, Chinese Academy
of Sciences, Beijing 100093, PR China.
4
College of Horticulture and Plant
Protection, Yangzhou University, Yangzhou 225009, PR China.
5
Key
Laboratory of Crop Genetics and Physiology of Jiangsu Province, Yangzhou
University, Yangzhou 225009, PR China.
Authors’ contributions
BJ and NJT designed the experiments. LW, JW, KZJ, YW, XXJ, CYN, and YLW
performed the experiments and analyzed the data. BJ and NJT analyzed the
data and wrote the manuscript. All authors read and approved the final
manuscript.
Received: 30 September 2010 Accepted: 18 February 2011
Published: 18 February 2011
References
1. Gunderson CA, Norby RJ, Wullschleger SD: Acclimation of photosynthesis
and respiration to stimulated climatic warming in northern and
southern populations of Acer saccharum: laboratory and field evidence.
Tree Physiol 2000, 20:87-96.
2. IPCC: Technical summary: Climate change 2007: the physical science basis.
Contribution of Working Group I to the Fourth Assessment Report of
the Intergovernmental Panel on Climate Change.Edited by: Solomon S,
Qin D, Manning M, Chen Z, Marquis M, Averyt KB, Tignor M, Miller HL.
Cambridge, UK: Cambridge University Press; .
3. Thomas CD, Cameron A, Green RE, Bakkenes M, Beaumont LJ,
Collingham YC, Erasmus BF, De Siqueira MF, Grainger A, Hannah L,
Hughes L, Huntley B, Van Jaarsveld AS, Midgley GF, Miles L, Ortega-
Huerta MA, Peterson AT, Phillips OL, Williams SE: Extinction risk from
climate change. Nature 2004, 427:145-148.
4. Colwell RK, Brehm G, Cardelús CL, Gilman AC, Longino JT: Global warming,
elevational range shifts, and lowland biotic attrition in the wet tropics.
Science 2008, 322:258-261.
5. van Mantgem PJ, Stephenson NL, Byrne JC, Daniels LD, Franklin JF, Fulé PZ,
Harmon ME, Larson AJ, Smith JM, Taylor AH, Veblen TT: Widespread
Jin et al. BMC Plant Biology 2011, 11:35
/>Page 9 of 10
increase of tree mortality rates in the western United States. Science
2009, 323:521-524.
6. Chuine I, Beaubien EG: Phenology is a major determinant of tree species
range. Ecol Lett 2001, 4:500-510.
7. Lemmens CMHM, Boeck HJD, Gielen B, Bossuyt H, Malchair S, Carnol M,
Merck R, Nijsa I, Ceulemans R: End-of-season effects of elevated
temperature on ecophysiological processes of grassland species at
different species richness levels. Environ Exp Bot 2006, 56 :245-254.
8. Malcolm JR, Liu C, Neilson RP, Hansen L, Hannah L: Global warming and
extinctions of endemic species from biodiversity hotspots. Conserv Biol
2006, 20:538-548.
9. Vicca S, Serrano-Ortiz P, Boeck HJD, Lemmens CMHM, Nijs I, Ceulemans R,
Kowalski AS, Janssens IA: Effects of climate warming and declining
species richness in grassland model ecosystems: acclimation of CO
2
fluxes. Biogeosci Discuss 2006, 3:1473-1498.
10. De Valpine P, Harte J: Plant responses to experimental warming in a
Montana meadow. Ecology 2001, 82:637-648.
11. Zhou X, Liu X, Wallace LL, Luo Y: Photosynthetic and respiratory
acclimation to experimental warming for four species in a tallgrass
prairie ecosystem. J Integr Plant Biol 2007, 49:270-281.
12. Anyia AO, Herzog H: Water-use efficiency, leaf area and leaf gas
exchange of cowpeas under mid-season drought. Eur J Agron 2004,
20:327-339.
13. Atkin OK, Loveys BR, Atkinson LJ, Pons TL: Phenotypic plasticity and
growth temperature: understanding interspecific variability. J Exp Bot
2006, 57:267-28.
14. Atkin OK, Scheurwater I, Pons TL: High thermal acclimation potential of
both photosynthesis and respiration in two lowland Plantago species in
contrast to an alpine congeneric. Global Change Biol 2006, 12:500-515.
15. Sairam RK, Srivastava GC, Saxena DC: Increased antioxidant activity under
elevated temperatures: a mechanism of heat stress tolerance in wheat
genotypes. Biol Plantarum 2000, 43:245-251.
16. Gulen H, Eris A: Effect of heat stress on peroxidase activity and total
protein content in strawberry plants. Plant Sci 2004, 166:739-744.
17. Wahid A, Gelani S, Ashraf M, Foolad M: Heat tolerance in plants: an
overview. Environ Exp Bot 2007, 61:199-223.
18. Chaitanya KV, Sundar D, Reddy AR: Mulberry leaf metabolism under high
temperature stress. Biol Plantarum 2001, 44:379-384.
19. Yin H, Chen Q, Yi MF: Effects of short-term heat stress on oxidative
damage and responses of antioxidant system in Lilium longiflorum. Plant
Growth Regul 2008, 54:45-54.
20. Balasubramanian S, Sureshkumar S, Lempe J, Weigel D: Potent induction of
Arabidopsis thaliana flowering by elevated growth temperature. PLoS
Genet 2006, 2(7):e106.
21. Lee JH, Yoo SJ, Park SH, Hwang I, Lee JS, Ahn JH: Role of SVP in the
control of flowering time by ambient temperature in Arabidopsis. Gene
Dev 2007, 21:397-402.
22. Boyes DC, Zayed AM, Ascenzi R, McCaskill AJ, Hoffman NE, Davis KR,
Görlach J: Growth stage-based phenotypic analysis of Arabidopsis:a
model for high throughput functional genomics in plants. Plant Cell
2001, 13:1499-1510.
23. Ceulemans R, Praet LV, Jiang XN: Effects of CO
2
enrichment, leaf position
and clone on stomatal index and epidermal cell density in poplar
(Populus). New Phytol 1995, 131:99-107.
24. Teng NJ, Wang J, Chen T, Wu XQ, Wang YH, Lin JX: Elevated CO
2
induces
physiological, biochemical and structural changes in leaves of
Arabidopsis thaliana. New Phytol 2006, 172:92-103.
25. Ebell LF: Variation in total soluble sugars of conifer tissues with method
of analysis. Phytochemistry 1969, 8:227-233.
26. Vu JCV, Newman YC, Allen LH Jr, Gallo-Meagher M, Zhang MQ:
Photosynthetic acclimation of young sweet orange trees to elevated
growth CO
2
and temperature. J Plant Physiol 2002, 159:147-157.
27. Bradford MM: A rapid and sensitive method for quantitation of
microgram quantities of protein utilizing the principle of protein-dye-
binding. Anal Biochem 1976, 72:248-54.
28. Porra RJ: The chequered history of the development and use of
simultaneous equations for the accurate determination of chlorophylls a
and b. Photosynth Res 2002, 73:149-156.
29. Zacchini M, Rea E, Tullio M, de Agazio M: Increased antioxidative capacity
in maize calli during and after oxidative stress induced by a long lead
treatment. Plant Physiol Bioch 2003, 41:49-54.
30. Bates LS, Waldren KP, Teare ID: Rapid determination of free proline for
water stress studies. Plant Soil 1973, 39:205-207.
31. Beauchamp C, Fridovich I: Superoxide dismutase: improved assays and an
assay applicable to acrylamide gels. Anal Biochem 1971, 44:276-287.
32. Claiborne A: Catalase activity CRC. In Handbook of Methods in Oxygen
Radical Research. Edited by: Greenwald RA. CRC Press Inc, Boca Raton, FL;
1985:283-284.
33. Li JH, Zhang YC, Xu YY, Chong K, Wang H: Modification of indoor culture
techniques for Arabidopsis thaliana. Chinese Bull Bot 2004, 21:201-204.
34. Woodward FI, Cramer W: Plant functional types and climatic changes:
Introduction. J Veg Sci 1996, 7:306-308.
35. Franks AJ, Yates CJ, Hobbs RJ: Defining plant functional groups to guide
rare plant management. Plant Ecol 2009, 204:207-216.
36. Turnbull MH, Murthy R, Griffin KL: The relative impacts of daytime and
night-time warming on photosynthetic capacity in Populus deltoides.
Plant Cell Environ 2002, 25:1729-1737.
37. Niu SL, Li ZX, Xia JY, Han Y, Wu MY, Wan SQ: Climatic warming changes
plant photosynthesis and its temperature dependence in a temperate
steppe of northern China. Environ Exp Bot 2008, 63:91-101.
38. Wang CY, Li MS, Song JQ, Chi YG, Wang XF, Wu YF: Differences in
stomatal and photosynthetic characteristics of five diploidy wheat
species. Acta Ecol Sin 2008, 28:3277-3283.
39. Zhao CZ, Liu Q:
Growth and physiological responses of Picea asperata
seedlings to elevated temperature and to nitrogen fertilization. Acta
Physiol Plantarum 2009, 31:163-173.
40. Salvucci ME, Osteryoung KW, Crafts-Brandner SJ, Vierling E: Exceptional
sensitivity of Rubisco activase to thermal denaturation in Vitro and in
Vivo. Plant Physiol 2001, 127:053-1064.
41. Ford DM, Shibles R: Photosynthesis and other traits in relation to
chloroplast number during soybean leaf senescence. Plant Physiol 1988,
86:108-111.
42. Wang XZ, Anderson OR, Griffin KL: Chloroplast numbers, mitochondrion
numbers and carbon assimilation physiology of Nicotiana sylvertris as
affected by CO
2
concentration. Environ Exp Bot 2004, 51:21-31.
43. Robertson EJ, Leech RM: Significant changes in cell and chloroplast
development in young wheat leaves (Triticum aestivum cv hereward)
grown in elevated CO
2
. Plant Physiol 1995, 107:63-71.
44. Griffin KL, Anderson OR, Gastrich MD, Lewis JD, Lin G, Schuster W,
Tissue DT, Turnbull MH, Whitehead D: Plant growth in elevated CO
2
alters
mitochondrial number and chloroplast fine structure. Proc Natl Acad Sci
USA 2001, 98:2473-2478.
45. King AW, Gunderson CA, Post WM, Weston DJ, Wullschleger SD: Plant
respiration in a warmer world. Science 2006, 312:536-537.
doi:10.1186/1471-2229-11-35
Cite this article as: Jin et al.: The effect of experimental warming on
leaf functional traits, leaf structure and leaf biochemistry in Arabidopsis
thaliana. BMC Plant Biology 2011 11:35.
Submit your next manuscript to BioMed Central
and take full advantage of:
• Convenient online submission
• Thorough peer review
• No space constraints or color figure charges
• Immediate publication on acceptance
• Inclusion in PubMed, CAS, Scopus and Google Scholar
• Research which is freely available for redistribution
Submit your manuscript at
www.biomedcentral.com/submit
Jin et al. BMC Plant Biology 2011, 11:35
/>Page 10 of 10