báo cáo khoa học: " Seed-specific elevation of non-symbiotic hemoglobin AtHb1: beneficial effects and underlying molecular networks in Arabidopsis thaliana" doc
Bạn đang xem bản rút gọn của tài liệu. Xem và tải ngay bản đầy đủ của tài liệu tại đây (1.97 MB, 18 trang )
RESEARCH ARTICLE Open Access
Seed-specific elevation of non-symbiotic
hemoglobin AtHb1: beneficial effects and underlying
molecular networks in Arabidopsis thaliana
Johannes Thiel
1
, Hardy Rolletschek
1*
, Svetlana Friedel
1
, John E Lunn
2
, Thuy H Nguyen
3
, Regina Feil
2
,
Henning Tschiersch
1
, Martin Müller
1
, Ljudmilla Borisjuk
1
Abstract
Background: Seed metabolism is dynamically adjusted to oxygen availability. Processes underlying this auto-
regulatory mechanism control the metabolic efficiency under changing environmental conditions/stress and thus,
are of relevance for biotechnology. Non-symbiotic hemoglobins have been shown to be involved in scavenging of
nitric oxide (NO) molecules, which play a key role in oxygen sensing/balancing in plants and animals. Steady state
levels of NO are suggested to act as an integrator of energy and carbon metabolism and subsequently, influence
energy-demanding growth processes in plants.
Results: We aimed to manipulate oxygen stress perception in Arabidopsis seeds by overexpression of the non-
symbiotic hemoglobin AtHb1 under the control of the seed-specific LeB4 promoter. Seeds of transgenic AtHb1
plants did not accumulate NO under transien t hypoxic stress treatment, showed higher respiratory activity and
energy status compared to the wild type. Global transcript profiling of seeds/siliques from wild type and transgenic
plants under transient hypoxic and standard conditions using Affymetrix ATH1 chips revealed a rearrangement of
transcriptional networks by AtH b1 overexpression under non-stress conditions, which included the induction of
transcripts related to ABA synthesis and signaling, receptor-like kinase- and MAP kinase-mediated signaling
pathways, WRKY transcription factors and ROS metabolism. Overexpression of AtHb1 shifted seed metabolism to an
energy-saving mode with the most prominent alterations occurring in cell wall metabolism. In combination with
metabolite and physiological me asurements, these data demonstrate that AtHb1 overe xpression improves oxidative
stress tolerance compared to the wild type where a strong transcriptional and metabolic reconfiguration was
observed in the hypoxic response.
Conclusions: AtHb1 overexpression mediates a pre-adaptation to hypoxic stress. Under transient stress conditions
transgenic seeds were able to keep low levels of endogenous NO and to maintain a high energy status, in contrast
to wild type. Higher weight of mature transgenic seeds demonstrated the beneficial effects of seed-specific
overexpression of AtHb1.
Background
Hemoglobins (Hbs) represent a large ubiquitous group
of proteins found in all kingdoms of life [1]. In plants,
there are three major groups: (i) sym biotic or leghemo-
globins, facilitating oxygen diffusion to nitrogen-fixing
bacteria in nodules of plants (ii) non-symbiotic hemo-
globins (nsHbs) found in numerous species, and (iii) the
poorly characterized group of truncated hemoglobins
[2,3]. The nsHbs in turn are divided into class-1 (Hb1)
and class-2 (Hb2) subgroups based on phylogenetic ana-
lyses and structural/kinetic properties of the p roteins.
Hb1 has a superior affinity for oxygen and its expression
is induced during hypoxic stress [4,5]. Notably, its over-
expression in plants was shown to enable the cell to
maintain high ATP levels u nder hypoxia [6]. This find-
ing was later explained by the ability of Hb1 to detoxify
reactive nitrogen species like nitric oxide (NO) [7,8].
NO is a key signaling molecule involved in multiple
* Correspondence:
1
Leibniz-Institut für Pflanzengenetik und Kulturpflanzenforschung (IPK),
Corrensstr. 3, 06466 Gatersleben, Germany
Full list of author information is available at the end of the article
Thiel et al. BMC Plant Biology 2011, 11:48
/>© 2011 Thiel et al; licensee BioMed Central Ltd. This is an Open Access article distribu ted under the terms of the Creative Commons
Attribution License (http://creativecommo ns.org/license s/by/2.0), which permits unrestricted use, distribution, and reproduction in
any medium, pro vided the original work is properly cited.
proces ses, lik e stomatal closure, program med cell death
and pathogen resistance [9]. The level of NO rises
under hypoxia, and is related to the availability of nitrite
[4,5,10]. D espite the clear effects of Hb1 on the abun-
dance of NO, the in vivo sources of NO, its targets as
well as signaling mechanisms are still a matter of debate
[11].
Seeds of crop spe cies experience a regular oxy gen
deficiency during both development and germination
[12]. This leads to ATP limitation and subsequently, to
a restriction of high energy-demanding processes like
cell division, growth and storage product synt hesi s [13].
Oxygen limitation is in part caused by the high diffu-
sional impedance of certain seed structures. Thus, even
thetinyseedsofArabidopsis thalian a operate close to
the edge of hypoxia. Consequently, a moderate decrease
in atmospheric oxygen concentration to about half
saturation already induces clear metabolic restrictions in
Arabidopsis seeds [14]. The molecular mechanisms of
the seeds’ response to hypoxia might res emble those o f
other plant organs [15-17] and tissue types [18] of Ara-
bidopsis, but detailed transcriptomic studies are lacking.
Based on a series of in vitro experiments, we recently
proposed that the steady state level of NO in seeds acts
to integrate carbon and energy metabolism [5]. Upon
application of either NO s cavengers or NO inducing
compounds, seeds responded with alterations in both
oxygen uptake and metabolic activity evident at bot h
the transcript and metabolite level. Congruently, respira-
tory activity of isolated seed mitochondria showed clear
responses to NO/nitrite [10]. However, the extent to
which such in vitro studies mirror the in vivo situation
can always be questioned. Here, we used the non-sym-
biotic hemoglobin AtHb1 to manipulate endogenous
levels of NO in seeds. The AtHb1 (also referred to as
AtGLB1 or AHb1 in the literature) was overexpressed
under the control of the s eed-specific LeB4 promoter in
Arabidopsis thaliana. Comparative analyses of both
transcripts and metabolites were performed with wild
type (WT) and transg enic plants grown under standard
conditions as well as under moderate hypoxic stress
treatment. Results indicate that AtHb1 overexpression
led to several alterations in transcriptional and meta-
bolic networks, resulting in impro ved seed yield
(weight).
Results
Overexpression of AtHb1 is targeted to seed and
increases seed weight
We generated transgenic Arabidopsis plants expressing
the endogenous AtHb1 under the control of t he seed-
specific LeB4 promoter [19]. Northern blot analysis of
siliques from homozygous T3 plants demonstrated sig-
nificant AtHb1 expression, whereas in WT plants the
endogenous AtHb1 expression was not detectable under
standard conditions (Figure 1A; for additional transgenic
lines se e below). RT-PCR analysis showed that, overex-
pression of AtHb1 under t he control of the LeB4 pro-
moter was restricted to siliques/seeds in the transgenic
plants (minor expression in roots; Figure 1B). Compari-
son of manually isolated seeds w ith whole siliques
(including seeds) revealed that LeB4-driven expression is
mainly localized in seeds in agreement with previous
results [19]. To avoid any stress-induced artefacts that
might be induced by dissection of seeds from the sili-
ques, whole siliques were used for further studies
AtHb1 overexpression did not alter the vegetative
growth of transgenic plants. Also timing of developmen-
tal programmes, like induction of fl owering and silique
development were not affected by transgene expressio n.
Interestingly, matu re seeds of transgenic plants revealed
a higher weight (Table 1) whereas seed number and
composition were unaffected.
Overexpression of AtHb1 reduces the endogenous level
of nitric oxide in seeds
A qualitative f luorescence assay with diaminofluores-
ceine-2-diacetate (DAF-2DA) was used for detection of
endogenous NO in WT and AtHb1 embryos under stan-
dard and hypoxic stress conditions.
To induce moderate hypoxic stress in the seeds, intact
plants were treated with artificial air mixes containing
only 10.5 kPa oxygen (corresponding to half atmo-
spheric oxygen saturation) for one hour. Seeds of WT
plants showed a slight induction of AtHb1 expression
under these conditions (Figure 1C), but its expre ssion
level was still much lower than in the t ransgenic plants.
Microarray results confirmed the higher abundance of
AtHb1 mRNA in transgenics under hypoxia (>3-fold,
Figure 2A, marked by asterisk).
Under standard growth conditions, NO was not
detectable in the embryos of either WT or AtHb1 plants
using t he fluorescence assay. Possibly, the steady state
level of NO was below the detection limit of the assay.
Under moderate hypoxia , WT showed a clear f luores-
cence signal (in green), while AtHb1 overexpressors did
not (Figure 1D). This indicated strongly decreased NO
levels in the latter. Thus, the transgenic approach
resulted in lower levels of NO. The induction of AtHb1
expression (Figure 1C ) and enhanced NO emission (Fig-
ure 1D) in WT further i ndicated that the moderate
stress treatment wa s sufficient to induce hypoxia i n
seeds.
Experimental set up for microarray analysis
To assess changes i n gene expression in seeds/siliques
due to AtHb1 overexpression in detail, we focused on
line L1-1, which showed the strongest transgene
Thiel et al. BMC Plant Biology 2011, 11:48
/>Page 2 of 18
expression. Six other independent transgenic lines were
involved in further studies (see below).
WT and transgenic plants were exposed to moderate
hypoxia (10.5 kPa) or normoxia (21 kPa; control) for
one hour. Three biological replicates were used for
hybridization to Affymetrix ATH1 arrays. A cluster den-
drogram of trans cript signal intensities from the 12
arrays showed a high reproducibility of the biological
replicates from each data set (genotype+treatment), and
indicated a greater influence of the genotype than the
treatment on transcriptional profiles (Additional file
1A). Transcript analysis by qRT-PCR showed a high
correlation (R
2
= 0.83) with the microarray data, con-
firming the reliability of the data (Additional file 1B).
We compared the transcriptome of WT and AtHb1
siliques/seeds under control and hypoxic conditions, as
well as the hypoxic responses in each genotype. Differ-
entially expressed genes were extracted from the data
base by applying the following cutoffs: a fold-change of
>2 and a p-value of <0.05. A total of 1, 010 genes w ere
identified as differentially expressed in all of the com-
parisons. Differentially expressed genes were grouped
into eight clusters (Additional file 2 and 3), classified
into functional groups using the MapMan bin code [20]
and o rdered by pathways. The heat map display in Fig-
ure 2 gi ves a detailed view of the altered pathways (also
listed in Additional file 4).
To confirm that microarray data of L1-1 are reprodu-
cible in further transgenic li nes, we analyzed the expres-
sion of selected genes in six other AtHb1-overexpressing
lines by qRT-PCR (Figure 3). A set of transcripts that
have been shown in the microarray analysis to be upre-
gulated by AtHb1 overexpression was selected for qRT-
PCR analysis. All of the transgenic lines exhibited an
enhanced expression of the genes from representative
signaling, redox and metabolic pathways compared to
the WT, indicating similar expression profiles due to
AtHb1 overexpression in independent transgenic lines.
AtHb1 overexpression induces stress-related regulatory
pathways under non-stress conditions
Comparison of the transcriptome of WT and AtHb1
overexpressors under control conditions revealed multi-
ple changes (Table 2). The effects on molecular networks
involved in stress responses and signaling were particu-
larly pronounced (Figure 2A). WRKY and AP2/EREBP
transcription factors, as wel l as genes related to hormone
metabolism, i.e. abscisic acid (ABA), salicylic acid (SA)
and jasmonic acid (JA), were found to b e upregulated in
AtHb1 seeds. Moreover, many genes involved in signaling
processes, like MAPK kinases and receptor kinases, and
in redox/stress-related processes were strongly induced.
This trend was also confirmed by analysis of differentially
expressed genes for indicative over- and underrepre-
sented gene ontology categories (GO terms). Upregulated
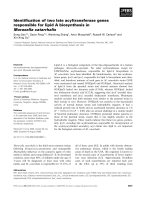
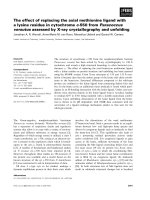
Figure 1 Effects of AtHb1 overexpression in Arabidopsis se eds. (A) Northern blot analysis of At Hb1 expression in WT and homozygous
transgenic plants (L1-1 and L1-4) at 45 DAG, 25S RNA was used as loading control. (B) RT-PCR analysis of AtHb1 expression in different tissues of
L1-1. (C) RT-PCR analysis of AtHb1 expression in siliques of WT and L1-1 under control conditions and moderate hypoxia. (D) Fluorescence
detection assay of NO using DAF-2DA. Fluorescence signals (green) indicate NO accumulation.
Table 1 Characteristics of mature seeds of WT and AtHb1-
overexpressing lines
WT Line 1-1 Line 1-4
Total lipid (% DW) 34.8 ± 3.0 36.2 ± 6.5 29.4 ± 10.2
Total protein
1
(% DW) 22.6 ± 2.0 21.4 ± 0.6 23.0 ± 1.3
Total carbon (% DW) 53.1 ± 1.4 54.9 ± 1.4 53.7 ± 1.2
Seed weight
2
(μg) 17.8 ± 3.5 23.0 ± 3.2 21.1 ± 2.3
% increase in seed
weight
100 131 ± 18 130 ± 15
Seed number per plant
3
13231 ±
2576
16851 ±
4685
15115 ±
2273
Data are means (± SD). Bold values indicate statistically significant differences
(t-test, p < 0.05).
1
calculated from total N content * 6.25
2
analysed in three generations (T3-T5)
3
calculated from seeds per pod * pods per plant
Thiel et al. BMC Plant Biology 2011, 11:48
/>Page 3 of 18
genes in AtHb1-overexpressing plants showed a strong
enrichment of GO categories involved in stress responses
(Additional file 5).
Among transcription factors, four transcripts, encod-
ing WRKY 33, 40, 53 and 75, were significantly upregu-
lated. WRKY geneshavebeenshowntoplayarolein
hypoxic responses of different cell types of Arabidopsis
[18]. Prominent differences in hormone metabolism
were observed for ABA, SA and auxin-related genes. A
strong upregulation of NCED4 was accompanied by pre-
ferential expression of transcripts enco ding ABA-
responsive proteins (At2g40170, At3g02480, At5g62490).
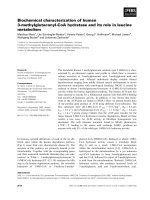
Figure 2 Heat map display of differentially expressed genes involved in regulation/redox processes and primary metabolism. Columns
indicate mean signal log2 ratios of differentially expressed genes in at least one comparison. Each comparison is arranged into vertical columns
in the following order: column 1, AtHb1 overexpression versus WT under control conditions; column 2, comparison of both genotypes under
hypoxic conditions; column 3, WT under hypoxia versus WT under control conditions; column 4, AtHb1 under hypoxia versus AtHb1 under
control conditions. Blue indicates downregulation, yellow indicates upregulation. Genes organized by pathways, (A) regulation/signaling and
stress response, (B) primary metabolism and transport. Additional file 4 contains the gene lists used.
Thiel et al. BMC Plant Biology 2011, 11:48
/>Page 4 of 18
The elevation of transcripts involved in ABA metabo-
lism/signaling is consisten t with an overrepresentation
of ABRE binding sites in the 5’-flanking regions of
AtHb1 coexpressed genes (Table 3). Auxin transport
and signaling is commonly downregula ted in trans-
genics. Fourteen genes, among them auxin transporter
(AUX1), auxin-induced genes (GH3, SAUR, IAA, ARF1)
were strongly downregulated, whereas two transcripts
encoding auxin downregulated protein ARG10 were
upregulated.
Genes implicated in signaling pathways, like receptor
kinases, wall-associated k inase 1 (WAK1, At1g21250)
and MAPK kinase 9 (At1g73500) were also upregulated
compared to WT. WAK1 is a transmembrane protein
containing a cytoplasmic Ser/Thr kinase domain and an
extracellular domain bound to the pecti n fraction of cell
walls [21], thus enabling communication between cell
wall and cytoplasm. Phosphorylation via WAKs has
been shown to play a pivotal r ole in cell wall metabo-
lism [22], which was significantly altered by AtHb1 over-
expression. WAK1 expression is induced by SA
treatment [23], thus, higher expression of WAK1 and
two S-adenosyl-L-methionine:carboxyl methyltrans-
ferases indicates an involvement of SA signaling in the
regulatory networks controlled by AtHb1. In addition,
the expression of 11 transcripts encoding receptor
kinases, such as transmembrane kinase RLK5 and other
leucine-rich repeat family proteins as well as Ser/Thr
kinases, revealed the presence of different signaling
pathways. Interestingly, RLK7 (At1g09970) has recently
been shown to be involved in the control of seed germi-
nation and tolerance to oxid ative stress [24]. Using
-0.5
0.5
1.5
2.5
3.5
4.5
ICL
MS
GS
ATPase
MnSOD
AOX1
TPS8
MAPKK9
WRKY 53
WAK1
ǻǻCt
genes
L1_4/WT
L2_3/WT
L2_9/WT
L2_11/WT
L2_15/WT
L2_16/WT
WT L1_4 L2_3 L2_9 L2_11 L2_15 L2_16
AtHb1
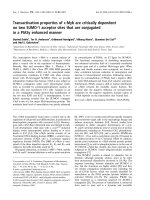
Figure 3 Transcript ratios of AtHb1-induced marker genes in different AtHb1-overexpressing lines relative to WT. AtHb1 transcript
accumulation in siliques of different transgenic lines obtained by RT-PCR is depicted in the inset. For transcript analysis siliques of 45 DAG plants
have been used. qRT-PCR analysis was conducted for genes showing a preferential expression in AtHb1 (Line 1-1) compared to WT under control
conditions as measured by microarray analysis. MnSOD (At3g56350), ICL (At3g21720), MS (At5g03860), AOX1 (At1g32350), WAK1 (At1g21250), GS
(At5g53460.), ATPase (Chl) (At1g15700 ), TPS8 (At1g70290), MAPKK9 (At1g73500), WRKY 53 (At4g23810).
Table 2 Number of differentially expressed genes
Number of genes AtHb1_control vs. WT_control AtHb1_hyp vs. WT_hyp WT_hyp vs. WT_control AtHb1_hyp vs. AHb1_control
upregulated 270 176 351 153
downregulated 205 197 62 101
Genes with log
2
signal ratios > 1 and p-values < 0.05 between WT and AtHb1-overexpressing plants under control and hypoxic conditions and after hypoxic
treatment of each genotype were extracted from the data base.
Thiel et al. BMC Plant Biology 2011, 11:48
/>Page 5 of 18
genetic approaches the authors provided evidence for a
positive correlation of RLK7 expression and enhanced
tolerance against H2O2.
Transcripts encoding pro teins involved in redox
homeostasis, such as manganese superoxide dismutase
(MnSOD, At3g56350) and two glutathione-S-trans-
ferases, were upregulat ed in AtHb1 overexpre ssors. This
was accompanied by higher expression of defence-
related prot eins, i.e. dehydrins and major latex prot eins
(MLP-related) (Figure 2A).
Ubiquitin-mediated proteolysis i s essential for plant
development and responses to env ironmental stimuli
[25]. AtHb1 induced the expression of three RING fin-
ger E3 ligases of the C3CH4-type (At4g14365,
At2g27940, At1g308 60) and two F-box proteins (SKP1/
At2g45950 and kelch repeat/At1g80 440) (Additional file
6). RING finger ligases and E3 ligases from the SKp1, F-
box (SCF) complex play an essential role in auxin meta-
bolism by degrading AUX/IAA proteins, a nd thereby
regulating concentrations of IAA [25]. This is probably
linked to downregulation of auxin transport and signal-
ing in AtHb1 plants.
AtHb1 overexpression in seeds alters expression of genes
involved in primary metabolism
AtHb1 overexpression induces various changes in tran-
scripts related to carbohydrate, cell wall, N- and lipid
metabolism, as well as potentially associated transporter
gene activities and photosynthesis. As deduced from GO
analysis of transcript data, the cell wall was the most
Table 3 Promoter motifs of differentially expressed genes
Motif (1000 bp upstream) p-value Motif (1000 bp upstream) p-value
AtHb1 vs. WT upregulated control AtHb1 vs. WT downregulated control
ABRE-like binding site motif < 10e-10 MYCATERD1 < 10e-5
ABRE binding site motif < 10e-5 AtMYC2 BS in RD22 < 10e-5
ACGT ABRE motif A2OSEM < 10e-10
ABREATRD22 < 10e-5
GADOWNAT < 10e-10
Ibox promoter motif < 10e-5
Z-box promoter motif < 10e-10
CACGTG motif < 10e-10
AtHb1 vs WT upregulated hypoxia AtHb1 vs WT downregulated hypoxia
no enrichment MYCATERD1 < 10e-7
AtMYC2 BS in RD22 < 10e-7
RY-repeat promoter motif < 10e-6
WT hyp vs WT control upregulated WT hyp vs WT control downregulated
W-box/WRKY < 10e-5 no enrichment
I-Box < 10e-7
ABRE-like binding site motif < 10e-9
ABRE binding site motif < 10e-7
ACGT ABRE motif A2OSEM < 10e-10
DRE core motif < 10e-8
DREB1A/CBF3 < 10e-6
CACGTG motif < 10e-10
GADOWNAT < 10e-10
AtMYC2 BS in RD22 < 10e-5
MYCATERD1 < 10e-5
Z-box promoter motif < 10e-7
EveningElement promoter motif < 10e-5
AtHb1 hyp vs AtHb1 control upregulated AtHb1 hyp vs AtHb1 control downregulated
EveningElement promoter motif < 10e-5 ABRE-like binding site motif < 10e-7
ABRE binding site motif < 10e-5
ACGT ABRE motif A2OSEM < 10e-9
G-box LERBC < 10e-5
GADOWNAT < 10e-9
RY-repeat promoter motif < 10e-6
Overrepresented motifs with p-values < 10e-4 were selected for comparative analysis.
Thiel et al. BMC Plant Biology 2011, 11:48
/>Page 6 of 18
affected cellular compartment in AtHb1 seeds showing a
clear underrepresentation (Additional file 5). Other
decreased biological processes are linked to cell wall
biogenesis and modi fication. This is illustrated by the
concurrent downregulation of more than 30 cell wall-
related genes encoding cellulose synthases, arabinogalac-
tan-proteins (AGPs), pectinesterases, expansins, xyloglu-
can-xyloglucosyl transferases and polygalacturonases
(see MapMan visualization, Additional file 7). This indi-
cates a strong repression of cell wall synthesis, cell wall
modification, pectin degradation, cell ex pansion and cell
wall turnove r. Two transcripts (At1g70290, At2g18700)
encoding class II trehalose-6-P synthase/phosphatase
(TPS8, TPS11) were preferentially expressed in AtHb1
plants. These transcripts are also potentially linked to
cell wall metabolism, as it was found that perturbation
of trehalose metabolism in embryos of the tps1 mutant
leads to changes in cell wall composition and thickness
[26]. Lipid metabolism also showed t ranscriptional
alterations; fatty acid elongation and desaturation were
activated but transcripts involved in squalene and ster-
oid metabolism were repressed. I n addition, transcripts
for malate synthase and isocit rate lyase (key enzymes of
the glyoxylate pathway) were upregulated in AtHb1
seeds. Furthermore, transcripts encoding the 4Fe-4S
cluster protein of photosystem I and key enzymes of the
photorespiratory pathway (glycolate oxidase/GOX,
At3g14415; serine hydroxymethyltransferase 4/SHMT4,
At4g13890) were downregulated.
Nitrogen metabolism appears to be affected in AtHb1
seeds b ased on the downregulation of nitrate reductase
2 (NIA2, At1g37130) and nitrite reductase 1 (NiR1,
At2g15620). Several transcripts involved in amino acid
metabolism differed significantly between transgenic and
WT (S-adenosylmethionine synthetase, S-adenosyl-L-
homocysteinase, asparaginase, cystine lyase, delta-1-pyr-
roline-5-carboxylate synthetase).
Several transporter gene activities were commonly
downregulated in AtHb1 seeds, namely those involved
in sugar, amino acid and oligopeptide transport (POT).
Most of these are proton-coupled transporters. In addi-
tion, five genes from different subgroups of the aqua-
porin family were dow nregulated. These genes play a
role in nutrient flow and/or are implicated in remobili-
zation [27,28].
Changed gene interactions due to AtHb1 overexpression
point to alterations in cell wall metabolism
To infer gene-to-gene interactions we used the MRNET
approach which extracts statistical dependencies between
genes [29]. The reconstructed network of gene interfer-
ence for the top 20 genes that are differentially expressed
between WT and AtHb1 overexpressing seeds under
control conditions showed clear differences (Additional
file 8). In WT, the gene encoding fasciclin-like arabinoga-
lactan protein 13 (FLA13; At5g44130) was the central
hub. AGPs, such as FLA13, play a role in plant cell elon-
gation/cell wall biogenesis, and are assumed to act as sig-
nal molecules [30]. Proteins containing fasciclin domains
have also been shown to function as adhesio n molecules
in a broad spectrum of organisms [31]. There were multi-
ple interactions of this hub with genes encoding proteins
localized to the cell wall (e.g. xyloglucan:xyloglucosyl
transferase, xyloglucan endotransglycosylase 3 (XTR3),
proline-rich protein 2 (ATPRP2) and acid phosphatase
class B family protein) o r otherwise involved in extracel-
lular matrix modifications (e.g. midchain alkane hydroxy-
lase, which is involved in cuticular wax biosynthesis;
[32]). Most of t he genes are implicated in stress-
responses and related to hormone (ABA, GA) action.
Overexpressi on of AtHb1 directly or indirectly perturbed
the strong multiple interactions of the hub gene FLA13,
shifting the main regulatory point to ATPRP2.Ithas
been shown, that ATPRP2 is one of the key genes
involved in cell specification [33]. Cell specification in the
embryo might be coupled to maturation processes, which
are characterized by high storage- but extremely low
mitotic-activity. Downregulated expression of ATPRP2
(and associated genes) in AtHb1 plants might therefore
indicate decelerated cell specification and thus, an
extented growth phase.
Evaluation of adaptive stress responses in wild type
seeds
Most of the a daptive responses in WT seeds have also
been described for shoots and roots of Arabidopsis
plants. Mustroph et al. [18] identified a core set of 49
translated hypoxia-induced mRNAs in 21 diffe rent Ara-
bidopsis cell populations. From this core set, 35 genes
(~70%) were also found to be upregulated in seeds, indi-
cating similar adaptation strategies to hypoxia regardless
of tissue/organ id entity. The possible indu ction of th e
glyoxylate cycle in combination with lipid degradation
(phospholipase C, phosphodiesterase) was not obs erved
in other Arabidopsis tissues and might therefore be
seed-specific. The induction of the glyoxylate cycle
could represent an alternativ e mechanism to generate
sugars and sustain energy supply under unfavourable
conditions in seeds. Interestingly, malate synthase and
isocitrate lyase are also enhanced in carbon-starved
cucumber cotyledons [34]. The higher expression of
genes involved in sugar, amino acid, o ligopeptide and
general nutrient (aquaporins) transport in WT (column
2 in F igure 2B) and the significantly reduced sucrose
concentrations (see below) indicates nutrient, particu-
larly sugar, depletion in WT upon hypoxia.
In general, WT seeds showed a strong transcriptional
and metabolic response to moderate hypoxia.
Thiel et al. BMC Plant Biology 2011, 11:48
/>Page 7 of 18
Metabolism and signaling of hormones (ABA, ethylene,
JA, SA and GA) which are described to be important
triggers in response to oxidative stress [15,16] are
strongly induced in seeds. Activation of specific tran-
scription factors and signaling pathways nicely illustrates
a cross-talk of hormone action and regulatory pathways,
particular for ethylene. Upregulation of MAPKK9,
MAPK3 (At3g45640) accompanied by activation of ACC
oxidase1 (At2g19590) as well as ten members of the
AP2/EREBP family represents an example how signal ing
cascades are linked together in adaptive stress responses.
Experiments with maize suspension cultures showed a
correlation of varying class-1 hemoglobin levels and
changed NO concentrations with ethylene formation
[35]. Enhanced ethylene biosynthesis under hypoxia is
linked to lower hemoglobin expression, coinciding with
the stro nger induction of ethylene synthesis and signal-
ing in the WT compared to the AtHb1 plants in our
experiments. Beside the strong activation of several
WRKY transcription factors and MYB44 (At5g67300),
transcripts related to redox regulation were clearly
induced. Rising concentrations of H2O2 in WT upon
hypoxia correlate with transcriptional activation of sev-
eral ROS generating/scavenging enzymes coinciding
with other studies [36,37]. The upregulation of several
class II TPS genes and the reduction of trehalose-6-P
(T6P) levels was part of the hypoxic response in WT
(two of them are also induced in transgenics under con-
trol conditions). Interestingly, T6P metabolism was
identified as being part of a hypoxic response that is
conserved in some pro- and eukaryotes [38]. T6P may
be involved in coordination of carbon partitioning
between primary metabolism and cell wall synthesis
[39]. Therefore, altered expression of TPS genes -
together with changes in cell wall metabolism - accentu-
ates the possible role of T6P metabolism in regulation
of carbon partitioning. In general, the alte rations in reg-
ulatory and metabolite pathways provide a framework of
seed-specific responses to hypoxia.
AtHb1 overexpression attenuates transcriptional stress
responses
Under hypoxic stress treatment, a significantly lower
number of transcripts exhibited altered expression in
AtHb1 compared to WT (254 and 413 genes, respec-
tively). Consequently, t he stress response observed in
AtHb1 was much reduced, especially in regulatory/sig-
naling pathways, but also for specific pathways in pri-
mary metabolism. Transcriptional alterations in WT
upon hypoxia partly shared a commonality with those
induced by AtHb1 overexpression under control condi-
tions, or with transcripts additionally induced in AtHb1-
overexpressing plants after hypoxia (Figure 4). The mod-
erate hypoxic re sponse in seeds of transgenic plants, in
combination w ith genes induced by AtHb1 overexpres-
sion that have been shown to be implicated in the WT
hypoxia response, points to a kind of “pre-adaptation”
to oxidative stress. Among the differences between the
two genotypes in their hypoxic responses, several biolo-
gical processes stand out, namely, stress-related signal-
ing, redox pathways and primary/energy metabolism
(Figure 2, Additional file 4). These differences are dis-
cussed in detail below.
First, hypoxia induced stress-related signaling and
redox pathways in WT. GO analysis for functional
assignments of upregulated genes showed strong overre-
presentation of responses to abiotic/biotic stress and
other biological processes relate d to stress res ponses,
especially responses to ABA and JA. Evaluation of pro-
moter motifs within the 5’ -flanking regions of hypoxia-
induced genes revealed that W-box, ABRE, DREB, G-
box, MYC2, MYCATERD1, GADOWNAT, Z-box, I-box
and E vening Element motifs were significantly overre-
presented. This finding is significant because almost all
E
n
h
ance
d
0
15452
WT-hypoxia
AtHb1-hypoxia
85
16
148
102
AtHb1/WT
-
normox
351
153
272
Repressed
0
181
97
0
AtHb1-hypoxia
101
AtHb1/WT-
normox
205
WT-hypoxia
4
0
34
24
6
2
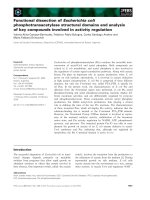
Figure 4 Venn diagrams showing overlap of differentially
expressed genes due to AtHb1 overexpression and genes
involved in the hypoxic response of WT and/or AtHb1 plants.
Overlap of differentially expressed genes was identified using the
Venn Super Selector of the web-based tool BAR (any.
utoronto.ca/).
Thiel et al. BMC Plant Biology 2011, 11:48
/>Page 8 of 18
of these recognition sites have been implicated in hor-
mone signaling (ABA, ethylene) and in general stress
responses. In additi on to these changes in hormone sig-
naling pathways, transcripts directly involved in bio-
synthesis of ABA, ethylene, JA and SA were commonly
upregulated in WT. In contrast genes related to SA, GA
and ABA metabolism were not induced by hypoxia in
AtHb1 plants. In fact, a strong repression of ABA synth-
esis/signaling was evident from the down regulation of
NCED4 and several ABA-responsive genes, among them
ATEM6 and AtHVA22b (which were already induced
under contr ol conditions by AtHb1 overexpression). In
addition, ABRE binding site motifs were enriched in the
set of downregulated genes in AtHb1 plants after
hypoxia (Table 3). Another striking difference between
the genotypes is the opposite regulation of transcripts
encoding the gibberellin regulated proteins 2 and 3
(GASA 2, 3); they are highly upregulated in the WT
after hypoxic treatment whereas a strong repre ssion was
observed in transgenic seeds. Calcium signaling seems
to play a role in the hypoxic response of WT, as indi-
cated by the upregulation of six transcripts encoding
calmodulins and calmodulin binding proteins, accompa-
nied by an induction of calcium dependent protein
kinase and the plastidic Ca
2+
-ATPase1 (ACA1,
At1g27770). The transcriptional activation o f calmodu-
lins which are the primary calcium receptors in plant
cells and calcium binding proteins, could serve as sub-
strate for phosphorylation by calcium dependent protein
kinases, then activating transcription factors by phos-
phorylation. Altogether this points to existing calcium
dependent signaling pathways in the hypoxia response
in wild type seeds, which were not observed in AtHb1
overexpressors.
ThesecondmajordifferencebetweenAtHb1-overex-
pressing pla nts and WT concerned primary and energy
metabolism. Hypoxia induced multiple changes in tran-
scripts related to these processes in WT, but only m od-
erate changes in AtHb1 plants. For example, in WT we
encountered a clear induction of glycolysis and fermen-
tation (FBP aldolase, PFK, PDC1, ADH1) as well as
strongly induced nitrogen assimilation as suggested by
preferential expression of NIA2 and NiR1.InWT,cell
wall metabolism was downregulated as evidenced by
repression of six transcripts encoding pectinesterases
and four encoding polygalacturonases, indicating that
cell wall metabolism is one of the key processes affected
by hypoxia. Induction of carbonic anhydrases and genes
implicated in lipid degradation and the glyoxylate cycle
(malate synthase, isocitrate lyase) w as apparent in the
WT response but not in AtHb1 plants. T he activity of
transporter genes is directly linked to primary metabo-
lism. The strong induction of genes encoding proline
transporter, POT as well as TIP1.2 and TIP3.2 is also
restricted to the hypoxia response in WT and might
reflect a higher demand for remobilizing storage com-
pounds and thus, indicating nutrient dep letion in W T.
The alterations observed in the transgenic plants were
restricted to upregulation of glycolysis/fermentation
(PFK, PDC1, ADH1) and a few transcripts related to cell
wall degradation.
AtHb1 plants show less pronounced metabolic
adjustment under transient hypoxia
The steady state level of amino acids, sugars, metabolic
intermediates and H2O2 were measured in seeds/sili-
que s of both geno types under control and hypoxic con-
ditions. Under control conditions, the levels of
phosphoglycerate and ADP-glucose (starch precursor)
were higher in WT versus AtHb1 plants, while sucrose
and UDP-glucose (cell wall precursor), showed elevated
levels in AtHb1 plants (Figure 5, values are given in
Additional file 9). Remarkably, the levels of many meta-
bolites changed after hypoxic treatment in WT but were
barely altered in AtHb1 plants. In WT p lants only, the
levels of T6P and sucrose dropped significantly, while
pyruvate increased (indicative of e nhanced glycolytic
flux and/or a partial block of the TCA cycle). Alto-
gether, the metabolite profiles of the two genotypes illu-
strated a strong metabolic adjustment in WT in
response to moderate hypoxia, whereas in AtHb1 only
marginal changes were detected. This differential
response was clearly visualized using principal compo-
nent analysis (PCA; insert in Figure 5). Transcript data
hinted at shifts in ROS metabolism in transgenic plants
and in the hypoxic response of WT. Measurements of
H2O2 levels in both genotypes under control and
hypoxic conditions are consistent with transcriptional
activities of H2O2 generating and scavenging enzymes.
Higher concentrations in AtHb1 seeds/siliques com-
pared to WT under control conditions (Figure 6A) cor-
relate with preferential expression of MnSOD1 and
glutathione-S-transferases. Upon hy poxia, H2O2 levels
in WT increased but were unchanged in AtHb1 seeds.
Activation of respiratory burst oxidase homologue D,
MnSOD1, redoxins, three glutathionine-S-transferases
and alternati ve oxidase 1D (AOX1D, At1g32350) in WT
indicates an enhanced ROS metabolism under hypoxia.
Overexpression of AtHb1 promotes respiration and
maintains the energy status under transient hypoxia
To investigate changes in energy metabolism we mea-
sured the respiratory activity of devel oping seeds. Under
control conditions respiration rates were similar in both
genotypes (1.7 ± 0.2 pmol/µg embryo min). However,
under hypoxia, respiration in AtHb1 plants (line 1-1,
1.05 ± 0.14 pmo l/µg min) was about 40% higher than in
WT (0.73 ± 0.13 pmol/µg min) pointing to a higher
Thiel et al. BMC Plant Biology 2011, 11:48
/>Page 9 of 18
*
a
*
a
*
a
*
a
*
a
*
a
*
a,b
*
a
*
a
*
a
*
a
*
a
*
a
*
a
*
a
*
a
*
a
*
a
*
a
*
a
*
a
*
b
*
a
*
a
*
a
*
a
*
a
*
a
*
a
*
a
*
a
*
b
*
a
*
a
*
b
*
b
*
b
*
b
*
b
*
b
*
b
*
b
*
b
*
b
*
b
*
b
*
b
*
b
*
b
*
b
*
b
*
b
*
b
*
b
*
b
*
b
*
a,b
*
a,b
*
a,b
*
b
*
b
*
a,b
*
a,b
*
b
*
b
*
b
*
b
*
a,b
*
a,b
*
a,b
*
a,b
*
b
*
b
*
a,b
S6P
Figure 5 Metabolite patterns in seeds of AtHb1-overexpressing and WT plants under control conditions (21 kPa O2) and moderate
hypoxia (10.5 kPa O2) visualized by VANTED software [75]. “*a” indicates statistically significant differences after hypoxic treatment in each
genotype, “*b” indicates statistically significant differences between the genotypes under control and hypoxic conditions (t-test, p < 0.05). Mean
values ± standard deviation are presented (data in Additional file 9). The insert shows results of a principal component analysis of the metabolite
data set. 20 samples in two dimensional space are given, where the names are coloured according to the 4 different sample types (WT and
AtHb1, under either control or hypoxic conditions; with 5 biological replicates each).
Thiel et al. BMC Plant Biology 2011, 11:48
/>Page 10 of 18
energy supply in the former. Indeed, both the adenylate
energy status (AEC = (ATP+0.5ADP)/(ATP+ADP
+AMP)) and total ATP levels were elevated in AtHb1
versus WT under hypoxia (Figure 6B-C).
Direct comparison of microarray data from the two
genotypes under hypoxic conditions identified only the
gamma-subu nit of t he chloroplast ATPase to be signifi-
cantly upregulated in AtHb1 seeds. Screening our data-
set for other differentially expressed transcri pts involved
in electron transport chain/ATP synthesis, we found five
other transcripts, encoding ATP synthase, NADH dehy-
drogenase, NADH:ubiquinone o xidoreductase, cyto-
chrome C oxidoreductase subunit 5c (COX 5C), with a
tendency to higher expression in AtHb1 seeds under
hypoxia (fold-changes between 1.4 and 1.64 and p-
values < 0.05). These transcripts were found by qRT-
PCR analysis to be nearly doubled in the AtHb1-overex-
pressing plants compared to WT (Figure 6D). Alto-
gether, our data suggest that AtHb1 overexpression
enables the seed to respire a t higher rates especially
under hypoxia, thereby increasing the ATP supply.
Discussion
Although non-symbiotic Hbs have been widely used in
plants to improve tolerance against different stresses,
and overexpression of plant Hbs showed beneficial
effects on energy status and growth under oxygen lim-
itation [3,6,7], global information about the molecular
mechanisms of AtHb1 function is missi ng. In this study,
we present the first analysis of the underlying molecular
mechanisms of AtHb1 function and signaling. The
hypothetical model deduced from transcriptome, meta-
bolite and physiological analyses summarizes the main
effects of AtHb1 overexpression in seeds (Figure 7). Two
different aspects should be considered when AtHb1 is
overexpressed in seeds. First, under normal growth co n-
ditions the AtHb1 gene is barely expressed and thus, its
ove rexpression itself might affect seed metabolism. Sec-
ond, non-symbiotic hemoglobins, such as AtHb1,are
able to degrade endogenously formed NO [7,8], which
itself can act as a signal molecule. Thus, perception of
the nitric oxide level in the seed might be altered due to
the enzymatic scavenging of NO.
AtHb1 overexpression induces stress-related signaling
pathways and limits energy-consuming pathways
Under control conditions, AtHb1 overexpression acti-
vated several stress-related hormonal and signaling path-
ways. The fact that hormones and other components of
signal transduction cascades work downstream of AtHb1
suggests that AtHb1 represents a h igh ranking signaling
component with broad impact on regulatory networks.
Most prominent was the induction of ABA synthesis/
signaling, and the general repressi on of auxin transport/
140
WT L 1-1 L 1-4
0.0
0.2
0.4
0.6
0.8
WT L 1-1 L 1-4
AEC
ATP
AEC
*
*
C
0
1.0
B
40
60
80
100
120
ATP (nmol/g)
ROS
*
5
10
15
20
25
30
ROS (nmo/g)
control
hypoxia
A
*
0
20
40
WT L 1-1 L 1-4
3
relative expression
0
1
2
3
12
3
4
5 6
7
WT_hyp
AtHb1_hyp
genes related to ATP synthesis
D
Figure 6 Effects of AtHb1 overexpression on energy
metabolism of seeds. Plants were grown under control
conditions and moderate hypoxia. (A) Levels of hydrogen
peroxide (H2O2), (B) Adenylate energy charge (AEC) and (C) ATP
levels. (D) Relative expression levels of genes involved in ATP
synthesis quantified by qRT-PCR after hypoxic treatment. 1 - ATPase
(At2g21870), 2 - ATPase (Chl) (At1g15700), 3 - NADH-DH
(At5g47890), 4 - NADH:ubi (At5g18800), 5 - COX5C (At5g61310), 6 -
COX5C (At3g62400), 7 - AOX1 (At1g32350). Mean values ± standard
deviation are presented (n = 5); asterisks indicate statistical
significant differences according to a student’s t-test (p < 0.05, A-C).
Thiel et al. BMC Plant Biology 2011, 11:48
/>Page 11 of 18
signaling. Evidence for induced ethylene and SA signal-
ing came from induced MAPKK and WAK1-mediated
signaling routes.
ROS formation also seems to be part of the AtHb1
signaling cascade as transcripts involved in formation
and detoxification of H2O2 were clearly upregulated.
Higher H2O2 levels in AtHb1 seeds confirmed the tran-
scriptional activities. Th e pronounced upregulation of
these stress-related signaling pathways might act in
combination to “pre-adapt” the seeds t o hypoxic stress.
A role for plant non-symbiotic hemoglobins in redox
regulation by improving the antioxidant status was pre-
viously hinted at by studies of alfalfa root cultures over-
expressing a non-symbiotic hemoglobin [40]. Hb1-
overexpressing lines revealed increased ascorbate levels
as well as higher activity of enzymes involved in ROS
removal. An enhanced oxidative stress tolerance during
seed germination of Arabidopsis was induced by seed-
specific o verexpression of antioxidant genes [41]. Over-
expression of MnSOD and/or combination with other
genes encoding antioxidant enzymes during seed devel-
opment and germination increased tocopherol contents
and antioxidant capacities in mature seeds i ndicating
beneficial effect s of activated redox-related pathways on
oxidative stress tolerance.
Alterations in transcripti onal networks were accompa-
nied by changes in primary metabolism. Cellulose synth-
esis, deposition of pectin fragments, incorporation of
arabinose-derived sugars a nd glycosyl-transferring reac-
tions all require energy and use activated nucleotide
sugars. Thus, cell wall metabolism i s clearly dependent
on the energy and carbon status of cells. The decrease
in transcripts related to cell wall metabolism in AtHb1
plants was the most prominent finding. The analysis of
gene-to-gene interactions (MRNET approach) indicates
that AtHb1-mediated downregulation of the hub gene
FLA13 is of central importance for the proposed
changes in cell wall metabolism. Its downregulation
might eventually affect ce ll elongation, energy usage and
carbon partitioning. Downregulation o f cell wall meta-
bolism might represent a major strategy to reduce
energy (as well as carbon) consu mption. Higher concen-
trations of UDP-glucose (precursor f or cell wall synth-
esis) and sucrose support this idea.
Consistent with such energy saving adjustments is the
transcriptional repression of proton-coupled transpor-
ters and photorespiration. Both require energy in the
form of ATP, and thus, their repression implies a reduc-
tion in energy consumption. Another striking feature
was the downregulation of NIA2 and NiR1 by AtHb1
overexpression under control conditions. While this
might in dicate lower nitrate assimilation (which imposes
a high energy demand), the level of free amino acids
was not reduced in transgenic seeds but rather elevated.
The shift in NIA2/NiR1 expression could also be linked
to NO signalling, because NIA can produce NO from
AtHb1
Signalling
Receptor
kinase
MAPKK
Transcription
WRKY
AP2/EREBP
ABA SA ethylene auxinĻ
Redox
(Mn)SOD
Glu-S-Transf
H
O
Protein
degradation
C3CH4/
RING finger
+
hypoxia
WAK1
T6-P
Restriction of energy consumption
reduction of cell wall metabolism, photorespiration, nitrogen
assimilation, proton-coupled transporter activity
H
2
O
2
AOX1
RING
finger
F-box
Maintainance of
respiration and
energy status
Reduction
NO levels
Figure 7 Hypot hetical model of pathway s coordinated by AtHb1 overexpression and its effects on hypoxic stress responses.
Differences compared to WT as deduced from transcriptome, metabolite and physiological analyses are highlighted.
Thiel et al. BMC Plant Biology 2011, 11:48
/>Page 12 of 18
nitrite [42-44]. High NO concentrations correlate with
NIA activation and high nitrite levels [45,46]. Genetic
studies using the nia1nia2 double mutant indicate that
NIA is a major enzymatic source of NO formation in
plants [47]. Subsequently, the coordinated downregula-
tion of NIA2/NiR1 due to AtHb1 overexpression could
prevent the accumulation of nitrite and subsequent NO
formation. This would contribute to the lower steady
state NO levels in the transgenics ( beside the NO
scavenging function of AtHb1).
Transcripts encoding key enzymes of photorespiration
(GOX, SHMT4) were downregula ted by AtHb1 overex-
pression. Photorespiration results in a net loss of fixed
carbon and energy. The a pparent repression of this
pathway is a further indication for the energy-saving
mode of metabolism. The preferential expression of the
b-carbonic anhydrase1 in WT might also be related, as
this enzyme is known to control CO2 availability to
Rubisco and thereby regulate photorespiration [48,49].
Overall, alterations in the metabolism of AtHb1-over-
expressing seeds point to an energy-saving mode of
metabolism.
NO formation and signaling pathways are repressed by
AtHb1 overexpression resulting in improved respiration
under stress
AtHb1-overexpressing seeds showed a much attenuated
hypoxic response, with only some of the characteristic
pathways being induced under hypoxia (e.g. enhance-
ment of ethylene signaling, JA metabolism, redox-related
transcripts and MYB transcription factors). Of particular
note is the repression of the ABA response in the
AtHb1 overexpressors, which contrasts with the strong
induction observed in WT plants. Major differences
were also obvious in calcium-dependent and GA-
mediated signaling pathways. Both seem to play a much
less significant role when compared to WT (e.g.
GASA2/GASA3 showed the opposite responses in the
two genotypes). Similarly, at the metabolite level, only
minor alterations were apparent in response to hypoxia
(in contrast to WT).
Another major difference in the hypoxic response of the
two genotypes was the reduction of NO levels in AtHb1-
overexpressing seeds. This agrees with previous findings
[4,50] and could be attributable to AtHb1-mediated degra-
dation of NO [7] and/or the restriction of NO formation
via transcriptional downregulation of NIA2/NiR1. As
AtHb1 overexpression represse s NIA2 and NiR1 activity
under control conditions and especially after hypoxia
treatment it could be concluded that NO formation is
strictly prevented by the reduction of NO precursors (e.g.
nitrite). Studies from Wang et al. [51] provided evidence
that NIA2 is responsible for stress-induced NO formation
in Arabidopsis roots. They demonstrated that NIA2 is
phosphorylated by MAPK6 leading to an increase of NR
activity and subsequently NO formation. MAPK3 also
interacted with NIA1 and 2 in the yeast two-hybrid system
implying a role for activation of NIA activity. The tran-
scriptional upregulation of MAPK3 and NIA2 in WT
seeds after hypoxia is in agreement with this finding. Pos-
sibly MAPK3 represents a seed-specific transducer of
environmental stimuli whereas MAPK6 is predominantly
involved in NO biosynthesis in roots. Assuming that over-
expression of AtHb1 lowered levels of NO in planta, the
present approach enabled us to discriminate between the
more general hypoxia response and the target genes speci-
fically induced by higher NO levels in WT. The direct
comparison of the transcriptome of both genotypes under
hypoxic conditions (Figure 2, column 2) revealed differ-
ences which might be specifically attributed to NO signal-
ing. Calcium signaling is linked to NO signaling pathways
[52,53] and possibly directly involved in the regulation of
hemoglobin expression [54]. NO induces a rapid increase
in calcium concentrations [55,56], and vice versa [53].
This relationship was found in transgenic plants, where
both NO levels and calcium-dependent signaling were
loweredcomparedtoWT.HintsforacrosstalkofNO
and GA signaling came from studies with isolated aleur-
one cells of Arabidopsis. Bethke et al. [57] showed that
NO works upstream of GA i n a signaling pathway, sup-
porting our results that GA is possibly linked to higher
NO levels in WT. NO-responsive genes in Arabidopsis
were identified by microarray analyses using the synthetic
NO donors SNP and NOR-3 [58,59]. Among them genes
involved in calcium signaling (calmodulins, calcium bind-
ing proteins), sugar and peptide transporters as well as gly-
cosyltransferases which are preferentially expressed in the
WT under hypoxic conditions. Based on our genetic
approach we can separate these transcripts from tran-
scripts of stress-related pathways (which are part of the
hypoxia response without NO synthesis/accumulation).
According to our working hypothes is, lower NO levels
in AtHb1-overexpressing seeds were expected to stimulate
respiration because NO inhibits cytochrome C oxidase
[60,61]. In fact, seeds of the transgenic plants retained
respiratory activity as well as higher expression of COX 5C
transcripts under hypoxia, whereas the WT switched to a
“ stress” mode. Congruently, there was a preferential
expression of other genes related to electron transport
chain/ATP synthesis in AtHb1 plants. Combined with
repression of energy -demanding processes (e.g. ce ll wall
metabol ism) this ev entually leads to an improved energy
status of cells in AtHb1-overexpressing seeds.
Conclusions
According to our previous hypothesis [5,10], NO inte-
grates energy and carbon metabolism, enables the seed
to balance its oxygen demand and to avoid self-anoxia.
Thiel et al. BMC Plant Biology 2011, 11:48
/>Page 13 of 18
AtHB1 overexpression and/or the subsequent decli ne in
endogenous NO levels set the seed in a state of ‘alarm’.
This is characterized by changes in hormone metabo-
lism, induction of specific signaling p athways and tran-
scription factors, targeted protein degradation and
changes in redox-related pathways. These alterations
resulted in repression of energy-demanding processes,
particular in cell wall metabolism, reflecting the pre-
adaptation to (hypoxic) stress. Thus, the protective role
of AtHb1 overexpression can be regarded as a positive
stress (tential ‘eustress’). This became even more evident
upon stress treatment where seeds of transgenics
showed an attenuated stress response. AtHb1 overex-
pression enabled the seed to respire at higher rates,
which was likely related to the reduction of endogenous
NO levels, and helped to maintain the energy status of
cells under stress. These properties might be beneficial
for daily life, because seed development is prone to reg-
ular oxygen deficiency and the day/night transition
causes strong fluctuations in the seeds’ oxygen status
[12]. Such transient stress conditions occur daily and
necessitate the adjustment of respiratory activity and
metabolism. Subsequently, pre-adapted transgenic seeds
might have advantages under “ normal” growth condi-
tions, driving metabolism more energy-efficient, and
eventually accumulating higher seed biomass.
Methods
Generation of transgenic plants, growth conditions and
treatment
The coding region of AtHb1 (At2g16060) was PCR-
amplified (F-
GGATCCGAGGTTGTGAAATATTATG-
GAG and R-
GGATCCTAGGATTTTGGAATGCA-
CACTA BamHI sites underlined) using a full-length
AtHb1 clone (kindly provided by P. Geigenberger, LMU
Munich, Germany). After subcloning into the pCR4-
TOPO vector, AtHb1 was introduced into the modified
binary vector pBAR between the LeB4 promoter [19]
and OCS terminator. After sequencing, the construct
was mobilized in Agrobacterium tumefaciens EHA105
and used for transformation of Arabidopsis thaliana
Col-0 plants by floral dipping [62]. Homozygous plants
were selected on phytagar plates with ½ Murashige and
Skoog medium [63] suppleme nted with phosphino thry-
cin (50 µg ml-1) a nd characterized by Southern blot
analysis. Plants were g rown at 22°C under a 16/8-h
photoperiod, with a relat ive air humidity of 60% and an
approxim ate light intensity of 100-150 µmol photons m
-
2
second
-1
.
Hypoxic and normoxic treatments were carried out
with transgenic (T3) and WT plants 45 days afte r ger-
mination (DAG) corresponding to the mid phase of
maturation ~11/12 d ays after pollination. Plants were
aerated with a gas mixture containing 10.5% O2
(composed of a 1:1 mixture of ambient gas and N2) or
ambient gas containing 21% O2 for control samples in
darkness. After one hour, plants were decapitated and
immediately frozen in liquid N2. About 70-80 siliques of
the same developmental stage were dissected in liquid
nitrogen and pool ed for one biological replicate. Both
hypoxic and control treatment runs were repeated twice
to provide biologically replicated samples. From the
pool of biological replicates sample mate rial was used
for microarray and metabolite analyses.
Northern blot and RT-PCR analysis
Isolation of total RNA fro m siliques/seeds was per-
formed according to Heim et al. [64] . For northern blot
analysis, 10 µg total RNA were b lotted on nylon mem-
brane (Hybond-N+, Amersham) and hybridized with a
[
32
P]-labelled 635-bp fragment of Arabidopsis AtHb1
cDNA. A 25S rDNA fragment was used as loading
control.
For cDNA syn thesis, isolated total RNA was treated
withRNAsefreeTURBODNase(Ambion)and1µg
RNA was reverse transcribed using oligo(dT) primer
and SuperScript III reverse tanscriptase (Invitrogen,
Karlsruhe, Germany). Gene-specific primers for AtHb1
were used in the PCR reactions.
RNA preparation and microarray hybridization
Total RNA was isolated from intact siliques using a
GENTR A kit (Biozym, Germany) according to the man-
ufacturer’s instructions. RNA was further purified using
an RNeasy Kit (Qiagen) and subjected to DNAse diges-
tion (Qiagen). Total RNA was quantified using a Nano-
Drop ND-1000 UV-Vis spectrophotometer (Nanodrop
Technology) and RNA quality was assessed using an
Agilent 2100 Bioana lyzer (Agilent Tech nology). Three
independent biological replicates of each genotype (WT,
AtHb1) and treatment (hypoxia, control) were hybri-
dized to Affymetrix ATH1 Arabidopsis GeneChips (n =
12). Preparation of labelled cRNA and hybridization of
oligonucleotide chips was performed at the Deutsches
Ressourcenzentrum für Genomforschung (Germany).
Data analysis
Data were processed with the Affymetrix MicroArray
Suite software package (MAS 5.0) and the resulti ng CEL
files were analyzed using Bioconductor packages (http://
www.bioconductor.org/) in R (.r-project.
org/). Data were normalized using the Robust Multi-
array Average (RMA) method [65]. Analysis of differen-
tially expressed genes in the different comparisons was
performed with the LIMMA package using the RMA
normalized expression values [66]. The Benjamini and
Hochberg method was selected to adjust p-values for
multiple testing and to determine false discovery rates
Thiel et al. BMC Plant Biology 2011, 11:48
/>Page 14 of 18
(FDRs) [67]. Genes were deemed to be differentially
expressed only when (1) calculated p-value was < 0.05,
(2) mean of the signal log2 ratio was > 1, and (3) signal
intensities of probe sets from at least t wo of the three
biological replicates were designated as “present” calls in
the PMA analysis. Genes differentially expressed in all
of the comparisons (i.e. in at least one of the four com-
parisons) were used as data sets for the subsequent clus-
tering and gene category analyses.
K-means clustering was performed by means of the
TMeV software package using log2 signal ratio data.
The MapMan visualization tool was used for functional
characterization of differentially expressed genes.
Enrichment analysis of Gene Ontology (GO) terms for
differentially expressed genes was performed as in
Horan e t al. [68]. For identification of conserved motifs
in the promoters of differentially expressed genes the
online tool Athena (.
edu/cgi-bin/Athena/cgi/analysis_select.pl) was used with
the default settings.
All microarray data from this study have been depos-
ited in NC BI Gene Expression Omnibus (accession
number GSE23846).
Reconstruction of the gene regulatory network
Inf erring regulatory networks from microarray data was
done based on the information theoretic approach
MRNET (package minet Bioconductor/R) using the top
20 of differentially expressed genes (given in Additional
file 10). MRNET is based on the maximum relevance/
minimum redundancy algorithm. The algorithm starts
with computing the pairwise mutual information (MI)
between all gene pairs. The resulting MI matrix is then
manipulated t o identify regulatory relationships and to
reduce the number of false positives.
Quantitative Real-Time PCR
RNA preparations from microarray experiments were
used f or cDNA synthesis (see above). The Power SYBR
Green PCR mastermix was used to perform reactions in
an ABI 7900 HT Real-Time PCR system (Applied Bio-
systems, CA, USA). Data were analyzed using SDS 2.2.1
software (Applied Biosystems). Five replicate measure-
ments were conducted for each gene. Expression values
were normalized with transcript levels of the actin 2
gene (At3g18780) and calculated as a n ari thmetic mean
of the replicates. Dissociation curves confirmed the pre-
sence of a single amplicon in each PCR reaction. Log2
fold-changes were calculated after Livak and Schmittgen
[69]. Efficiencies of PCR reactions were determined
using LinRegPCR software (e-quantifica-
tion.de/download.html). A list containing primers for
the tested genes is given in Additional file 11.
Fluorescence detection assay for nitric oxide in embryos
Analysis of NO levels was done using DAF-2DA fluores-
cence detection [70]. Freshly isolated Arabidopsis
embryos were incubated in 1 ml buffer solution contain-
ing: 50 mM sucrose, 10 mM KCL, 0.1 mM CaCl2, 10
mM MES-Tris (pH 5.6) and 50 µM DAF-2DA (Calbio-
chem, Germany). The buffer was aerated with 15 µM
oxygen. After 1 h incubatio n, embryos were rinsed with
fresh buffer to remove excess fluorophore. Fluorescence
was analyzed using a laser scanning confocal microscope
(510 Meta, Carl Zeiss, Jena, Germany).
Respiratory oxygen uptake
About 100 Arabidopsis seeds were incubated in 2 ml
buffer (100 mM sucrose, ¼ MS-medium, 10 mM MES-
NaOH, pH 6.35). Gas tight closed vess els equipped with
an oxygen sensor SP-PSt3 and connected to a Fibox 3
oxygen meter (PreSens Sensi ng GmbH, Regensburg,
Germany) were used. Oxygen concentration in the sa m-
ples was registered during a time period of 3 min. From
recorded data the respiration rate of seeds was calcu-
lated by linear regression.
Determination of metabolic intermediates, storage
products and seed weight
Sugar-phosphates, nucleotide sugars and organic acids
were extracted in chloroform/methanol (3:7 v/v) and
measured by anion-exchange chromatography linked to
tandem mass spectrometry [71]. For amino acid mea-
surements 10 mg of powdered, frozen mat erial was
extracted in ethanol (80%, v/v), supplemented with 25
nmol norvaline as internal standard. Collected superna-
tants were vacuum-dried and resuspended in 250 µl
wat er. Derivatization and separation of amino acids was
performed according to Thiel et al. [72]. H2O2 was
quantified using the Amplex Red Hydrogen Peroxide/
Peroxidase Assay Kit (A22188; Molecular Probes, Invi-
trogen GmbH, Darmstadt, Germany) according to the
manufacturer’s instructions. Adenine nucleotides were
measured as in Rolletschek et al. [73].
Average weight and number of ma ture seeds was
determined in 4 independent batches of plants. In each
batch, we used 5 individu al plants per genoty pe, and
counted the number of siliques per plant and the num-
ber of seeds per siliqu es (n = 10). From this we counted
the total number of seeds per plant. Average seed
weight was analysed i n three generations (T3-T5) using
an electronic microbalance (M2P, Sartorius, Göttingen,
Germany). Total lipid of mature seeds was analyzed as
fatty acid methyl esters by gas chromatography [74].
Total nitrogen and total carbon content were measured
by elemental analysis (Vario EL3, Elementaranalysesys-
teme, Hanau, Germany).
Thiel et al. BMC Plant Biology 2011, 11:48
/>Page 15 of 18
Additional material
Additional file 1: Validation of microarray data. (A) Cluster
dendrogram of normalized expression values (WT-wild type, HB-AtHb1
overexpression, H-hypoxic treatment, C-control, numbers indicate
biological replicates). (B) Correlation of qRT-PCR and microarray data.
Changes in gene expression of a selected set of 20 genes represented as
log2 (hypoxia/control) derived from qRT-PCR and microarray
hybridizations were compared. Correlation of gene expressi on data was
measured in both genotypes. Accordingly, each gene is represented by
two pairs of values.
Additional file 2: Clustering of differentially expressed genes.K-
means clustering of differentially expressed genes in all of the
comparisons (see also Additional file 3) according to expression profiles
(n = 8). Arrangement of comparisons into vertical columns is the same
as described in the legend of Figure 2. Columns indicate the number of
genes (no. Genes) per cluster, colours indicate increased (yellow) or
decreased (blue) expression. Clusters 1-3 showed similar expression
profiles of genes preferentially induced or repressed in transgenics
compared to WT under control conditions (AtHb1/WT_normox) and
genes implicated in hypoxic response in WT (WT_hyp/normox). Clusters
4-5 contained genes upregulated in both genotypes upon hypoxia
(WT_hyp/normox and AtHb1_hyp/normox). In cluster 6, genes exclusively
upregulated in WT after hypoxic treatment were monitored. Genes in
clusters 7-8 were found to be upregulated in AtHb1 after hypoxia, but
not in WT.
Additional file 3: List of differentially expressed genes. List of
differentially expressed genes in all of the comparisons. A total of 1,010
genes was identified as differentially expressed (log2 fold-change >1, p-
val < 0.05).
Additional file 4: Differentially expressed genes organized by
pathways. Classification of functional groups was done using MapMan
software. Annotation was confirmed using the TAIR locus history retrieval
tool />Additional file 5: Overrepresented GO terms of differentially
expressed genes in each comparison. Selected GOs were defined as
enriched by p-values < e-06. Ontology, MF-molecular function, BP-
biological process, CC-cellular compartment; n.e not enriched.
Additional file 6: Heat map display of differentially regulated genes
of the ubiquitin proteasome. Arrangement of comparisons into vertical
columns is the same as described in the legend of Figure 2.
Additional file 7: Effects of AtHb1 overexpression on transcripts
involved in primary metabolism under control and hypoxic
conditions displayed by MapMan tool. (A) AtHb1 vs WT under control
conditions. (B) AtHb1 vs WT under hypoxia. Log2 ratios of genes are
displayed using the colour code indicated. Blue, upregulation in AtHb1;
red, upregulation in WT.
Additional file 8: Reconstructed network of gene-to-gene
interactions for WT and transgenic plants. Network analysis is based
on the top 20 differentially expressed genes between the genotypes
under control conditions. Colours of the nodes indicate upregulated
(green) or downregulated (red) genes in AtHb1 versus WT. The colour of
the lines indicates the degree of information flow between genes. Red
indicates strong relationships between genes (gene information in
Additional file 10).
Additional file 9: Metabolite levels of WT and AtHb1-overexpressing
seeds under control and hypoxic conditions. LC/MS measurements
have been conducted with 5 biological replicates each (+/- SD).
Additional file 10: Top 20 of differentially expressed genes between
WT and AtHb1-overexpressing plants under control conditions used
for network analysis.
Additional file 11: Oligonucleotide primers used for quantitative
Real-Time PCR.
Acknowledgements
We are grateful to Katrin Blaschek, Elke Liemann, Angela Schwarz and
Angela Stegman for excellent technical assistance. We also thank Christian
Klukas for the help in the operation of the VANTED software. This work was
supported by the Deutsche Forschungsgemeinschaft (FKZ BO 1917).
Author details
1
Leibniz-Institut für Pflanzengenetik und Kulturpflanzenforschung (IPK),
Corrensstr. 3, 06466 Gatersleben, Germany.
2
Max Planck Institute of Molecular
Plant Physiology, Science Park Golm, 14476 Potsdam-Golm, Germany.
3
Virus
Surveillance and Diagnostic Branch, Influenza Division/NCIRD, Centers for
Disease Control and Prevention, 1600 Clifton Rd, Mail Stop G-16, Atlanta, GA
30333, USA.
Authors’ contributions
JT, HR and LB designed research. JT, HR, THN, RF, HT, MM and LB carried out
research. JT and SF analyzed the data. JT, HR, LB and JEL wrote the paper.
All author’s have read and approved the manuscript.
Received: 13 December 2010 Accepted: 15 March 2011
Published: 15 March 2011
References
1. Vinogradov SN, Hoogewijs D, Bailly X, Arrendondo-Peter R, Gough J,
Dewilde S, Moens L, Vanfleteren JR: A phylogenomic profile of globins.
BMC Evolutionary Biology 2006, 6:31.
2. Hoy JA, Hargrove MS: The structure and function of plant hemoglobins.
Plant Physiol Biochem 2008, 46:371-379.
3. Jokipii-Lukkari S, Frey AD, Kallio PT, Häggman H: Intrinsic non-symbiotic
and truncated haemoglobins and heterologous Vitreoscilla haemoglobin
expression in plants. J Exp Bot 2009, 60:409-422.
4. Dordas C, Rivoal J, Hill RD: Plant haemoglobins, nitric oxide and hypoxic
stress. Ann Bot 2003, 91:173-178.
5. Borisjuk L, Macherel D, Benamar A, Wobus U, Rolletschek H: Low oxygen
sensing and balancing in plant seeds - a role for nitric oxide. New
Phytologist 2007, 176:813-823.
6. Sowa AW, Duff SMG, Guy PA, Hill RD: Altering hemoglobin levels changes
energy status in maize cells under hypoxia. PNAS 1998, 95:10317-10321.
7. Dordas C, Hasinoff BB, Igamberdiev AU, Manac’h N, Rivoal J, Hill RD:
Expression of a stress-induced hemoglobin affects NO levels produced
by alfalfa root cultures under hypoxic stress. Plant J 2003, 35:763-770.
8. Perazzolli M, Dominici P, Romero-Puertas MC, Zago E, Zeier J, Sonoda M,
Lamb C, Delledonne M: Arabidopsis nonsymbiotic hemoglobin Ahb1
modulates nitric oxide bioactivity. Plant Cell 2004, 16:2785-2794.
9. Neill SJ, Desikan R, Hancock JT: Nitric oxide signaling in plants. New
Phytologist 2003, 159:11-35.
10. Benamar A, Rolletschek H, Borisjuk L, Avelange-Macherel MH, Curien G,
Mostefai A, Andriantsitohaina R, Macherel D: Nitrite-nitric oxide control of
mitochondrial respiration at the frontier of anoxia. Biochim Biophys Acta
2008, 1777:1268-1275.
11. Gas E, Flores-Perez U, Sauret-Güeto S, Rodriguez-Concepcion M: Hunting
for plant nitric oxide synthase provides new evidence of a central role
for plastids in nitric oxide metabolism. Plant Cell 2009, 21:18-23.
12. Borisjuk L, Rolletschek H: The oxygen status in the developing seeds. New
Phytologist 2009, 182:17-30.
13. Geigenberger P: Response of plant metabolism to too little oxygen. Curr
Opin Plant Biol 2003, 6:247-56.
14. Gibon Y, Vigeolas H, Tiessen A, Geigenberger P, Stitt M: Sensitive and high
throughput metabolite assays for inorganic pyrophosphate, ADPGlc,
nucleotide phosphates, and glycolytic intermediates based on a novel
enzymic
cycling system. Plant J 2002, 30:221-235.
15. Klok EJ, Wilson IW, Wilson D, Chapman SC, Ewing RM, Somerville SC,
Peacock WJ, Dolferus R, Dennis ES: Expression profile analysis of the low-
oxygen response in Arabidopsis root cultures. Plant Cell 2002,
14:2481-2494.
16. Liu F, Toai TV, Moy LP, Bock G, Linford LD, Quackkenbush J: Global
transcription profiling reveals comprehensive insights into hypoxic
Thiel et al. BMC Plant Biology 2011, 11:48
/>Page 16 of 18
response in Arabidopsis. Plant Physiol 2005, 137:1115-1129.
17. Branco-Price C, Kaiser KA, Jang CJ, Larive CK, Bailey-Serres J: Selective
mRNA translation coordinates energetic and metabolic adjustments to
cellular oxygen deprivation and reoxygenation in Arabidopsis thaliana.
Plant J 2008, 56:743-755.
18. Mustroph A, Zanetti ME, Jang CJH, Holtan HE, Repetti PP, Galbraith DW,
Girke T, Bailey-Serres J: Profiling translatomes of discrete cell populations
resolves altered cellular priorities during hypoxia in Arabidopsis. PNAS
2009, 106:18843-18848.
19. Bäumlein H, Boerjan W, Nagy I, Panitz R, Inze D, Wobus U: Upstream
sequences regulating legumin gene expression in heterologous
transgenic plants. Mol Gen Genet 1991, 225:121-128.
20. Thimm O, Bläsing O, Gibon Y, Nagel A, Meyer S, Krüger P, Selbig J,
Müller LA, Rhee SY, Stitt M: MAPMAN: a user-driven tool to display
genomics data sets onto diagrams of metabolic pathways and other
biological processes. Plant J 2004, 37:914-939.
21. Wagner TA, Kohorn BD: Wall-associated kinases are expressed
throughout plant development and are required for cell expansion.
Plant Cell 2001, 13:303-318.
22. Kohorn BD, Kobayashi M, Johanson S, Friedman HP, Fischer A, Byers N:
Wall-assocoated kinase 1 (WAK1) is crosslinked in endomembranes, and
transport to the cell surface requires correct cell-wall synthesis. J Cell Sci
2006, 119:2282-2290.
23. Blanco F, Garreton V, Frey N, Dominguez C, Perez-Acle T, Van der
Straeten D, Jordana X, Holuigue L: Identification of NPR1-dependent and
independent genes early induced by salicylic acid treatment in
Arabidopsis. Plant Mol Biol 2005, 59:927-944.
24. Pitorre D, Llauro C, Jobet E, Guilleminot J, Brizard JP, Delseny M, Lasserre E:
RLK7, a leucine-rich repeat receptor-like kinase, is required for proper
germination speed and tolerance to oxidative stress in Arabidopsis
thaliana. Planta 2010, 232:1339-53.
25. Stone SL, Callis J: Ubiquitin ligases mediate growth and development by
promoting protein death. Curr Opin Plant Biol 2007, 10:624-632.
26. Gomez LD, Baud S, Gilday A, Li Y, Graham IA: Delayed embryo
development in the ARABIDOPSIS TREHALOSE-6-PHOSPHATE SYNTHASE
1 mutant is associated with altered cell wall structure, decreased cell
division and starch accumulation. Plant J 2006, 46:69-84.
27. Otegui MS, Noh YS, Martinez DE, Petroff MGV, Staehelin LA, Amasino RM,
Guiamet JJ: Senescence-associated vacuoles with intense proteolytic activity
develop in leaves of Arabidopsis and soybean. Plant J 2005, 41:831-844.
28. Hunter PR, Craddock CP, Di Benedetto S, Roberts LM, Frigerio L:
Fluorescent reporter proteins for the tonoplast and the vacuolar lumen
identify a single vacuolar compartment in Arabidopsis cells.
Plant Physiol
2007, 145:1371-1382.
29.
Meyer PE, Lafitte F, Bontempi G: Minet: A R/Bioconductor package for
inferring large transcriptional networks using mutual information. BMC
Bioinformatics 2008, 9:461.
30. McCabe PF, Valentine TA, Forsberg LS, Pennell RI: Soluble signals from
cells identified at the cell wall establish a developmental pathway in
carrot. Plant Cell 1997, 9:2225-2241.
31. Seifert GJ, Roberts K: The biology of arabinogalactan proteins. Ann Rev
Plant Biol 2007, 58:137-161.
32. Greer S, Wen M, Bird D, Wu X, Samuels L, Kunst L, Jetter R: The
cytochrome P450 enzyme CYP96A15 is the midchain alkane hydroxylase
responsible for formation of secondary alcohols and ketones in stem
cuticular wax of Arabidopsis. Plant Physiol 2007, 145:653-667.
33. Fowler TJ, Bernhardt C, Tierney ML: Characterization and expression of
four proline-rich cell wall protein genes in Arabidopsis encoding two
distinct subsets of multiple domain proteins. Plant Physiol 1999,
121:1081-1091.
34. Kim DJ, Smith SM: Molecular cloning of cucumber phosphoenolpyruvate
carboxykinase and developmental regulation of gene expression. Plant
Mol Biol 1994, 26:423-434.
35. Manac’h-Little N, Igamberdiev AU, Hill RD: Hemoglobin expression affects
ethylene production in maize cell cultures. Plant Physiol Biochem 2005,
43:485-489.
36. Bailey-Serres J, Chang R: Sensing and signaling in response to oxygen
deprivation in plants and other organisms. Ann Bot 2005, 96:507-518.
37. Davletova S, Schlauch K, Coutu J, Mittler R: The zinc finger protein Zat12
plays a central role in reactive oxygen and abiotic stress signaling in
Arabidopsis. Plant Phys 2005, 139:847-856.
38. Mustroph A, Lee SC, Oosumi T, Zanetti ME, Yang H, Ma K, Yaghoubi-
Masihi A, Fukao T, Bailey-Serres J: Cross-kingdom comparison of
transcriptomic adjustments to low-oxygen stress highlights conserved
and plant-specific responses. Plant Physiol 2010, 152:1484-1500.
39. Paul MJ, Primavesi LF, Jhurreea D, Zhang Y: Trehalose metabolism and
signaling. Annu Rev Plant Biol 2008, 59:417-441.
40. Igamberdiev AU, Stoimenova M, Sereg elyes C, Hill RD: Class-1
hemo globin and antio xidant metabolism in alfalfa roots. Planta 2006,
223:1041-1046.
41. Xi DM, Liu WS, Yang GD, Wu CA, Zheng CC:
Seed-specific overexpression
of
antioxidant genes in Arabidopsis enhances oxidative stress tolerance
during germination and early seedling growth. Plant Biotechnology J
2010, 8:796-806.
42. Dean JV, Harper JE: Nitric oxide and nitrous oxide production by soybean
and winged bean during the in vivo nitrate reductase assay. Plant Physiol
1986, 82:718-723.
43. Rockel P, Strube F, Rockel A, Wildt J, Kaiser WM: Regulation of nitric oxide
(NO) production by plant nitrate reductase in vivo and in vitro. J Exp Bot
2002, 53:103-110.
44. Yamasaki H, Sakihama Y: Simultaneous production of nitrite oxide and
peroxynitrite by plant nitrate reductase: In vitro evidence for the NR-
dependent formation of active nitrogen species. FEBS Lett 2000,
468:89-92.
45. Kaiser WM, Weiner H, Kandlbinder A, Tsai CB, Rockel P, Sonoda M,
Planchet E: Modulation of nitrate reductase: some new insights, an
unusual case and a potentially important side reaction. J Exp Bot 2002,
53:875-882.
46. Morot-Gaudry-Talarmain Y, Rockel P, Moreaux T, Quillere I, Leydecker MT,
Kaiser WM, Morot-Gaudry JF: Nitrite accumulation and nitritc oxide
emission in relation to cellular signaling in nitrite reductase antisense
tobacco. Planta 2002, 215:708-715.
47. Desikan R, Griffiths R, Hancock J, Neill S: A new role for an old enzyme:
nitrate reductase-mediated nitric oxide generation is required for
abscisic acid-induced stomatal closure in Arabidopsis thaliana. PNAS
2002, 99:16314-16318.
48. Fabre N, Reiter IM, Becuwe-Linka N, Genty B, Rumeau D: Characterization
and expresssion analysis of genes encoding alpha and beta carbonic
anhydrases in Arabidopsis. Plant Cell Environ 2007, 30:617-629.
49. Martin V, Villareal F, Miras I, Navaza A, Haouz A, Gonzales-Lebrero RM,
Kaufman SB, Zabaleta E: Recombinant plant gamma carbonic anhydrase
homotrimers bind inorganic carbon. FEBS Lett 2009, 583:3425-3430.
50. Dordas C, Hasinoff BB, Rivoal J, Hill RD: Class 1 hemoglobins, nitrate and
NO levels in hypoxic maize cell suspension cultures. Planta 2004,
219:66-72.
51. Wang P, Du Y, Li Y, Ren D, Song CP: Hydrogen peroxide-mediated
activation of MAP Kinase 6 modulates nitric oxide biosynthesis and
signal transduction in Arabidopsis. Plant Cell 2010, 22:2981-2998.
52. Durner J, Wendehenne D, Klessig DF: Defence gene induction in tobacco
by nitric oxide, cyclic GMP, and cyclic ADP-ribose. PNAS 1998,
95:10328-10333.
53.
Ma W, Smigel A, Tsai YC, Braam J, Berkowitz GA: Innate immunity
signaling: cytosolic Ca2+ elevation is linked to downstream nitric oxide
generation through the action of calmodulin or a calmodulin-like
protein. Plant Physiol 2008, 148:818-828.
54. Nie X, Durnin DC, Igamberdiev AU, Hill RD: Cytosolic calcium is involved
in the regulation of barley haemoglobin gene expression. Planta 2006,
223:542-549.
55. Lamotte O, Courtois C, Dobrowolska G, Besson A, Pugin A, Wendehenne D:
Mechanisms of nitric-oxide-induced increase of free cytosolic Ca2+
concentration in Nicotiana plumbaginifolia cells. Free Radic Biol Med 2006,
40:1369-1376.
56. Besson-Bard A, Courtois C, Gauthier A, Dahan J, Dobrowolska G, Jeandroz S,
Pugin A, Wendehenne D: Nitric oxide in plants: production and cross-talk
with Ca2+ signaling. Mol Plant 2008, 1:218-228.
57. Bethke PC, Libourel IG, Aoyama N, Chung YY, Stil, DW, Jones RL: The
Arabidopsis aleurone layer responds to nitric oxide, gibberellin, and
abscisic acid and is sufficient and necessary for seed dormancy. Plant
Physiol 2007, 143:1173-1188.
58. Parani M, Rudrabhatla S, Myers R, Weirich H, Smith B, Leaman DW,
Goldman SL: Microarray analysis of nitric oxide responsive transcripts in
Arabidopsis. Plant Biotechnology J 2004, 2:359-366.
Thiel et al. BMC Plant Biology 2011, 11:48
/>Page 17 of 18
59. Palmieri MC, Sell S, Huang X, Scherf M, Werner T, Durner J, Lindermayr C:
Nitric oxide-responsive genes and promoters in Arabidopsis thaliana:a
bioinformatics approach. J Exp Bot 2008, 59:177-186.
60. Yamasaki H, Shimoji H, Ohshiro Y, Sakihama Y: Inhibitory effects of nitric
oxide on oxidative phosphorylation in plant mitochondria. Nitric Oxide:
Biology and Chemistry 2001, 5:261-270.
61. Zottini M, Formentin E, Scattolin M, Carimi F, Schiavo FL, Terzi M: Nitric
oxide affects plant mitochondrial functionality in vivo. FEBS Lett 2002,
515:75-78.
62. Clough SJ, Ben AF: Floral dip: a simplified method for Agrobacterium-
mediated transformation of Arabidopsis thaliana. Plant J 1998, 16:735-743.
63. Murashige T, Skoog F: A revised medium for rapid growth and bio-assays
with tobacco tissue cultures. Physiol Plant 1962, 15:473-497.
64. Heim U, Weber H, Bäumlein H, Wobus U: A sucrose-synthase gene of Vicia
faba: Expression pattern in developing seeds in relation to starch
synthesis and metabolic regulation. Planta 1993, 191:394-401.
65. Bolstad BM, Irizarry RA, Astrand M, Speed TP: A comparison of
normalization methods for high density oligonucleotide array data
based on bias and variance. Bioinformatics 2003, 19:185-193.
66. Smyth GK: Limma: linear models for microarray data. In Bioinformatics and
Computational Biology Solutions using R and Bioconductor. Edited by: R.
Gentleman, V. Carey, S. Dudoit, R. Irizarry, W. Huber. Springer, New York;
2005:397-420.
67. Benjamini Y, Hochberg Y: Controlling the false discovery rate: a practical
and powerful approach for multiple testing. J R Statist Soc B 1995,
57:289-300.
68. Horan K, Jang C, Bailey-Serres J, Mittler R, Shelton C, Harper JF, Zhu JK,
Cushman JC, Collery M, Girke T: Annotating genes of known and
unknown function by large- scale coexpression analysis. Plant Physiol
2008, 147:41-57.
69. Livak KJ, Schmittgen TD: Analysis of relative gene expression data using
real-time quantitative PCR and the 2-ΔΔCT method. Methods 2001,
25:402-408.
70. Planchet E, Kaiser WM: Nitric oxide (NO) detection by DAF fluorescence
and chemiluminescence: a comparison using abiotic and biotic NO
sources. J Exp Bot 2006, 57:3043-3055.
71. Lunn JE, Feil R, Hendriks JHM, Gibon Y, Morcuende R, Osuna D,
Scheible WR, Carillo P, Hajirezaei MR, Stitt M: Sugar-induced increases in
trehalose 6-phosphate are correlated with redox activation of
ADPglucose pyrophosphorylase and higher rates of starch synthesis in
Arabidopsis thaliana. Biochem J 2006, 397:139-148.
72. Thiel J, Müller M, Weschke W, Weber H: Amino acid metabolism at the
maternal-filial boundary of young barley seeds: a microdissection-based
study. Planta 2009, 230:205-213.
73. Rolletschek H, Koch K, Wobus U, Borisjuk L: Positional cues for the starch/
lipid balance in maize kernels and resource partitioning to the embryo.
Plant J 2005, 42:69-83.
74. Borisjuk L, Nguyen TH, Neuberger T, Rutten T, Tschiersch H, Claus B,
Feussner I, Webb AG, Jacob P, Webe H, Wobus U, Rolletschek H: Gradients
of lipid storage, photosynthesis and plastid differentiation in developing
soybean seeds. New Phytologist 2005, 167:761-776.
75. Junker BH, Klukas C, Schreiber F: VANTED: a system for advanced data
analysis and visualization in the context of biological networks. BMC
Bioinformatics 2006, 7:109.
doi:10.1186/1471-2229-11-48
Cite this article as: Thiel et al.: Seed-specific elevation of non-symbiotic
hemoglobin At Hb1: beneficial e ffects and underlying molecular networks in
Arabidopsis thaliana. BMC Plant Biolo gy 2011 11:48.
Submit your next manuscript to BioMed Central
and take full advantage of:
• Convenient online submission
• Thorough peer review
• No space constraints or color figure charges
• Immediate publication on acceptance
• Inclusion in PubMed, CAS, Scopus and Google Scholar
• Research which is freely available for redistribution
Submit your manuscript at
www.biomedcentral.com/submit
Thiel et al. BMC Plant Biology 2011, 11:48
/>Page 18 of 18