báo cáo khoa học: " Using transcriptomics to identify and validate novel biomarkers of human skeletal muscle cancer cachexia" pdf
Bạn đang xem bản rút gọn của tài liệu. Xem và tải ngay bản đầy đủ của tài liệu tại đây (778.3 KB, 12 trang )
Background
Cancer cachexia is a syndrome associated with malignant
tumor disease defined by weight loss, asthenia and
anorexia. Up to half of all cancer patients are affected,
leading to increased morbidity and poor prognosis [1]
with perhaps 20% of cancer deaths being related to
cachexia rather than direct tumor effects [2]. Cachectic
patients suffer loss of both muscle mass and adipose
tissue (with comparative sparing of visceral protein) and
this tissue loss appears resistant to nutritional support
[3,4]. A PubMed analysis indicates that almost one-third of
documents discussing cancer cachexia are review articles,
highlighting the need for more primary investigations to
Abstract
Background: Cancer cachexia is a multi-organ tissue wasting syndrome that contributes to morbidity and mortality
in many cancer patients. Skeletal muscle loss represents an established key feature yet there is no molecular
understanding of the disease process. In fact, the postulated molecular regulators of cancer cachexia originate largely
from pre-clinical models and it is unclear how these translate to the clinical environment.
Methods: Rectus abdominis muscle biopsies were obtained from 65 upper gastrointestinal (UGI) cancer patients
during open surgery and RNA proling was performed on a subset of this cohort (n = 21) using the Aymetrix
U133+2 platform. Quantitative analysis revealed a gene signature, which underwent technical validation and
independent conrmation in a separate clinical cohort.
Results: Quantitative signicance analysis of microarrays produced an 83-gene signature that was able to identify
patients with greater than 5% weight loss, while this molecular prole was unrelated to markers of systemic
inammation. Selected genes correlating with weight loss were validated using quantitative real-time PCR and
independently studied as general cachexia biomarkers in diaphragm and vastus lateralis from a second cohort (n=13;
UGI cancer patients). CaMKIIβ correlated positively with weight loss in all muscle groups and CaMKII protein levels
were elevated in rectus abdominis. TIE1 was also positively associated with weight loss in both rectus abdominis and
vastus lateralis muscle groups while other biomarkers demonstrated tissue-specic expression patterns. Candidates
selected from the pre-clinical literature, including FOXO protein and ubiquitin E3 ligases, were not related to weight
loss in this human clinical study. Furthermore, promoter analysis identied that the 83 weight loss-associated genes
had fewer FOXO binding sites than expected by chance.
Conclusion: We were able to discover and validate new molecular biomarkers of human cancer cachexia. The
exercise activated genes CaMKIIβ and TIE1 related positively to weight-loss across muscle groups, indicating that
this cachexia signature is not simply due to patient inactivity. Indeed, excessive CaMKIIβ activation is a potential
mechanism for reduced muscle protein synthesis. Our genomics analysis also supports the view that the available
preclinical models do not accurately reect the molecular characteristics of human muscle from cancer cachexia
patients.
© 2010 BioMed Central Ltd
Using transcriptomics to identify and validate
novel biomarkers of human skeletal muscle cancer
cachexia
Nathan A Stephens
1¤
, Iain J Gallagher*
2¤
, Olav Rooyackers
3
, Richard J Skipworth
1
, Ben H Tan
1
, Troels Marstrand
4
,
JamesARoss
1
, Denis C Guttridge
5
, Lars Lundell
3
, Kenneth C Fearon
1
and James A Timmons*
2,6,7
R ES EA RCH Open Access
¤
These authors contributed equally to this work.
*Correspondence: ;
2
Translational Biomedicine, Heriot-Watt University, Edinburgh, EH14 4AS, UK
Full list of author information is available at the end of the article
Stephens et al. Genome Medicine 2010, 2:1
/>© 2010 Stephens et al.; licensee BioMed Central Ltd. This is an Open Access article: verbatim copying and redistribution of this
article are permitted in all media for any purpose, provided this notice is preserved along with the article’s original URL.
shed light on the detailed mechanisms that produce the
syndrome in patients. Furthermore, most molecular hypo -
theses have been generated using pre-clinical models or
reflect biochemical concepts [5] and there has been little
progress in relating these potential mechanisms to
changes observed in the patient.
Muscle mass is maintained by physical activity, reflect-
ing a balance between protein synthesis and degrada tion.
Intracellular protein breakdown involves the ubiquitin
proteasome pathway (UPP) and the autophagy (lyso-
somal), caspase, cathepsin and the calcium-dependent
calpain pathways. e individual prominence of each of
these pathways in muscle wasting conditions is still
debated. Many of the molecular signaling pathways that
are postulated to contribute to muscle atrophy in pre-
clinical models mediate their effects through activation
of the UPP [6]. Identification of two muscle-specific E3
ubiquitin ligases, MuRF-1 and MAFbx/atrogin-1, in a
large number of animal models of atrophy [7,8] has been
used to provide an argument for a major contribution of
the UPP in muscle wasting, such that these genes are now
measured as surrogate indicators of UPP activation. It
should be kept in mind that active tissue remodeling,
even with net protein accretion, may well rely partly on
the protein degradation pathways and, as such, they may
not represent logical surrogates for commenting on net
protein degradation.
In humans, reduced levels of phosphorylated (inactive)
FOXO3a have been observed in the skeletal muscle of
cachectic compared with non-cachectic cancer patients,
but an unexplained twofold reduction in the amount of
FOXO1 and FOXO3a was also observed [9], making the
data challenging to interpret. FOXO3 also appears to
induce expression of autophagy-related genes [10-13],
suggesting a link between the lysosomal and proteasomal
systems. However, there is also evidence that the UPP is
first activated with increasing weight loss then declines
as the disease severity progresses [14]. is suggests that
UPP is a marker of protein turn-over rather than wasting
per se (with turn-over increasing as the muscle weakens,
but only while the patient continues to be ambulatory)
or that UPP proteins are not reliable biomarkers.
Further more, recent data indicates a dissociation
between protein dynamics in vivo and activation or
expression of the UPP-related signaling molecules in
human skeletal muscle [15]. Overall, it is not clear what
regulates muscle mass in vivo nor is it clear to what
extent protein degradation contributes over inhibition of
protein syn thesis [15,16]. Given the paucity of data
derived from cancer cachexia patients, including study
of the UPP and autophagy systems, we sought to carry
out both targeted and global molecular profiling in the
skeletal muscle of cancer patients and relate our findings
to clinical status.
Methods
Men and non-pregnant women over 18 years of age were
recruited to the study from two separate centers. Written
informed consent was obtained from all subjects and
ethical approval received from Lothian Research Ethics
Committee (UK) and the Regional Ethics Committee in
Stockholm (Sweden). Participating patients had a
diagnosis of upper gastrointestinal cancer (esophageal,
gastric, pancreatic) and were undergoing surgery with
the intent of resection of the primary tumor. A small
number of weight stable (WS) patients undergoing
surgery for benign, non-inflammatory conditions (n=7)
were also included in the analysis. In center 1 (Edinburgh,
UK) a fasting venous blood sample was taken and serum
C-reactive protein measured as a marker of systemic
inflammation (SI). Body mass index (BMI) and mid-arm
muscle circumference were calculated. Clinical details
and degree of weight loss from self-reported pre-illness
stable weight were recorded. A weight loss ≥5% identified
weight-losing (WL) cancer patients as opposed to weight
stable (WS) individuals. A serum C-reactive protein
≥5 mg/l was used to define the presence of SI. For
patients from center 2 (Stockholm, Sweden) weight and
self-reported change in weight over time were recorded.
Rate of weight loss was therefore used in these subjects.
Due to the small number of controls (otherwise con sidered
as non-cancer patients but with other co-morbidities) and
the lack of detailed knowledge of their physical capacity,
the primary analysis strategy was chosen to generate
molecular changes that varied with the severity of weight
loss in patients in center 1 and validate such changes in the
independent cohort from center 2 using more than one
muscle type. is strategy was devised to provide a
stringent test of the molecular changes, as the conclusions
are based on a relatively large number of patients with
otherwise similar clinical characteristics.
All biopsies were taken at the start of open abdominal
surgery. In center 1, the edge of the rectus abdominis was
exposed and a 1-cm
3
specimen removed using sharp
dissection. e biopsy was snap frozen in liquid nitrogen
and stored at -80°C until further analysis. In center 2,
vastus lateralis muscle biopsies were taken with a
Bergstrom needle and diaphragm biopsies were obtained
by sharp dissection when possible. Both samples were
snap frozen and stored at -80°C for further analysis.
Approximately 20 mg of frozen tissue was homogenized
in 0.5 ml of lysis buffer (Triton - X100 (1%), NaCl (150 mM),
Tris-HCl (50 mM), EDTA (1 mM), PMSF (1 mM),
protease inhibitors (Roche Diagnostics, Burgess Hill, UK);
1 tablet per 10 ml), water to 10 ml) using a Powergen 125
(Fisher Scientific, Loughbourgh, UK)) electric homogen-
izer. Samples were left on ice for 15 minutes prior to
centrifuging at 13,000 rpm for 15 minutes. e super-
natant was removed, and protein concentration was
Stephens et al. Genome Medicine 2010, 2:1
/>Page 2 of 12
determined by comparing equal volumes of sample
solution to known standards using the Lowry method.
Samples were then stored at -80°C.
Approximately 20 mg of muscle was re-suspended in
180 μl of low salt lysis buffer (10 mM HEPES, 10 mM
KCl, 1.5 mM MgCl
2
, 0.1 mM EDTA, 0.1 mM EGTA, 1 mM
DTT, 0.5 mM PMSF, protease inhibitors (Roche Diag-
nostics; 1 tablet per 10 ml)) and ground using a handheld
homogenizer. Samples were incubated on ice for
5minutes before two cycles of freeze-thaw lysis. After a
brief vortex, samples were centrifuged at 4,000 rpm for
3minutes. e supernatant was removed and the pellet
(containing the nuclei) re-suspended in 40 μl high salt
extraction buffer (20 mM HEPES, 420 mM NaCl, 1 mM
EDTA, 1 mM EGTA, 25% glycerol, 1 mM DTT, protease
inhibitors (Roche Diagnostics; 1 tablet per 10 ml)).
Samples were incubated on ice for 30 minutes with gentle
mixing of the tubes every 5 to 10 minutes. Samples were
centrifuged at 4,000 rpm for 5 minutes at 4°C. An aliquot
of supernatant (containing the nuclear proteins) was
stored at -80°C.
Protein from each sample (20 μg) was added to 3 μl of
4× loading buffer solution (0.5 M Tris-HCl pH 6.8, 20%
glycerol, 4% SDS, 0.05% β-mercaptoethanol, 0.004%
bromophenol blue) and boiled for 3 minutes. Proteins
were resolved using SDS-PAGE at 160V for 45 minutes.
Proteins were transferred to a nitrocellulose membrane
(80 mA for 1 hour) using semi-dry transfer (Biorad,
Hemel Hempstead, UK). Membranes were blocked with
either 3% bovine serum albumen/tris-buffered saline
(TBS) with Tween 20 (TBST; 0.05% Tween) overnight at
4°C or with 5% milk/TBST for 1 hour at room tempera-
ture. Incubation with primary antibody (1:1,000) was
carried out in either 3% bovine serum albumen/TBST or
0.5% milk/TBST solution at room temperature for
2 hours or overnight at 4
o
C. Membranes were washed
with TBST and primary antibody binding detected using
horseradish-peroxidase conjugated secondary antibodies
(1:2,000 to 1:5,000; anti-mouse, anti-rabbit (Upstate,
Dundee, UK)). Specific signal was detected using ECL
reagent (GE Healthcare, Little Chalfont, UK) and expo-
sure on photographic film (Kodak). Films were scanned
and densitometry values estimated using ImageJ (NIH)
software. e primary antibodies used in the study were
against phos-CaMKII(r286), FOXO1 and FOXO3a
(New England Biolabs, Hitchin, UK), Lamin A/C (Insight,
Wembely, UK), alpha-skeletal actin (Novo caestra,
Newcastle, UK) and calcium/calmodulin-dependent
protein kinase (CaMK)II (BD Biosciences, Oxford, UK).
Total RNA was extracted from approximately 20 mg of
muscle using TRIzol (Invitrogen, Paisley, UK) reagent
according to the manufacturer’s directions. e RNA
pellet was re-suspended in diethylpyrocarbonate-treated
water and RNA concentration was determined using a
Nanodrop spectrophotometer (LabTech International,
Ringmer, UK). RNA quality was assessed using 260/280,
230/260 ratios and the RNA integrity number (RIN)
score from the BioAnalyzer 2100 instrument (Agilent
Technologies, Stockport, UK). Total RNA (3.5 μg) was
reverse transcribed and processed according to the
protocol provided by Affymetrix Inc. for the GeneChip
Expression 3’ Amplification One-Cycle Target Labeling
and Control Reagents kit (Affymetrix, High Wycombe,
UK). Reverse transcription and second strand cDNA
synthesis were followed by in vitro transcription and
biotinylation. Biotinylated cRNA products were cleaned
up using columns (Affymetrix). e quality of the
biotinylated cRNA was assessed by Nanodrop (LabTech
International, UK) and BioAnalyzer (Agilent Technol o-
gies) instruments and the cRNA was then fragmented
according to Affymetrix protocols. Samples were hybrid-
ized to the HGU-133plus2 GeneChip array (covering
approximately 54,000 sequences). e raw data files can
be accessed at the Gene Expression Omnibus using the
ID [GEO:GSE18832].
For quantitative real time PCR (qRT-PCR), cDNA was
prepared using 1 μg RNA, TaqMan reverse transcription
reagents (Applied Biosystems, Warrington, UK) and
random hexamer primers (Applied Biosystems). Primers
were designed to span introns using Primer Express 3.0
software (Applied Biosystems) and constructed by
Invitrogen (Paisley, UK); primer sequences are detailed in
Table S1 in Additional data file 1. Samples were run on an
ABI 7900HT Fast Real-Time PCR system (Applied
Biosystems) in triplicates of 20 μl per well using SYBR
Green PCR Master Mix (Applied Biosystems) as per the
manufacturer’s instructions. Expression levels were
normalized to ribosomal 18S RNA and results examined
using the ΔCt method [17]. SPSS (SPSS Inc, Chicago, IL,
USA) or GraphPad (GraphPad Software, La Jolla, CA,
USA) statistical software was utilized. Student’s two
tailed t-test or one way ANOVA (analysis of variance)
was used to compare means between groups. Log trans-
or mation was used when appropriate. Mann-Whitney
was used for nonparametric analysis. Contingency tables
were constructed where relevant and analyzed by Fisher’s
exact test. Statistical significance was set at P < 0.05.
Microarray data were analyzed using the Microarray
Suite software (MAS) version 5.0 (Affymetrix). To
improve the accuracy of the gene to probe relationship, a
custom chip definition file (CDF) [18] was used defining
the Affymetrix probes by Ensembl transcript ID. Data
were normalized using MAS5 and robust multi-array
average [19]. Genes called absent on every array by the
MAS5 software were filtered from the data and remain-
ing genes analyzed using the quantitative function in
significance analysis of microarrays (SAM) [20] imple-
mented in the Bioconductor suite [21]. Percentage weight
Stephens et al. Genome Medicine 2010, 2:1
/>Page 3 of 12
loss or SI were the quantitative variables. To test the
robustness of the approach, the limma package [22] in
the Bioconductor suite was used to identify genes co-
varying with weight loss or SI. Both SAM and limma
generate a false discovery rate (FDR) [23]. All genes
identified by both procedures with an FDR <10% that
covaried with weight loss were further examined. We also
carried out a comparative microarray analysis [24,25] to
examine the link between muscle cachexia and other
muscle physiological states. e top 20 most regulated
genes by eccentric muscle damage [26], muscle obtained
from intensive care unit patients [27] and in response to
exercise training [24] were obtained from three published
articles. e mean values for these highly regulated
marker genes for these physiological states were then
plotted using the patient values from the present study,
where patients had either less than or more than 5%
weight loss. Functional annotation of these genes was
carried out using Gene Ontology (GO) [28] utilizing the
topGO tool [29] in the Bioconductor suite along with
web-based Ingenuity Pathway Analysis [30]. For analysis
of microarray data the Bioconductor suite [21] and the R
language for statistics (R Development Core Team;
version 2.7.1) were used.
e gene-sets (see below) identified by microarray
analysis were used in further investigation of the
regulatory mechanisms using promoter analysis. For all
genes the region up to 1,500 bp upstream of the
annotated gene start was used as the proximal promoter
region. Both strands were then scanned with the JASPAR
[31] matrices representing various mammalian transcrip-
tion factor binding sites (89 in total). A matrix specific
threshold corresponding to 0.8 of the scoring range of the
matrix was used on the log-ratio matrix. All log-ratio
transformations were done using a zero order uniform
background model and a pseudo-count of one to avoid
zero-entries in the original JASPAR matrix. e number
of hits per base-pair and the number of sequences with
one or more hits were registered and used for over-
representation statistical analysis. We used a background
set of promoter sequences extracted in a similar manner
from the ‘all genes expressed’ present/absent call in
skeletal muscle from this array technology [24,27]. A
sequence-specific over-representation was calculated
using Fisher’s exact test and a base-pair-specific over/
under-representation was calculated using a Z-score.
Finally, using the base-pair-specific over- and under-
representation values, a heatmap was generated for
visualization purposes. For all analyses the ASAP [31]
framework was used in conjunction with R.
Results
Subject characteristics
Fifty-nine subjects were recruited over time (7 controls
and 52 patients with upper gastrointestinal cancer) from
center 1 (Edinburgh). Patient demographics and anthro po-
metric characteristics are shown in Table 1. Average
weight loss for center 1 cancer patients was 8.9% (range
-0.5 to 43.8%). Compared to the control group, cancer
patients had significant weight loss (P < 0.001) and had a
lower BMI (P = 0.001). e controls were substantially
younger (P = 0.009) and hence could not be used as a case-
control comparison group for the molecular profiling.
Instead, gene expression was related to body mass status.
WL cancer patients had a lower BMI (P=0.010) than WS
cancer patients. e Affymetrix GeneChip studies used a
subset of 21 patients from the cohort in center 1, where
high quality RNA was available at the time of gene-chip
analysis (Table 2). BMI and mid-arm muscle circumference
were not significantly different between the ‘Affymetrix
cohort’ and the larger group of cancer patients. To validate
the findings in the first group of patients (‘Affymetrix
cohort’) a second group of 13 patients with esophageal
cancer was recruited from an independent clinical center
(center 2, Sweden). Patients of this group were similar to
the cancer patients from center 1 (Table 1).
Stephens et al. Genome Medicine 2010, 2:1
/>Table 1. Clinical data for patients and control subjects
from centers 1 and 2
Center 1 Center 1 Center 2
no-cancer patients patients
(n = 7) (n = 52) (n = 13)
Male/female 5/2 34/18 12/1
Age (years) 51 (5.5) 66 (1.3)* 65 (1.5)*
% weight loss 0 8.9 (1.1)* 7.7 (2.0)*
BMI 30.6 (1.3) 25.5 (0.5)* 25.5 (1.2)
CRP 2.8 (0.7) 17.4 (4.4) -
MAMC 25.9 (1.3) 24.4 (0.4) -
Mean (standard error of the mean) values are presented. *P < 0.05 compared
with center 1 control. Center 1: Edinburgh, UK; centre 2: Stockholm, Sweden.
BMI: body mass index; CRP: C reactive protein; MAMC: mid-arm muscle
circumference.
Table 2. Demographics of controls and cancer patients
included in the Affymetrix analysis from centre 1
No-cancer Cancer patients
(n = 3) (n = 18) P
Male/female 2/1 12/6 -
Age (years) 45(2) 67(2) <0.001
% weight loss 0 8.9(1.6) <0.001
BMI 28.5(1.7) 24.4(0.8) 0.080
CRP 2.7(0.9) 19.7(8.1) 0.052
MAMC 23.8(1.7) 23.7(0.5) 0.960
Mean (standard error of the mean). BMI: body mass index; CRP: C reactive
protein; MAMC: mid arm muscle circumference.
Page 4 of 12
Microarray analysis: novel genes associated with weight
loss in cancer (centre 1)
e microarray study was undertaken on rectus abdominis
muscle from a subgroup of center 1 patients (Table 2).
Hierarchical and k-means clustering were undertaken
with normalized data, using a gene list where those with
a low standard deviation were removed. No pattern
emerged from this analysis. Using the probe-sets that
detect atrogenes (genes reproducibly detected in pre-
clinical models of cachexia), which we have previously
demonstrated reliably change in human skeletal muscle
sepsis [27], we carried out hierarchical and k-means
clustering. No pattern emerged from this analysis. us,
our first attempted analysis did not yield any data in
support of pre-clinical studies [32] and also demonstrated
that muscle cancer cachexia appears distinct from the
inflammation-driven skeletal muscle remodeling observed
in the intensive care unit [27].
We then identified genes that varied with percentage
weight loss using the quantitative SAM methodology
[20]. In this multiple comparison corrected correlation
analysis, the WS group contained both cancer patients
and three non-cancer controls in order to identify bona
fide cachexia associating genes. SAM identified 74 genes
with a FDR between 0 and 10% (most <5% FDR) that
covaried positively with weight loss, and nine genes with
a FDR between 0 and 10% (most <5% FDR) that covaried
negatively with weight loss (Additional data file 2). Corre-
lation coefficients (R) for these 83 genes were generated
using Pearson’s product moment correlation. Positive
coefficients ranged from 0.82 to 0.57 (P < 0.01), and for
negatively correlating genes, R ranged from -0.74 to -0.65
(P < 0.01). Each relationship was visually inspected by
plotting the data.
Most of the genes correlating with weight loss had not
been associated previously with cachexia in humans or
animal models. Notably, FOXO transcription factors and
the E3 ligases MURF1 and MAFbx were absent from this
list. Simple cluster analysis revealed visual distinction of
patients with <5% reported weight loss from those with
>5% reported weight loss (Figure 1). is Affymetrix-
derived WL gene signature was technically validated by
qRT-PCR of the 9 genes (APCDD1, CaMKIIβ, EIF3I,
HGS, NUDC, POLRMT, SGK, TIE1 and TSC2). Eight
validated the microarray data, with only SGK expression
being inconsistent with the Affymetrix analysis (Table 3
and Figure 2; Supplemental figure 1 in Additional data
file 3).
Candidate gene approach: analysis of FOXO transcription
factors and components of the ubiquitin proteasome and
autophagy pathways (centre 1)
While the microarray analysis did not yield any evidence
for proteolytic pathways being upregulated, as seen in
intensive care unit patients with the same gene chip
technology [27], investigation of components of these
pathways was nevertheless undertaken in parallel to the
gene-chip study. ere was no difference in the nuclear
level of FOXO1 and FOXO3a protein by western blotting
when patients were grouped according to weight loss.
Expression of the E3 ligases MURF1 and MAFbx was
examined by qRT-PCR and no relationship between
mRNA expression and weight loss was found (data not
shown). e autophagy-related genes GABRAPL1 and
BNIP3 were modestly increased in WL patients com-
pared to WS patients or controls (fold change = 1.46
versus 1.23 versus 1.07, respectively; P = 0.047). However,
this P-value is unadjusted for the previous array analysis
and may not be reliable. Both genes demonstrated a
positive association with systemic inflammation
(Table S2 in Additional data file 1 and Figure S2 in
Additional data file 3).
Conrmation of genes associated with weight loss in
cancer cachexia (center 2)
To validate the WL gene signature generated in rectus
abdominis muscle from the center 1 cohort, nine genes
were profiled using qRT-PCR (APCDD1, CaMKIIβ, EIF3I,
HGS, NUDC, SKG, POLRMT, TIE1 and TSC2) in two
additional types of skeletal muscle obtained from cancer
cachexia patients. e significant association between
CaMKIIβ and weight loss observed in rectus abdominis
muscle from center 1 (R = 0.82, P = 0.01; Table 1) was
reproduced (Figure3a) in both vastus lateralis (R=0.45,
P=0.06) and diaphragm muscle (R=0.5; P=0.03) from
center 2 patients. In addition, TIE1, which significantly
correlated with weight loss in rectus abdominis (R=0.67,
P = 0.01; Table 1) demon strated a similar (Figure 3b)
relationship in vastus lateralis (R=0.7, P=0.003) but not
in diaphragm. Given the changes observed for CaMKIIβ
mRNA, the protein and phosphorylation level of CaMKII
in all of the rectus abdominis muscle obtained in center 1
was evaluated. Material from a total of 59 patients was
available at the time the analysis was carried out
(recruitment was ongoing beyond the time the microarray
was carried out). Western blotting for both CaMKII
(Figure 3c) and phosphorylated CaMKII (Figure 3d)
revealed a small but significant (P = 0.04 and 0.07,
respectively) increase in WL patients compared with the
expression determined in WS patients and controls.
Gene interaction and promoter analysis
In order to generate valid pathway or ontological
enrichment scores, it is essential to relate the modulated
gene list with the genes detectably expressed in the tissue
of interest and not with the genome as a whole (or the
entire gene-chip content). e nature of the 83-gene WL
gene signature was explored in detail using GO. e
Stephens et al. Genome Medicine 2010, 2:1
/>Page 5 of 12
highest ranked GO biological process activity from the
DAVID webtool [33] was proline metabolism (P = 0.03).
is was confirmed with the topGO [29] and GOStats
[34] tools in Bioconductor. Proline metabolism has a role
in collagen formation and increased collagen deposition
has been noted in the muscle of cachectic cardiac failure
patients [35]. Network analysis using Ingenuity [30]
revealed several interactions that involve the 83 WL
genes, including a calmodulin kinase gene network
(Figure S3A in Additional data file 3), supporting the wet-
lab data and indicating that CaMKIIβ activation appears
to be a general marker of muscle wasting in human
cancer cachexia. A second illustrative pathway (Figure
S3B in Additional data file 3) features GLUT-4 (glucose
transporter type 4) and interleukin-6, both of which are
implicated in skeletal muscle metabolism [36]. is
Stephens et al. Genome Medicine 2010, 2:1
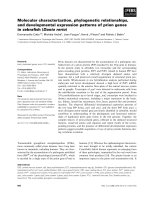
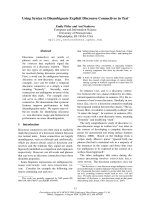
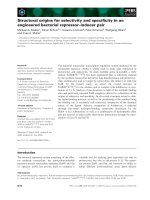
/>Figure 1. Cluster analysis identies high and low weight loss groups. Using SAM and limma, 83 genes were identied as correlating with
weight loss. Expression data from these genes were used to drive cluster analysis. This revealed two clusters of subjects; high weight loss (≥5%) and
low weight loss (<5%).
-3 -2 -1 0 1 2
Page 6 of 12
network also forms numerous connections with the
glucocorticoid and androgen receptors, which may be
involved in regulating skeletal muscle mass. It should be
noted that despite using a back-ground gene expression
file in Ingenuity [30] for genes only detected as being
expressed in human skeletal muscle (approximately
21,000 probe sets, based on MAS5 present-marginal
calls) the Ingenuity network analysis still included genes
that may not be robustly expressed and should be used in
a qualitative hypothesis generation manner.
Gene sequence analysis of the WL gene-set was carried
out to provide insight into the potential coordinators of
this expression signature. Interestingly, FOXO trans-
cription binding sites tended to be, if anything,
significantly under-represented in the human cachexia
WL gene set, supporting the wet-lab analysis. Binding
sites for SP1, ARNT.AHR (the hypoxia signaling partner)
and TFAP2A (Transcription factor AP2-alpha or AP2) in
particular, were over-represented in the proximal
promoters of the WL-associated genes (Figure S4 in
Additional data file 3). e analysis further supports the
idea that this list is distinct. Interestingly, the enriched
TF binding sites may function as clock genes, controlling
circadian rhythm [37]. Another strategy for generating
hypotheses for factors that might regulate a set of genes
is to carry out comparative expression analysis [25],
where two physiological studies are contrasted using
global gene chip data. In this case we present data that
patients with greater weight loss do not appear to have a
common overlap with muscle damage, muscle degenera-
tion in sepsis or muscle remodeling in exercise training
(Figure 4).
Discussion
Cancer cachexia is thought to arise due to an imbalance
of the anabolic and catabolic pathways partly driven by
pro-inflammatory cytokines with consequent loss of
muscle mass (along with an accompanying loss of adipose
tissue). In the present study, the expression of 74 genes
correlated positively with weight loss in cancer cachexia
Stephens et al. Genome Medicine 2010, 2:1
/>Table 3. Genes correlating with weight loss
Center 1 (n = 21) Center 2 (n = 13)
Gene-chip RT-qPCR
CC rectus CC rectus Regression CC vastus Regression CC Regression
Gene abdominis abdominis P-value lateralis P-value diaphragm P-value
APCDD1 -0.74 -0.51 0.03 0.26 NS -0.20 NS
CAMk2B 0.82 0.50 0.01 0.45 0.06 0.50 0.03
EIF3I 0.64 0.50 0.02 0.10 NS 0.20 NS
HGS 0.7 0.67 0.00 0.17 NS 0.20 NS
NUDC 0.65 0.72 0.00 0.13 NS 0.0 NS
POLRMT 0.6 0.51 0.02 0.07 NS 0.0 NS
TIE1 0.67 0.53 0.01 0.70 0.003 0.0 NS
TSC2 0.69 0.47 0.03 0.40 0.1 0.0 NS
Significance analysis of microarrays (SAM) identified 82 genes correlating with weight loss. qRT-PCR validated eight of nine selected targets from this list (correlation
coefficient (CC)). These eight genes were also examined in the cohort from center 2 using RNA extracted from anatomically distinct regions. For each gene the
correlation coefficient from the Affymetrix data set is shown followed by the correlation coefficient for qRT-PCR and a P-value for this latter regression. NS: not
significant.
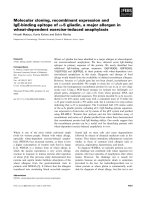
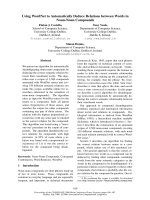
Figure 2. qRT-PCR validates array-identied genes covarying
with weight loss. For each of the genes validated by qRT-PCR
Pearson correlation coecients were generated for expression and
percentage weight loss for both the Aymetrix data and the qRT-PCR
data. All genes except SGK1 validated the array data. P-values for the
correlations ranged from 0.03 to below 0.01. Yellow indicates positive
correlation; blue indicates negative correlation.
APCDD1
CAMk2b
EIF3I
HGS
NUDC
POLRMT
SGK1
TIE1
TSC2
0.8
0.6
0.4
0.2
0.0
-0.2
-0.4
-0.6
PCR Array
Pearson’s correlation coefficient
Page 7 of 12
subjects and that of 9 correlated negatively with it.
Validation of these genes by qRT-PCR provided excellent
technical confirmation of the microarray results.
Biological validation of TIE1 and CaMKIIβ expression in
an independent clinical cohort across distinct muscle
groups, along with supportive network analysis, provides
weight to the claim that these are useful markers of
cancer cachexia in humans. Contrary to evidence from
animal models [7,8,11], there were no significant differ-
ences in expression of the E3 ligases MURF1 and MAFbx,
while FOXO protein activity was unchanged in WL
compared to WS patients. ese observations, combined
with the array and promoter analysis, make it seem
unlikely that FOXO transcription factors regulate the
molecular signature of cachexia in human skeletal
muscle, challenging the relevance of the pre-clinical
literature in this field.
Novel human cancer cachexia markers
e significant correlation of CaMKIIβ mRNA expres-
sion with weight loss along with the small but significant
change in protein levels in rectus abdominis suggests that
CaMKIIβ could be directly involved in human cancer
cachexia. CaMKIIβ mRNA also increased with weight
loss in vastus lateralis and diaphragm. e serine/
threonine kinase CaMKII holoenzyme is activated by
Ca
2+
/calmodulin, leading to autophosphorylation and
maintenance of CaMKII activity even after the Ca
2+
signal
has diminished [38]. CaMKIIβ is expressed in skeletal
muscle, and levels of the protein as well as its
phosphorylation status and activity increase after
exercise training [39]. e relationship between CaMKIIβ
expression and cachexia observed in the present study
implies that the cancer cachexia profile is not simply
'physical inactivity'. In addition, it has recently been
demonstrated that Ca(2+)-CaM-eEF2K signaling may be
responsible for acute exercise-induced inhibition of
muscle protein synthesis [40] and it is thus conceivable
that chronic inappropriate activation of this ‘endurance
training'-related signaling molecule [24] subdues normal
maintenance of skeletal muscle mass. Additional factors
that could modulate CaMKII activity include alterations
in lipid metabolism [41].
e significant positive correlation for TIE1 mRNA
expression with weight loss in both the rectus abdominis
and vastus lateralis muscle groups supports the idea that
some chronic training-related genes are up-regulated in
cachexia. In animal models TIE1 is required for normal
vascular network development [42] while increased TIE1
mRNA levels in human skeletal muscle in response to
physiological adaptation to exercise training has been
demonstrated [43]. Whilst the ligands and signaling
Stephens et al. Genome Medicine 2010, 2:1
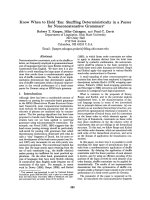
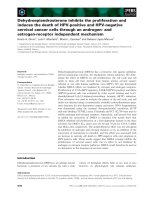
/>Figure 3. CAMkIIβ and TIE1 correlate with weight loss in cancer cachexia. In order to validate the ndings from the rectus abdominis, qRT-PCR
was used to examine mRNA expression of (a) CAMkIIβ and (b) TIE1 in diaphragm (open circles) and vastus lateralis (closed circles) in a separate
clinical cohort. Correlation plots for mRNA level against rate of weight loss are shown. Correlation coecients were signicant with P < 0.05. CAMkII
protein and phospho-protein levels are increased in subjects with weight loss. (c) Protein levels of CAMkII and (d) phosphoCAMkII were assessed
in the rectus abdominis muscle from center 1 subjects by western blot. Intensity levels were normalized against alpha-skeletal actin and the mean
ratio of CAMkII/actin or phosphoCAMkII (pCAMkII)/actin are shown for subjects with less than (black) or more than (white) 5% weight loss. *P-value
<0.05, one-sided Mann Whitney test; n = 59. Error bars represent SEM.
CAMk2ß TIE1
CAMk2ß
20
15
10
5
0
Diaphragm
Vastus
0 1 2 3 4
Wgt loss (kg/mnth)
a)
0
1
2
3
4
0 1 2 3 4
TIE1
Diaphragm
Vastus
Wgt loss (kg/mnth)
b)
CAMKII
CAMKII ratio
Low wgt loss High wgt loss
1.0
0.8
0.6
0.4
0.2
0.0
pCAMKII
Low wgt loss High wgt loss
1.0
0.8
0.6
0.4
0.2
0.0
c) d)
Page 8 of 12
pathways of TIE1 are poorly understood, this receptor
can interact with phosphoinositide 3-kinase and lead to
phosphorylation and activation of Akt, protecting cells
from apoptosis [44]. In functional terms, the
up-regulation of TIE1 may therefore represent a
protective mechanism to oppose apoptosis of some
components of skeletal muscle tissue, for example, the
vascular endo the lium. TIE1 has also recently been linked
to an in vitro endothelial inflammatory response [45]
while an inflam matory gene signature has been shown to
develop through out surgical procedures in muscle [46];
thus, it could be argued that some component of our
gene signa ture may be related to surgery. However, all
biopsies were taken at the earliest point in surgery after
the initial incision.
Furthermore, the correlation of TIE1 expression with
weight loss and the lack of any further appreciable inflam-
matory signature would argue against this possibility. In
addition, there was no evidence that the muscle profile
was that of damage or that observed with systemic
inflam mation associated with multiple organ failure
(Figure 4). It is also notable that (other than TIE1,
CaMKII, CTSA and PRODH) the WL gene signature
does not share similarities with the approximately
500-gene endurance exercise training gene signature [24],
suggesting that the reason for elevated TIE1 and CaMKIIβ
remains to be determined. It may be inappropriate partial
muscle activity signaling but clearly is not simply
increased muscle usage (however unlikely that might
have seemed in such patients). However, the increased
CaMKIIβ mRNA levels associated with weight loss
across a range of muscle tissues imply that these muscle
groups develop dysregulation of calcium sensing or are
burdened by greater loading in the face of failing muscle
function connected with, for example, loss of contractile
machinery or impaired energy metabolism [47].
Finally, recent work has clarified two potential calcium-
independent activation pathways for CaMKII. Genera-
tion of reactive oxygen intermediates can increase or
prolong CaMKII activity, perhaps through inhibition of
protein phosphotases that normally limit CaMKII activa-
tion [48]. CaMKII has also been implicated in muscle
adaptation through phosphorylation of HDAC5 leading
to MyoD/MEF2-driven differentiation of muscle cells
[49]. It is plausible, therefore, that CaMKII activation is a
compensatory strategy in the face of failing protein
synthesis. Alternatively, the CaMKIIβ response may
indicate failure of calcium homeostasis, a factor that
would also activate proteolytic activities such as calpains
and caspases [50,51]. It is thus possible that CaMKIIβ
activa tion occurs at an early stage of cachexia in humans,
providing an early 'read-out' on altered calcium handling.
Human versus animal-model cancer cachexia markers and
study limitations
Given the robust increase in expression of the E3 ligases
reported previously in various animal models of cachexia
[7,8,32], it is surprising that neither microarray nor
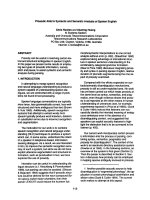
Figure 4. Gene expression signatures demonstrate lack of
relationship between weight loss and muscle damage, muscle
sepsis and exercise training status. The top 20 most regulated
genes by (a) eccentric muscle damage, (b) muscle obtained from
intensive care unit patients and (c) in response to exercise training
were obtained from three published articles (see Methods). The
mean values for these selected genes were then plotted for patients
in the present study that had either less than or more than 5%
weight loss. As can be observed, no single gene, for each of these
‘comparative’ conditions, was dierentially expressed; thus, the gene
expression prole of cancer cachexia does not resemble muscle
damage, sepsis-induced degeneration or exercise training status.
Error bars represent SEM.
Genes altered in eccentric muscle damage
Genes altered in muscle of septic patients
Genes altered by exercise training
a)
b)
c)
<5% Wgt loss
>5% Wgt loss
<5% Wgt loss
>5% Wgt loss
<5% Wgt loss
>5% Wgt loss
Stephens et al. Genome Medicine 2010, 2:1
/>Page 9 of 12
qRT-PCR detected any regulation of MuRF1 and MAFbx.
Furthermore, the 83-gene WL gene signature bore no
resemblance to the Atrogene gene expression signature
[27,32] generated using gene-chips. is is not due to
gene-chip technology being unable to establish parallels
between animal models and humans, as it has previously
been demonstrated that gene expression in skeletal
muscle of intensive care unit patients resembles, in part,
that found in these animal models [27,32]. Indeed, results
of E3 ligase expression analysis from other human models
of cachexia have been contradictory. Studies including
patients following bed rest, amputation for vascular
disease, limb immobilization, chronic obstructive pulmo-
nary disease, amyotrophic lateral sclerosis and ageing
have demonstrated both increased and decreased expres-
sion of MuRF1 and MAFBx [52-56]. is would suggest
that the ubiquitin E3 ligases do not play the same role in
human cancer cachexia as that previously demonstrated
in animal and cell studies. In lung cancer patients with
mean weight loss of 2.9%, there was no evidence of UPP
activation [57] while other human studies in patients
with gastric cancer and mean weight losses of 5.2% and
5.6% have shown increases in components of the UPP
[58,59]. In the present study we could not find any support
for this finding, despite similar degrees of cachexia.
However, cancer cachexia encompasses a spectrum
progressing from early weight loss through to severe
muscle wasting. e prominence of the individual
proteo lytic pathways at different time points along this
spectrum is yet to be determined and one must keep in
mind that during severe tissue wasting, both breakdown
(and of course synthesis) may well be reduced with the
net balance between the two widened.
A role for autophagy in human cancer cachexia has not
been investigated extensively. Increased cathepsin D and
acid phosphatase activity has been demonstrated in
patients with varying tumor types and degrees of weight
loss, suggesting that increased lysosomal activity may
contribute to the development of cachexia [60]. More
recently, lung cancer patients undergoing resection were
shown to have increased levels of cathepsin B mRNA in
skeletal muscle compared with controls [57]. e analyses
examined GABARAPL1 and BNIP3. GABARAPL1 is an
Atg8 homologue important in the formation of the
autophagosome [61] and BNIP3 has been found to play a
predominant role in induction of autophagy in rodent
skeletal muscle [11]. Autophagy can be induced by
starvation of amino acids, which may explain the modest
increase in BNIP3 and GABARAPL1 in patients with SI
where the acute phase response is activated (mobilizing
amino acid from muscle to liver for consumption) and
where food intake may be reduced due to anorexia or
dysphagia. However, no relationship was found between
these genes and patient weight loss.
A limitation of the current study is that we focus on
changes in total body mass and this does not tell us about
the relative contributions from lean body mass and
adipose tissue. Our muscle gene expression clustering
results indicate, however, that there is a skeletal muscle
molecular signature that reflects changes in whole body
mass and it is hard to conceive that this is not somehow
reflecting the changes in the muscle tissue. A further
consideration is adequate control for confounding
parameters, such as inflammation, damage and physical
activity. While these are difficult to directly control, we
produced an analysis to suggest that such processes were
unrelated to our new human muscle cancer cachexia
signature (Figure 4).
Conclusions
Human cancer cachexia is a chronic process and weight
loss is not as rapid and generally not as severe as the
acute muscle wasting observed in animal models. us,
the physiological regulators are most likely very distinct
in each scenario. We found increased expression of two
‘endurance exercise’-activated genes, CaMKIIβ and TIE1,
across different muscle groups in human cancer cachexia.
Whether these could contribute to a reduction in protein
synthesis remains to be ascertained.
Abbreviations
BMI: body mass index; CaMK: calcium/calmodulin-dependent protein kinase;
DTT: dithioreitol; FDR: false discovery rate; GO: Gene Ontology; MAS 5.0:
Microarray Suite; PMSF: phenylmethanesulfonyl uoride; qRT-PCR: quantitative
reverse transcriptase PCR; SI: systemic inammation; SAM: signicance
analysis of microarrays; TBS: tris-buered saline; TBST: TBS with Tween 20; UPP:
ubiquitin proteosome pathway; WL: weight losing; WS: weight stable.
Acknowledgements
This project was funded in part by an Aymetrix Translational Medicine
award (JT), Swedish Sport Foundation (JT), Heriot-Watt University (JT) and an
award from CRUK (KCHF). Additional funding: UICC ICRETT Fellowship (NAS),
Capacity Building Grant (SUPAC) from the NCRI (KCHF), Swedish Research
Council (grants 04210 and 14244), Karolinska Research Foundation, Karolinska
University Hospital Research Funds and Swedish Cancer Society (OR). Western
blot analysis was supported by an award to KCHF and JAT (WHMSB EU 091)
from the Translational Medicine Research Collaboration - a consortium made
up of the Universities of Aberdeen, Dundee, Edinburgh and Glasgow, the four
associated Health Boards (Grampian, Tayside, Lothian and Greater Glasgow
and Clyde), Scottish Enterprise and Wyeth Pharmaceuticals. The European
Research Council provided support to TTM under the EU 7th Framework
Programme (FP7/2007-2013)/ERC grant agreement 204135. The authors
would like to thank John Fox for technical assistance during this study.
Authors’ contributions
The genomics analysis strategy and statistical analysis was developed and
carried out by JAT and IJG. Wet-lab genomic analysis was carried out by IJG,
Additional data le 1. Primers used in the study, genes associated
with systemic inammation and data on autophagy pathway genes.
Additional data le 2. Genes associated with weight loss or
systemic inammation in cancer cachexia.
Additional data le 3. Figures and gure legends for supplementary
gures referred to in the text.
Stephens et al. Genome Medicine 2010, 2:1
/>Page 10 of 12
NAS, TM, OR and JAT. Western analysis was carried out by NAS, DCG and JAR.
The manuscript was drafted by JAT and IJG. The manuscript was edited by
IJG, NAS, JAT, TM, OR, JAR, DCG and KCHF. The clinical biobank materials were
established by RJES, KCHF, NAS, LL, OR and BT. All authors have given nal
approval to the article.
Author details
1
Department of Clinical and Surgical Sciences (Surgery), School of Clinical
Sciences and Community Health, University of Edinburgh, EH16 4SB, UK
2
Translational Biomedicine, Heriot-Watt University, Edinburgh, EH14 4AS, UK
3
Department of Anaesthesiology and Intensive Care, and Department of
Surgery, Karolinska University Hospital, 14186, Huddinge, Sweden
4
Department of Biology and Biotech Research and Innovation Centre, Ole
Maaloes Vej 5, University of Copenhagen, DK-2200, Denmark
5
Division of Human Cancer Genetics, Ohio State University Medical Center,
Columbus, OH 43210, USA
6
Lifestyle Research Group, The Royal Veterinary College, 4 Royal College Street,
University of London, NW1 0TU, UK
7
Centre for Healthy Ageing, Department of Biomedical Sciences, University of
Copenhagen, Blegdamsvej, DK-2200, Denmark
Competing interests
This project was assisted in part by an Aymetrix Translational Medicine
award (JT) that reduced the cost of the gene-chip analysis. Aymetrix were
not involved in any aspect of the data analysis or interpretation and did not
inuence the manuscript in any way. The authors declare that they have no
competing interests.
Received: 13 September 2009 Revised: 9 December 2009
Accepted: 15 January 2010 Published: 15 January 2010
References
1. Dewys WD, Begg C, Lavin PT, Band PR, Bennett JM, Bertino JR, Cohen MH,
Douglass HO Jr, Engstrom PF, Ezdinli EZ, Horton J, Johnson GJ, Moertel CG,
Oken MM, Perlia C, Rosenbaum C, Silverstein MN, Skeel RT, Sponzo RW,
Tormey DC: Prognostic effect of weight loss prior to chemotherapy in
cancer patients. Eastern Cooperative Oncology Group. Am J Med 1980,
69:491-497.
2. Tisdale MJ: Cachexia in cancer patients. Nat Rev Cancer 2002, 2:862-871.
3. Nixon DW, Mott S, Lawson DH, Ansley J, Lynn MJ, Kutner MH, Heymseld
SB, Wesley M, Chawla R, Rudman D: Total parenteral nutrition as an adjunct
to chemotherapy of metastatic colorectal cancer. Cancer Treat Rep 1981,
65(Suppl 5):121-128.
4. Nixon DW, Lawson DH: Nutritional support of the cancer patient. Hosp
Formul 1983, 18:616-619.
5. Tisdale MJ: Mechanisms of cancer cachexia. Physiol Rev 2009, 89:381-410.
6. Jagoe RT, Goldberg AL: What do we really know about the ubiquitin-
proteasome pathway in muscle atrophy? Curr Opin Clin Nutr Metab Care
2001, 4:183-190.
7. Bodine SC, Latres E, Baumhueter S, Lai VK, Nunez L, Clarke BA, Poueymirou
WT, Panaro FJ, Na E, Dharmarajan K, Pan ZQ, Valenzuela DM, DeChiara TM, Stitt
TN, Yancopoulos GD, Glass DJ: Identification of ubiquitin ligases required
for skeletal muscle atrophy. Science 2001, 294:1704-1708.
8. Gomes MD, Lecker SH, Jagoe RT, Navon A, Goldberg AL: Atrogin-1, a muscle-
specific F-box protein highly expressed during muscle atrophy. Proc Natl
Acad Sci U S A 2001, 98:14440-14445.
9. Schmitt TL, Martignoni ME, Bachmann J, Fechtner K, Friess H, Kinscherf R,
Hildebrandt W: Activity of the Akt-dependent anabolic and catabolic
pathways in muscle and liver samples in cancer-related cachexia. J Mol
Med 2007, 85:647-654.
10. Mammucari C, Schiano S, Sandri M: Downstream of Akt: FoxO3 and mTOR
in the regulation of autophagy in skeletal muscle. Autophagy 2008,
4:524-526.
11. Mammucari C, Milan G, Romanello V, Masiero E, Rudolf R, Del Piccolo P,
Burden SJ, Di Lisi R, Sandri C, Zhao J, Goldberg AL, Schiano S, Sandri M:
FoxO3 controls autophagy in skeletal muscle in vivo. Cell Metab 2007,
6:458-471.
12. Zhao J, Brault JJ, Schild A, Goldberg AL: Coordinate activation of autophagy
and the proteasome pathway by FoxO transcription factor. Autophagy
2008, 4:378-380.
13. Zhao J, Brault JJ, Schild A, Cao P, Sandri M, Schiano S, Lecker SH, Goldberg
AL: FoxO3 coordinately activates protein degradation by the autophagic/
lysosomal and proteasomal pathways in atrophying muscle cells. Cell
Metab 2007, 6:472-483.
14. Khal J, Hine AV, Fearon KC, Dejong CH, Tisdale MJ: Increased expression of
proteasome subunits in skeletal muscle of cancer patients with weight
loss. Int J Biochem Cell Biol 2005, 37:2196-2206.
15. Greenha PL, Karagounis LG, Peirce N, Simpson EJ, Hazell M, Layeld R,
Wackerhage H, Smith K, Atherton P, Selby A, Rennie MJ: Disassociation
between the effects of amino acids and insulin on signaling, ubiquitin
ligases, and protein turnover in human muscle. Am J Physiol Endocrinol
Metab 2008, 295:E595-604.
16. Emery PW, Edwards RH, Rennie MJ, Souhami RL, Halliday D: Protein synthesis
in muscle measured in vivo in cachectic patients with cancer. Br Med J (Clin
Res Ed) 1984, 289:584-586.
17. Livak KJ, Schmittgen TD: Analysis of relative gene expression data using
real-time quantitative PCR and the 2(-Delta Delta C(T)) method. Methods
2001, 25:402-408.
18. Sandberg R, Larsson O: Improved precision and accuracy for microarrays
using updated probe set definitions. BMC Bioinformatics 2007, 8:48.
19. Irizarry RA, Hobbs B, Collin F, Beazer-Barclay YD, Antonellis KJ, Scherf U, Speed
TP: Exploration, normalization, and summaries of high density
oligonucleotide array probe level data. Biostatistics 2003, 4:249-264.
20. Tusher VG, Tibshirani R, Chu G: Significance analysis of microarrays applied
to the ionizing radiation response. Proc Natl Acad Sci U S A 2001,
98:5116-5121.
21. Gentleman RC, Carey VJ, Bates DM, Bolstad B, Dettling M, Dudoit S, Ellis B,
Gautier L, Ge Y, Gentry J, Hornik K, Hothorn T, Huber W, Iacus S, Irizarry R,
Leisch F, Li C, Maechler M, Rossini AJ, Sawitzki G, Smith C, Smyth G, Tierney L,
Yang JY, Zhang J: Bioconductor: open software development for
computational biology and bioinformatics. Genome Biol 2004, 5:R80.
22. Smyth GK: Limma: linear models for microarray data. In Bioinformatics and
Computational Biology Solutions using R and Bioconductor. Edited by
Gentleman R, Carey V, Dudoit S, R. Irizarry WH. New York: Springer; 2005:
397-420.
23. Benjamini Y, Hochberg Y: Controlling the false discovery rate: a practical
and powerful approach to multiple testing. J R Stat Soc B 1995, 57:289-300.
24. Timmons JA, Larsson O, Jansson E, Fischer H, Gustafsson T, Greenha PL,
Ridden J, Rachman J, Peyrard-Janvid M, Wahlestedt C, Sundberg CJ: Human
muscle gene expression responses to endurance training provide a novel
perspective on Duchenne muscular dystrophy. Faseb J 2005, 19:750-760.
25. Timmons JA, Wennmalm K, Larsson O, Walden TB, Lassmann T, Petrovic N,
Hamilton DL, Gimeno RE, Wahlestedt C, Baar K, Nedergaard J, Cannon B:
Myogenic gene expression signature establishes that brown and white
adipocytes originate from distinct cell lineages. Proc Natl Acad Sci U S A
2007, 104:4401-4406.
26. Mahoney DJ, Safdar A, Parise G, Melov S, Fu M, MacNeil L, Kaczor J, Payne ET,
Tarnopolsky MA: Gene expression profiling in human skeletal muscle
during recovery from eccentric exercise. Am J Physiol Regul Integr Comp
Physiol 2008, 294:R1901-1910.
27. Fredriksson K, Tjader I, Keller P, Petrovic N, Ahlman B, Scheele C, Wernerman J,
Timmons JA, Rooyackers O: Dysregulation of mitochondrial dynamics and
the muscle transcriptome in ICU patients suffering from sepsis induced
multiple organ failure. PLoS ONE 2008, 3:e3686.
28. Ashburner M, Ball CA, Blake JA, Botstein D, Butler H, Cherry JM, Davis AP,
Dolinski K, Dwight SS, Eppig JT, Harris MA, Hill DP, Issel-Tarver L, Kasarskis A,
Lewis S, Matese JC, Richardson JE, Ringwald M, Rubin GM, Sherlock G: Gene
ontology: tool for the unification of biology. The Gene Ontology
Consortium. Nat Genet 2000, 25:25-29.
29. Alexa A, Rahnenfuhrer J, Lengauer T: Improved scoring of functional groups
from gene expression data by decorrelating GO graph structure.
Bioinformatics 2006, 22:1600-1607.
30. Ingenuity Pathway Analysis Software - Complete Pathways Database
[ />31. Bryne JC, Valen E, Tang MH, Marstrand T, Winther O, da Piedade I, Krogh A,
Lenhard B, Sandelin A: JASPAR, the open access database of transcription
factor-binding profiles: new content and tools in the 2008 update. Nucleic
Acids Res 2008, 36(Database issue):D102-106.
32. Lecker SH, Jagoe RT, Gilbert A, Gomes M, Baracos V, Bailey J, Price SR, Mitch
WE, Goldberg AL: Multiple types of skeletal muscle atrophy involve a
common program of changes in gene expression. Faseb J 2004, 18:39-51.
33. Huang da W, Sherman BT, Lempicki RA: Systematic and integrative analysis
Stephens et al. Genome Medicine 2010, 2:1
/>Page 11 of 12
of large gene lists using DAVID bioinformatics resources. Nat Protoc 2009,
4:44-57.
34. Falcon S, Gentleman R: Using GOstats to test gene lists for GO term
association. Bioinformatics 2007, 23:257-258.
35. Filippatos GS, Kanatselos C, Manolatos DD, Vougas B, Sideris A, Kardara D,
Anker SD, Kardaras F, Uhal B: Studies on apoptosis and fibrosis in skeletal
musculature: a comparison of heart failure patients with and without
cardiac cachexia. Int J Cardiol 2003, 90:107-113.
36. Keller P, Keller C, Carey AL, Jaured S, Fischer CP, Steensberg A, Pedersen BK:
Interleukin-6 production by contracting human skeletal muscle: autocrine
regulation by IL-6. Biochem Biophys Res Commun 2003, 310:550-554.
37. Bozek K, Relogio A, Kielbasa SM, Heine M, Dame C, Kramer A, Herzel H:
Regulation of clock-controlled genes in mammals. PLoS One 2009, 4:e4882.
38. Chin ER: The role of calcium and calcium/calmodulin-dependent kinases
in skeletal muscle plasticity and mitochondrial biogenesis. Proc Nutr Soc
2004, 63:279-286.
39. Rose AJ, Frosig C, Kiens B, Wojtaszewski JF, Richter EA: Effect of endurance
exercise training on Ca2+ calmodulin-dependent protein kinase II
expression and signaling in skeletal muscle of humans. J Physiol 2007,
583:785-795.
40. Rose AJ, Alsted TJ, Kobberø JB, Maarbjerg SJ, Jensen J, Richter EA: A Ca(2+)-
calmodulin-eEF2K-eEF2 signalling cascade, but not AMPK, contributes to
the suppression of skeletal muscle protein synthesis during contractions. J
Physiol 2009, 587:1547-1563.
41. Raney MA, Turcotte LP: Evidence for the involvement of CaMKII and AMPK
in Ca2+-dependent signaling pathways regulating FA uptake and
oxidation in contracting rodent muscle. J Appl Physiol 2008, 104:1366-1373.
42. Sato TN, Tozawa Y, Deutsch U, Wolburg-Buchholz K, Fujiwara Y, Gendron-
Maguire M, Gridley T, Wolburg H, Risau W, Qin Y: Distinct roles of the
receptor tyrosine kinases Tie-1 and Tie-2 in blood vessel formation. Nature
1995, 376:70-74.
43. Timmons JA, Jansson E, Fischer H, Gustafsson T, Greenha PL, Ridden J,
Rachman J, Sundberg CJ: Modulation of extracellular matrix genes reflects
the magnitude of physiological adaptation to aerobic exercise training in
humans. BMC Biol 2005, 3:19.
44. Kontos CD, Cha EH, York JD, Peters KG: The endothelial receptor tyrosine
kinase Tie1 activates phosphatidylinositol 3-kinase and Akt to inhibit
apoptosis. Mol Cell Biol 2002, 22:1704-1713.
45. Chan B, Sukhatme VP: Suppression of Tie-1 in endothelial cells in vitro
induces a change in the genome-wide expression profile reflecting an
inflammatory function. FEBS Lett 2009, 583:1023-1028.
46. Witasp A, Nordfors L, Schalling M, Nygren J, Ljungqvist O, Thorell A: Increased
expression of inflammatory pathway genes in skeletal muscle during
surgery. Clin Nutr 2009, 28:291-298.
47. Timmons JA, Gustafsson T, Sundberg CJ, Jansson E, Hultman E, Kaijser L,
Chwalbinska-Moneta J, Constantin-Teodosiu D, Macdonald IA, Greenha PL:
Substrate availability limits human skeletal muscle oxidative ATP
regeneration at the onset of ischemic exercise. J Clin Invest 1998, 101:79-85.
48. Howe CJ, Lahair MM, McCubrey JA, Franklin RA: Redox regulation of the
calcium/calmodulin-dependent protein kinases. J Biol Chem 2004,
279:44573-44581.
49. McKinsey TA, Zhang CL, Lu J, Olson EN: Signal-dependent nuclear export of
a histone deacetylase regulates muscle differentiation. Nature 2000,
408:106-111.
50. Jones SW, Hill RJ, Krasney PA, O’Conner B, Peirce N, Greenha PL: Disuse
atrophy and exercise rehabilitation in humans profoundly affects the
expression of genes associated with the regulation of skeletal muscle
mass. Faseb J 2004, 18:1025-1027.
51. Menconi MJ, Wei W, Yang H, Wray CJ, Hasselgren P-O: Treatment of cultured
myotubes with the calcium ionophore A23187 increases proteasome
activity via a CaMK II-caspase-calpain-dependent mechanism. Surgery
2004, 136:135-142.
52. Doucet M, Russell AP, Leger B, Debigare R, Joanisse DR, Caron MA, LeBlanc P,
Maltais F: Muscle atrophy and hypertrophy signaling in patients with
chronic obstructive pulmonary disease. Am J Respir Crit Care Med 2007,
176:261-269.
53. Salanova M, Schi G, Puttmann B, Schoser BG, Blottner D: Molecular
biomarkers monitoring human skeletal muscle fibres and
microvasculature following long-term bed rest with and without
countermeasures. J Anat 2008, 212:306-318.
54. Leger B, Vergani L, Soraru G, Hespel P, Derave W, Gobelet C, D’Ascenzio C,
Angelini C, Russell AP: Human skeletal muscle atrophy in amyotrophic
lateral sclerosis reveals a reduction in Akt and an increase in atrogin-1.
Faseb J 2006, 20:583-585.
55. de Palma L, Marinelli M, Pavan M, Orazi A: Ubiquitin ligases MuRF1 and
MAFbx in human skeletal muscle atrophy. Joint Bone Spine 2008, 75:53-57.
56. Edstrom E, Altun M, Hagglund M, Ulfhake B: Atrogin-1/MAFbx and MuRF1
are downregulated in aging-related loss of skeletal muscle. J Gerontol A Biol
Sci Med Sci 2006, 61:663-674.
57. Jagoe RT, Redfern CP, Roberts RG, Gibson GJ, Goodship TH: Skeletal muscle
mRNA levels for cathepsin B, but not components of the ubiquitin-
proteasome pathway, are increased in patients with lung cancer referred
for thoracotomy. Clin Sci (Lond) 2002, 102:353-361.
58. Bossola M, Muscaritoli M, Costelli P, Bellantone R, Pacelli F, Busquets S, Argiles
J, Lopez-Soriano FJ, Civello IM, Baccino FM, Rossi Fanelli F, Doglietto GB:
Increased muscle ubiquitin mRNA levels in gastric cancer patients. Am J
Physiol Regul Integr Comp Physiol 2001, 280:R1518-1523.
59. Bossola M, Muscaritoli M, Costelli P, Grieco G, Bonelli G, Pacelli F, Rossi Fanelli F,
Doglietto GB, Baccino FM: Increased muscle proteasome activity correlates
with disease severity in gastric cancer patients. Ann Surg 2003, 237:384-389.
60. Schersten T, Lundholm K: Lysosomal enzyme activity in muscle tissue from
patients with malignant tumor. Cancer 1972, 30:1246-1251.
61. Tanida I, Ueno T, Kominami E: LC3 conjugation system in mammalian
autophagy. Int J Biochem Cell Biol 2004, 36:2503-2518.
Stephens et al. Genome Medicine 2010, 2:1
/>doi:10.1186/gm122
Cite this article as: Stephens NA, et al.: Using transcriptomics to identify
and validate novel biomarkers of human skeletal muscle cancer cachexia.
Genome Medicine 2010, 2:1.
Page 12 of 12