báo cáo khoa học: " Investigation of post-transcriptional gene regulatory networks associated with autism spectrum disorders by microRNA expression profiling of lymphoblastoid cell lines" pps
Bạn đang xem bản rút gọn của tài liệu. Xem và tải ngay bản đầy đủ của tài liệu tại đây (795.28 KB, 18 trang )
Sarachana et al. Genome Medicine 2010, 2:23
/>
RESEARCH
Open Access
Investigation of post-transcriptional gene
regulatory networks associated with autism
spectrum disorders by microRNA expression
profiling of lymphoblastoid cell lines
Tewarit Sarachana1, Rulun Zhou2, Guang Chen2, Husseini K Manji2 and Valerie W Hu1*
Abstract
Background: Autism spectrum disorders (ASD) are neurodevelopmental disorders characterized by abnormalities
in reciprocal social interactions and language development and/or usage, and by restricted interests and
repetitive behaviors. Differential gene expression of neurologically relevant genes in lymphoblastoid cell lines from
monozygotic twins discordant in diagnosis or severity of autism suggested that epigenetic factors such as DNA
methylation or microRNAs (miRNAs) may be involved in ASD.
Methods: Global miRNA expression profiling using lymphoblasts derived from these autistic twins and unaffected
sibling controls was therefore performed using high-throughput miRNA microarray analysis. Selected differentially
expressed miRNAs were confirmed by quantitative reverse transcription-polymerase chain reaction (qRT-PCR) analysis,
and the putative target genes of two of the confirmed miRNA were validated by knockdown and overexpression of
the respective miRNAs.
Results: Differentially expressed miRNAs were found to target genes highly involved in neurological functions and
disorders in addition to genes involved in gastrointestinal diseases, circadian rhythm signaling, as well as steroid
hormone metabolism and receptor signaling. Novel network analyses of the putative target genes that were inversely
expressed relative to the relevant miRNA in these same samples further revealed an association with ASD and other
co-morbid disorders, including muscle and gastrointestinal diseases, as well as with biological functions implicated in
ASD, such as memory and synaptic plasticity. Putative gene targets (ID3 and PLK2) of two RT-PCR-confirmed brainspecific miRNAs (hsa-miR-29b and hsa-miR-219-5p) were validated by miRNA overexpression or knockdown assays,
respectively. Comparisons of these mRNA and miRNA expression levels between discordant twins and between casecontrol sib pairs show an inverse relationship, further suggesting that ID3 and PLK2 are in vivo targets of the respective
miRNA. Interestingly, the up-regulation of miR-23a and down-regulation of miR-106b in this study reflected miRNA
changes previously reported in post-mortem autistic cerebellum by Abu-Elneel et al. in 2008. This finding validates
these differentially expressed miRNAs in neurological tissue from a different cohort as well as supports the use of the
lymphoblasts as a surrogate to study miRNA expression in ASD.
Conclusions: Findings from this study strongly suggest that dysregulation of miRNA expression contributes to the
observed alterations in gene expression and, in turn, may lead to the pathophysiological conditions underlying autism.
Background
Autism spectrum disorders (ASD) is a collective term
used to describe neurodevelopmental disorders with a
*Correspondence:
1
Department of Biochemistry and Molecular Biology, The George Washington
University Medical Center, 2300 Eye St NW, Washington, DC 20037, USA
Full list of author information is available at the end of the article
pattern of qualitative abnormalities in three functional
domains: reciprocal social interactions, communication,
and restrictive interests and/or repetitive behaviors [1].
There is strong evidence that 10 to 15% of ASD cases may
be etiologically related to known genetic disorders, such
as fragile X syndrome, tuberous sclerosis complex, and
Rett syndrome [2,3]. However, the etiology of ASD in
© 2010 Sarachana et al; licensee BioMed Central Ltd. This is an Open Access article distributed under the terms of the Creative
Commons Attribution License ( which permits unrestricted use, distribution, and
reproduction in any medium, provided the original work is properly cited.
Sarachana et al. Genome Medicine 2010, 2:23
/>
most cases remains unknown, as is the explanation for
the strong male:female gender bias (at least 4:1) [4]. With
regard to identifying genes associated with idiopathic
autism, which represents 80 to 90% of ASD cases, a
number of previous studies have conducted genomewide scans to ascertain genetic linkage to, or association
with, ASD. To date, autism susceptibility loci have been
identified on almost every chromosome, especially
chromosomes 2q [5], 3q [6], 5p [7], 6q [8], 7q [5,9], 11p
[7], 16p [5], and 17q [7,10]. No single chromosomal
location, however, has been found to be highly significant,
and no genetic variation or mutation within these regions
has been found to account for more than 1% of ASD
cases. Copy number variation has also been associated
with ASD, and the most recent whole genome scan
performed by The Autism Consortium (2008) revealed a
recurrent microdeletion and a reciprocal microduplication on chromosome 16p11.2 [11]. Moreover, a number
of publications have demonstrated the relevance of
particular genes to ASD, and numerous candidate genes
for autism have been identified, including NLGN3/4
[12,13], SHANK3 [14], NRXN1 [15], and CNTNAP2
(Contactin associated protein-like 2) [16-18]. Interestingly, all of these genes function at the synapse, thereby
focusing attention on dysregulation of synapse formation
as a neuropathological mechanism in ASD [19,20].
However, studying a single ASD candidate gene at a time
is not likely to provide a comprehensive explanation of all
pathophysiological conditions associated with these
disorders, which are believed to result from dysregulation
of multiple genes.
To examine global transcriptional changes associated
with ASD, Hu and colleagues [21] examined differential
gene expression with DNA microarrays using lymphoblastoid cell lines (LCLs) from discordant monozygotic
twins, one co-twin of which was diagnosed with autism
while the other was not. They found that a number of
genes important to nervous system development and
function were among the most differentially expressed
genes. Furthermore, these genes could be placed in a relational gene network centered on inflammatory mediators,
some of which were increased in the autopsied brain tissue
of autistic patients relative to non-autistic controls (for
example, IL6) [22]. Inasmuch as monozygotic twins share
the same genotype, the results of this study further
suggested a role for epigenetic factors in ASD.
MicroRNAs (miRNAs) as well as other factors such as
DNA methylation and chromatin remodeling are thus
likely candidates in the epigenetic regulation of gene
expression. miRNAs are endogenous, single-stranded,
non-coding RNA molecules of approximately 22 nucleotides in length that negatively and post-transcriptionally
regulate gene expression. The biogenesis and suppressive
mechanisms of miRNAs have been comprehensively
Page 2 of 18
described in many studies [23-27], and include miRNAmediated translational repression that may also ultimately lead to degradation of the transcript. miRNAs are
involved in nervous system development and function
[28-31]. In addition, disrupted miRNA function has been
proposed to be associated with a number of neurological
diseases, such as fragile X syndrome [32-35], schizophrenia [36], and spinal muscular atrophy [37]. Recently,
two studies have reported differential expression of
miRNA in ASD, one using LCLs as an experimental
model [38], and the other interrogating miRNA expression directly in autistic and nonautistic brain tissues [39].
However, neither of these studies demonstrated correlation between the differentially expressed miRNA and
differential expression of the putative target genes or
gene products.
We postulated that altered miRNA expression would
result, in part, in altered expression of its target genes.
Therefore, we employed miRNA microarrays to study the
miRNA expression profiles of LCL from male autistic
case-controls, which included monozygotic twins
discordant for ASD and their nonautistic siblings as well
as autistic and unaffected siblings. miRNA expression
profiling revealed significantly differentially expressed
miRNAs whose putative target genes are associated with
neurological diseases, nervous system development and
function, as well as other co-morbid disorders associated
with ASD, such as gastrointestinal, muscular, and inflammatory disorders. The goal of this study was to reveal
dysregulation in miRNA levels that are inversely
correlated with altered levels of target genes that, in turn,
may be associated with the underlying pathophysiology
of ASD, and to provide a better understanding of the role
of miRNAs as a post-transcriptional gene regulatory
mechanism associated with ASD.
Methods
Experimental model and cell culture
LCL derived from peripheral lymphocytes of 14 male
subjects were obtained from the Autism Genetic Resource
Exchange (AGRE, Los Angeles, CA, USA). The subjects
included three pairs of monozygotic twins discordant for
diagnosis of autism, a normal sibling for two of the twin
pairs, two pairs of autistic and unaffected siblings, and a
pair of normal monozygotic twins. These cell lines had all
been used previously for gene expression profiling [21,40]
and thus allowed us to compare miRNA expression
profiles with mRNA expression levels across the affected
and control samples from both studies. The frozen cells
were cultured in L-Glutamine-added RPMI 1640
(Mediatech Inc., Herndon, VA, USA) with 15% triple-0.1
m-filtered fetal bovine serum (Atlanta Biologicals,
Lawrenceville, GA, USA) and 1% penicillin-streptomycinamphotericin (Mediatech Inc.).
Sarachana et al. Genome Medicine 2010, 2:23
/>
According to the protocol from the Rutgers University
Cell and DNA Repository (which contains the AGRE
samples), cultures were split 1:2 every 3 to 4 days, and cells
were harvested for miRNA isolation 3 days after a split,
while the cell lines were in logarithmic growth phase. All
cell lines were cultured and harvested at the same time
with the same procedures and reagents to minimize the
differences in miRNA expression that might occur as a
result of different cell and miRNA preparations.
miRNA isolation
LCLs were disrupted in TRIzol Reagent (Invitrogen,
Carlsbad, CA, USA) and miRNAs were then extracted
from the TRIzol lysate using the mirVana miRNA
Isolation Kit (Ambion, Austin, TX, USA) according to the
manufacturers’ protocols. Briefly, ethanol (100%) was
added to TRIzol-extracted, purified RNA in water to
bring the samples to 25% ethanol and the mixture was
then passed through the mirVana glass-fiber filter, which
allowed passage of small RNA in the filtrate. Ethanol was
added to the filtrate to increase the ethanol concentration
to 55%, and the mixture was passed through the second
glass-fiber filter, which immobilized the small RNAs.
After washing, the immobilized small RNAs were eluted
in DNase-RNase-free water (Invitrogen), yielding an
RNA fraction highly enriched in small RNA species
(≤200 nucleotides). The concentration of the small RNAs
in the final fraction was then measured with a NanoDrop
1000 spectrophotometer (Thermo Fisher Scientific,
Wilmington, DE, USA). To enable comparison of miRNA
expression patterns across all of the samples, equal
amounts of miRNAs from unaffected siblings and normal
control individuals were pooled to make a common
reference miRNA that was co-hybridized with each
sample on the miRNA microarray.
miRNA microarray analysis
Custom-printed miRNA microarrays were used to screen
miRNA expression profiles of LCLs from autistic and
normal or undiagnosed individuals. The array slides were
printed in the Microarray CORE Facility of the National
Human Genome Research Institute (NHGRI, NIH,
Bethesda, MD, USA). The complete set of non-coding
RNAs printed in triplicate on Corning epoxide-coated
slides (Corning Inc., Corning, NY, USA) is shown in
Additional file 1, with the subset of human miRNAs
shown on the second sheet of the Excel workbook.
Although the printed arrays also included miRNA from
rat and mouse species as well as some small nucleolar
RNAs, these were not considered in our analyses. miRNA
labeling and microarray hybridization were performed
using Ambion’s miRNA Labeling Kit and Bioarray
Essential Kit, respectively, according to the manufacturer’s
instructions. Briefly, a 20- to 50-nucleotide tail was added
Page 3 of 18
to the 3’ end of each miRNA in the sample using
Escherichia coli Poly (A) polymerase. The aminemodified miRNAs were then purified and coupled to
amine-reactive NHS-ester CyDye fluors (Amersham
Biosciences, Piscataway, NJ, USA). A reference design
was used for microarray hybridization in this study. The
sample miRNAs were coupled with Cy3, whereas the
common reference miRNA was coupled with Cy5, and
two-colored miRNA microarray analyses were carried
out by co-hybridizing an equal amount of both miRNA
samples onto one slide.
After hybridization and washing, the microarrays were
scanned with a ScanArray 5000 fluorescence scanner
(PerkinElmer, Waltham, MA, USA) and the raw pixel
intensity images were analyzed using IPLab image processing software package (Scanalytics, Fairfax, VA, USA). The
program performs statistical methods that have been
previously described [41] to locate specific miRNAs on the
array, measure local background for each of them, and
subtract the respective background from the spot intensity
value (average of triplicate spots). Besides the background
subtraction, the IPLab program was also used for withinarray normalization and data filtering. Fluorescence ratios
within the array were normalized according to a ratio
distribution method at confidence level = 99.00. The
filtered data from the IPLab program were then uploaded
into R version 2.6.1 software package to perform array
normalization across all of the samples based upon
quantile-quantile (Q-Q) plots, using a procedure known as
quantile normalization [42]. After normalization, 1,237
miRNAs were detectable above background.
Assessing significance of miRNA expression
To identify significantly differentially expressed miRNA,
the normalized data were uploaded into the TIGR
Multiexperiment Viewer (TMeV) 3.1 software package
[43,44] to perform statistical analyses on the microarray
data as well as cluster analyses of the differentially
expressed genes. Pavlidis template matching analyses
[45] were carried out to identify significantly differentially
expressed probes between autistic and control groups (P
≤0.05). Cluster analyses were performed with the
significantly differentially expressed miRNAs using the
hierarchical cluster analysis program within TMeV, based
on Euclidean distance using average linkage clustering
methods. Principal component analysis was further
employed to reduce the dimensionality of the microarray
data and display the overall separation of samples from
autistic and control groups.
Prediction of the potential target genes
The lists of the potential target genes of the differentially
expressed miRNAs were generated using miRBase [46]
where the miRanda algorithm is used to scan all available
Sarachana et al. Genome Medicine 2010, 2:23
/>
mRNA sequences to search for maximal local complementarity alignment between the miRNA and the 3’ UTR
sequences of putative predicted mRNA targets. The
benefit of using this program is that it also provides Porthologous-group (P-org) values, which represent
estimated probability values of the same miRNA family
binding to multiple transcripts for different species in an
orthologous group. The values are calculated from the
level of sequence conservation between all of the 3’ UTRs
according to the statistical model previously described
[47]. Only target sites for which the P-org value was <0.05
were included to minimize false positive predictions. The
number of target genes was different for each miRNA,
but the range of targets per miRNA was between 600 and
1,200 protein-coding genes.
Preliminary functional analyses of the potential target genes
Ingenuity Pathway Analysis (IPA) version 6.0 (Ingenuity
Systems, Redwood City, CA, USA) and Pathway Studio
version 5 (Ariadne Genomics, Rockville, MD, USA)
network prediction software were used to identify gene
networks, biological functions, and canonical pathways
that might be impacted by dysregulation of the differentially expressed miRNAs, using the lists of predicted
target genes of each differentially expressed miRNA to
interrogate the gene databases. The Fisher exact test was
used to identify significant pathways and functions
associated with the gene datasets.
miRNA TaqMan qRT-PCR analysis
Among the differentially expressed miRNAs, four brainspecific or brain-related miRNAs (hsa-miR-219, hsamiR-29, hsa-miR-139-5p, and hsa-miR-103) were selected
for confirmation analysis by miRNA TaqMan quantitative
reverse-transcription PCR (qRT-PCR) assays (Applied
Biosystems, Foster City, CA, USA). Small nucleolar RNA,
C/D box 24 (RNU24) was used as an endogenous control
in all qRT-PCR experiments. According to the Applied
Biosystems TaqMan MicroRNA Assay protocol, cDNA
was reverse transcribed from 10 ng of total RNA using
specific looped miRNA RT primers, which allow for
specific RT reactions for mature miRNAs only. The
cDNA was then amplified by PCR, which uses TaqMan
minor groove binder probes containing a reporter dye
(FAM dye) linked to the 5’ end of the probe, a minor
groove binder at the 3’ end of the probe, and a nonfluorescence quencher at the 3’ end of the probe. The
design of these probes allows for more accurate measurement of reporter dye contributions than possible with
conventional fluorescence quenchers.
Meta-analysis of gene expression data for these same samples
A meta-analysis was performed to correlate differential
miRNA expression with gene expression data that had
Page 4 of 18
previously been obtained by our laboratory using the
same samples. However, because the discordant twin
study [21] and that involving affected-unaffected sib pairs
[40] were performed using a different experimental
design for microarray hybridization (that is, direct
sample comparison on the same array for the twin
samples and a reference design for the sib-pair analysis
that involved co-hybridization of each sibling sample
with Stratagene Universal human reference RNA), the
expression data from the sib-pair study was reanalyzed in
order to report differences as log2 expression ratios
between the affected and unaffected siblings, which is the
expression format used in the twin study. Data filtration
was performed using TMeV version 3.1 software [43] to
extract only genes for which expression values were
present in at least four out of seven comparisons. The
filtered data were then uploaded into the R statistical
software package [48] to carry out quantile normalization. After global data distribution and normalization
of data to the same level to enable comparison of gene
expression data across the combined set of samples, a
one-class t-test analysis was conducted across all log2
ratios using TMeV, and significantly differentially
expressed genes were identified as those with P-values
<0.05. In order to capture the largest number of putative
target genes of the differentially expressed miRNAs for
our correlation analysis, we performed the t-test without
multiple sample correction. The complete list of
differentially expressed genes is provided in Additional
file 2.
Correlation between the expression of the target genes
and the candidate miRNAs
To identify the differentially expressed genes potentially
regulated by the differentially expressed miRNAs in
autistic individuals, the overlapping genes between the
significant gene list from the one-class t-test (P < 0.05)
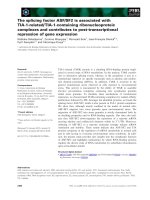
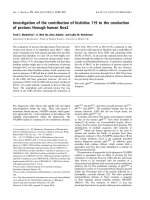
and the list of the potential target genes of all the differentially regulated miRNAs were identified. Figure 1
shows a schematic of the procedure used to correlate
miRNA and putative target genes. To correlate miRNA
expression with putative target gene expression, the
average log2 expression ratios of miRNA for autistic
versus unaffected groups were calculated and then
compared against the average log2 mRNA expression
ratios for these same groups. Only the target genes that
were expressed in the opposite direction from that of the
pertinent miRNAs were extracted for functional analyses.
Although miRNA often acts as a translational repressor
in mammalian cells, the targeted mRNA species is often
delivered to P-bodies, where it is eventually degraded
[49]. Thus, we decided to perform pathway analyses only
on those genes whose mRNA changes were directionally
opposite to the change in miRNA expression, while
Sarachana et al. Genome Medicine 2010, 2:23
/>
Page 5 of 18
TIGR40K cDNA Microarray
Custom MicroRNA Microarray
41,472 genes
716 unique human miRNAs
PTM
t-test
43 miRNA; P-value < 0.05
3,905 genes; P-value < 0.05
miRBase
All putative targets
Potential targets of the
miRNAs
inverse expression
1,406 overlapping genes
1,053 genes
Putative targets of inversely correlated
differentially expressed miRNA
Figure 1. Schematic flow diagram describing procedures
used to identify inversely correlated differentially expressed
putatitve target genes of the differentially expressed miRNAs.
Tens of thousands of putative target genes are associated with the
43 differentially expressed miRNAs, some of which are overlapping
between different miRNAs. For the correlation analyses, we used all of
the putative target genes.
acknowledging that other mRNA species may also be
potential targets of the differentially expressed miRNA.
Identification of biological functions disrupted by
dysregulated target genes
To gain insight into biological functions that may be
disrupted in ASD as a consequence of altered miRNA
expression, the differentially expressed genes whose
transcript levels were inversely correlated with those of
the differentially expressed miRNAs were uploaded into
IPA and Pathway Studio network prediction programs
and the target gene networks were generated. For these
analyses, a relatively stringent expression level cutoff of
log2(ratio) ≥ ±0.4 was used inasmuch as we are typically
able to confirm genes with a log2(ratio) ≥ ±0.3 by qRTPCR. Significant biological functions, canonical pathways, and diseases highly represented in the networks
were identified using Fisher’s exact test (P < 0.05).
Transfection of pre-miRs and anti-miRs
All transfections were performed using siPORT NeoFX
Transfection Agent (Applied Biosystems) according to
the manufacturer’s protocol. Briefly, LCLs were counted
and diluted into 2 × 10⁵ cells/2.3 ml and incubated at
37°C. A total of 5 μl siPORT NeoFX Transfection Agent
per transfection condition was diluted and incubated for
10 minutes at room temperature with 95 μl of the prewarmed complete growth media (without antibiotics).
Hsa-miR-29b pre-miR precursor, hsa-miR-219b anti-miR
inhibitor, Cy3-labeled pre-miR negative control and the
Cy3-labeled anti-miR negative control (Applied Biosystems, Foster City, CA, USA) were separately diluted to
a final small RNA concentration of 30 nM in 100 μl of
complete growth media. Cell suspensions were overlaid
onto each of the transfection solutions and mixed gently
before incubation at 37°C with 5% CO2 for 72 hours.
Under these conditions, most cells were observed by
fluorescence microscopy to be transfected with Cy3labeled pre-miR and anti-miR negative controls (Additional file 3), while cytotoxicity, monitored by the MTS
cell proliferation assay (Promega, Madison, WI, USA)
was determined to be negligible (Additional file 4).
Following the 72-hour incubation, the cells were
harvested for subsequent analyses.
Microarray data deposition
All data from the DNA microarray and miRNA microarray analyses have been deposited in the Gene
Expression Omnibus (GEO) data repository. The GEO
accession number for the miRNA data from this study is
[GEO:GSE21086]. The GEO accession numbers for gene
expression data for the twin and sib-pair studies are
[GEO:GSE4187] and [GEO:GSE15451], respectively.
Results
Significantly differentially expressed miRNAs differentiate
clinical from non-clinical samples
To identify significantly differentially expressed miRNAs
that differentiate clinically discordant individuals,
normalized miRNA microarray data were uploaded into
the TMeV program for statistical analysis. Pavlidis template matching analysis revealed 43 human miRNAs that
were significantly differentially regulated (P < 0.05)
between autistic and nonautistic individuals. These
miRNAs and their corresponding log2 ratios for autistic
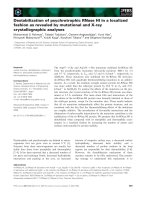
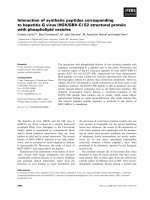
versus control samples are shown in Table 1. Cluster
analyses were performed to further determine whether or
not the expression levels of these miRNAs could
distinguish between the autistic and control groups. Both
unsupervised, hierarchical cluster analysis (Figure 2a) and
supervised, 2-cluster K-means analysis (data not shown)
revealed complete separation of the autistic and control
groups based on expression profiles of the differentially
expressed miRNAs. Principal component analysis
(Figure 2b), which was employed to reduce the dimensionality of the microarray data, also revealed clear separation
between autistic individuals and controls based on the 43
significant probes, which was also validated by support
vector machine analysis that demonstrated 100% accuracy
of class prediction (data not shown).
Biological network prediction of the potential targets
revealed a strong association with neurological functions
and other biological pathways involved in ASD
Potential target genes for each of the differentially
expressed miRNAs were identified using miRBase
Page 6 of 18
Table 1. Significantly differentially expressed human
miRNAs
Clone ID
miRNA
log2 ratio
(a)
P-value
Down-regulated
SM10801
hsa-miR-182-AS
-1.54
1.44E-03
hsa-miR-136
-1.50
2.28E-03
SM10637
hsa-miR-518a
-1.45
3.52E-03
hSQ045460
hsa-miR-153-1
-1.41
5.07E-03
SM11115
hsa-miR-520b
-1.38
AT_1
AT_2
AS_3
AT_4
AS_5
C_6a
CS_3
CS_4
CT_1
C_6b
CT_4
CS_5
CS_2
CT_2
Sarachana et al. Genome Medicine 2010, 2:23
/>
6.71E-03
hSQ018350
SM10529
hsa-miR-455
-1.30
1.25E-02
hHM044864
hsa-miR-326
-1.24
1.95E-02
SM10553
hsa-miR-199b
-1.23
1.96E-02
miR211
hsa-miR-211
-1.23
2.04E-02
hSQ016068
hsa-miR-132
-1.22
2.20E-02
SM10792
hsa-miR-495
-1.20
2.43E-02
hSQ025962
hsa-miR-16-2
-1.19
2.54E-02
hHM044822
hsa-miR-190
-1.18
2.69E-02
hHM044960
hsa-miR-219
-1.17
2.98E-02
hHM045056
hsa-miR-148b
-1.16
3.01E-02
hHM044897
hsa-miR-189
-1.16
3.06E-02
hHM045063
hsa-miR-133b
-1.13
3.59E-02
hSQ018899
hsa-miR-106b
-1.11
4.11E-02
hHM044849
hsa-miR-367
-1.10
4.21E-02
SM10740
hsa-miR-139
-1.10
4.32E-02
(b)
2
1
Up-regulated
hHM044819
hsa-miR-185
1.44
4.04E-03
hHM044919
hsa-miR-103
1.31
1.20E-02
hHM044733
hsa-miR-107
1.26
1.68E-02
hHM044918
hsa-miR-29b
1.24
1.88E-02
hHM045013
hsa-miR-194
1.22
2.11E-02
SM10729
hsa-miR-524
1.22
2.21E-02
hHM044804
hsa-miR-191
1.21
2.23E-02
hsa-miR-376a-AS
1.19
2.53E-02
SM11334
SM10789
hsa-miR-451
1.19
2.64E-02
hHM044971
hsa-miR-23b
1.17
2.95E-02
miR195
hsa-miR-195
1.16
3.02E-02
SM10711
hsa-miR-23b
1.16
3.03E-02
SM10310
hsa-miR-342
1.15
3.24E-02
SM10644
hsa-miR-23a
1.14
3.36E-02
hSQ001775
hsa-miR-186
1.14
3.43E-02
miR25
hsa-miR-25
1.14
3.55E-02
hsa-miR-519c
1.13
3.71E-02
SM10575
SM10238
hsa-miR-346
1.12
3.80E-02
hHM044950
hsa-miR-205
1.12
3.80E-02
hHM044743
hsa-miR-30c
1.11
3.98E-02
hSQ027766
hsa-miR-93
1.10
4.18E-02
hHM045009
hsa-miR-186
1.08
4.67E-02
hHM044831
hsa-miR-106b
1.08
4.86E-02
Forty-three significantly differentially expressed human miRNAs were identified
by Pavlidis Template Matching (PTM) analysis (P < 0.05). The log2 ratios for all
miRNAs were calculated from the average of the log2 ratio across all autistic
samples over the average of the log2 ratio across all control samples.
Figure 2. Hierarchical cluster analysis and principal component
analysis of significantly differentially expressed miRNAs from
the Pavlidis template matching analysis. (a) Unsupervised
hierarchical cluster analysis of 43 significantly differentially expressed
miRNAs between all autistic individuals (red bar) and controls
(turquoise bar) shows the distinct miRNA expression pattern of the
two groups (P < 0.05). The individual samples are coded as follows:
AT, autistic twin; AS, autistic sibling; CT, control, undiagnosed twin;
CS, control, nonautistic sibling; C_6a/b, nonautistic, monozygotic
twins a and b. The same numbers following the sample descriptors
indicate members of the same family. (b) Principal component
analysis of the samples based on the same set of miRNAs reduces the
dimensionality of the data and shows the clear separation between
the autistic individuals (red) and the controls (turquoise).
Targets software [46]. To further identify the biological
networks and functions in which these target genes are
involved, the target gene list for each miRNA was
analyzed using IPA (Table 2). Interestingly, the target
genes of 35 out of the 43 human miRNA probes (more
than 80% of the significantly differentially expressed
miRNAs) were found to be significantly associated with
‘neurological functions’ or ‘nervous system development
and function’ (Fisher’s exact test, P < 0.05).
In addition to gene targets associated with neurological
functions, it is noteworthy that a number of the
Sarachana et al. Genome Medicine 2010, 2:23
/>
Page 7 of 18
Table 2. Ingenuity Pathways Analysis biological functions and pathways associated with potential targets for
significantly differentially expressed miRNAs
miRNA
Biological functions/pathways of the miRNA targets (P-value) [number of genes]*
hsa-miR-182
N (1.18E-03 to 3.86E-02) [59], E (1.49E-03 to 3.70E-02) [14]
hsa-mir-136
G (1.60E-04 to 3.46E-02) [10], A (6.33E-03) [8], E (3.50E-03 to 3.46E-02) [21]
hsa-miR-518a
N (7.24E-03 to 4.89E-02) [50], E (8.57E-05 to 4.44E-02) [20]
hsa-mir-153-1
N (1.02E-05 to 2.24E-02) [28], G (6.37E-04 to 1.53E-02) [13]
hsa-miR-520b
N (2.66E-03 to 4.44E-02) [15], E (8.13E-04 to 4.44E-02) [28]
hsa-miR-455
N (2.03E-03 to 4.51E-02) [83], E (1.06E-03 to 4.51E-02) [42]
hsa-miR-326
S (6.24E-04 to 3.99E-02) [28]
hsa-miR-199b
N (8.24E-04 to 4.23E-02) [31], E (6.04E-03 to 4.23E-02) [21], S (5.23E-03 to 4.23E-02) [11]
hsa-miR-211
N (7.78E-05 to 2.99E-02) [15], I (6.23E-04 to 2.99E-02) [19]
hsa-mir-132
N (2.01E-03 to 4.48E-02) [19], G (2.01E-03 to 4.48E-02) [23], E (2.01E-03 to 4.48E-02) [28]
hsa-miR-495
N (6.09E-04 to 4.02E-02) [48], G (1.62E-03 to 4.02E-02) [10], E (2.51E-04 to 4.02E-02) [24]
hsa-mir-16-2
N (8.75E-05 to 4.45E-02) [13], E (1.06E-03 to 4.45E-02) [24], S (1.58E-03 to 4.45E-02) [17], Es (4.86E-02) [9]
hsa-miR-190
N (6.63E-04 to 3.86E-02) [39], G (2.15E-03 to 3.86E-02) [12], E (3.83E-04 to 4.15E-02) [25]
hsa-miR-219
N (1.08E-03 to 4.34E-02) [87], E (1.88E-03 to 4.34E-02) [11]
hsa-miR-148b
N (6.54E-04 to 4.63E-02) [27], G (3.81E-04 to 4.63E-02) [27]
hsa-miR-189
N (1.57E-03 to 3.76E-02) [23}, E (1.57E-03 to 3.76E-02) [19]
hsa-miR-133b
E (7.84E-04 to 2.56E-02) [17]
hsa-mir-106b
N (1.37E-03 to 4.41E-02) [21], G (1.01E-02 to 4.23E-02) [33], I (1.54E-03 to 4.38E-02) [18]
hsa-miR-367
N (1.35E-03 to 4.37E-02) [20], G (1.33E-03 to 4.37E-02) [11]
hsa-miR-139
G (1.37E-03 to 4.02E-02) [19], E (1.61E-03 to 4.02E-02) [21]
hsa-miR-186
N (9.62E-04 to 3.11E-02) [27], E (2.83E-03 to 3.11E-02) [14], S (9.62E-04 to 3.11E-02) [17], Es (1.82E-02) [8]
hsa-mir-93
N (2.67E-04 to 4.33E-02) [36], I (4.47E-04 to 4.33E-02) [35]
hsa-miR-30c
N (9.85E-05 to 4.21E-02) [40], E (3.31E-04 to 4.21E-02) [25]
hsa-miR-205
N (1.40E-03 to 3.75E-02) [9], S (1.19E-04 to 3.75E-02) [23]
hsa-miR-346
I (8.61E-04 to 3.03E-02) [56]
hsa-miR-519c
G (7.42E-04 to 4.76E-02) [81], N (6.58E-03 to 4.71E-02) [25]
hsa-miR-25
N (1.04E-04 to 3.61E-02) [39], Es (3.95E-02) [8]
hsa-mir-186
N (9.62E-04 to 3.11E-02) [27], E (2.83E-03 to 3.11E-02) [14], S (9.62E-04 to 3.11E-02) [17], Es (1.82E-02) [8]
hsa-miR-23a
N (1.69E-03 to 4.11E-02) [81], S (8.70E-04 to 4.11E-02) [62]
hsa-miR-342
N (6.49E-04 to 4.11E-02) [15], E (2.13E-03 to 4.11E-02) [12], S (6.49E-04 to 4.11E-02) [15]
hsa-miR-23b
N (4.31E-05 to 4.01E-02) [87], S (3.71E-03 to 4.01E-02) [60], E (4.68E-03 to 4.01E-02) [20]
hsa-miR-195
N (4.59E-03 to 4.04E-02) [74], Es (1.12E-02) [10]
hsa-miR-23b
N (4.31E-05 to 4.01E-02) [87], S (3.71E-03 to 4.01E-02) [60], E (4.68E-03 to 4.01E-02) [20]
hsa-miR-451
S (2.99E-04 to 2.43E-02) [29]
hsa-miR-376a
N (1.62E-03 to 3.88E-02) [23], E (1.62E-03 to 3.10E-02) [10], S (1.17E-04 to 4.02E-02) [32], C (4.71E-03) [5]
hsa-miR-191
N (2.53E-04 to 4.62E-02) [34], E (1.87E-03 to 3.93E-02) [12]
hsa-miR-524-3p
N (3.44E-04 to 4.47E-02) [66]
hsa-miR-194
N (8.47E-03 to 3.86E-02) [24]
hsa-miR-29b
S (1.97E-05 to 2.91E-02) [41], C (1.63E-03) [6]
hsa-miR-107
G (4.81E-04 to 4.13E-02) [46], E (1.27E-03 to 4.13E-02), N (1.70E-03 to 4.13E-02) [16]
hsa-miR-103
G (1.31E-03 to 4.27E-02) [49], E (2.01E-04 to 4.27E-02), S (3.03E-03 to 4.27E-02) [23], N (1.82E-03 to 4.27E-2) [35]
hsa-miR-185
N (8.16E-04 to 3.75E-02) [26]
IPA analysis of potential target genes for each of the significantly differentially expressed miRNAs revealed biological functions and pathways associated with the
target genes. P-values calculated from Fisher’s exact test for each function are listed in parenthesis; the number of genes involved in each biological function or
pathway is listed in square brackets. The functions are described as: A, androgen and estrogen metabolism; C, circadian rhythm signaling; E, embryonic development;
Es, estrogen receptor signaling; G, gastrointestinal diseases/digestive system development and functions; I, inflammatory diseases; N, neurological diseases/nervous
system development and functions; S, skeletal and muscular disorders/skeletal and muscular system development and functions.
differentially expressed miRNAs also target genes
involved in co-morbid disorders associated with ASD,
such as muscular and gastrointestinal diseases [50-58].
Target genes of 13 miRNAs (30%) significantly dysregulated in autistic individuals were associated with
skeletal and muscular diseases as well as skeletal and
muscular development or function. Target genes for 12
significantly dysregulated miRNAs (28%) were associated
with gastrointestinal disorders, development, and function, as well as hepatic system disease, hepatic fibrosis,
and hepatic cholestasis (P < 0.05). It is interesting to note
that these disorders are among the most significant
biological functions and pathways enriched within the
dataset of target genes, inasmuch as ASD individuals are
frequently found to have co-morbid diagnoses involving
muscle dysfunction (for example, muscular dystrophy,
muscle weakness, and hypotonia) and digestive disorders
that affect absorption and metabolism.
Another interesting biological function associated with
the miRNA gene targets is steroid hormone metabolism.
More than 11% (5 out of 43) of the differentially expressed
miRNAs showed an association with androgen and
estrogen metabolism, as well as with estrogen receptor
signaling (P < 0.05). Moreover, IPA also showed that
target genes for two of the most up-regulated miRNAs hsa-miR-376a and hsa-miR-29b - were significantly
associated with circadian rhythm signaling (Fisher’s exact
test, P = 4.71E-03 and 1.63E-03, respectively).
Quantitative TaqMan RT-PCR confirmation of selected miRNAs
MicroRNA TaqMan quantitative RT-PCR (qRT-PCR)
analyses were performed to confirm the miRNA expression data of four miRNAs known to be associated with
brain development and function. Hsa-miR-29b and hsamiR-219 are known to be brain-specific, while hsa-miR139-5p is highly enriched in brain [59-61]. Although not
specific to the brain, hsa-miR-103 is highly expressed
during corticogenesis [59,62], suggesting an important
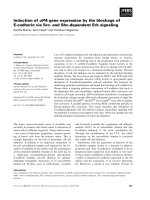
role in brain development and function. Expression levels
of all four brain-associated miRNAs from these analyses
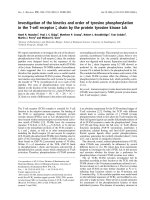
were correlated with miRNA microarray data (Figure 3).
Correspondence between differentially expressed putative
target genes and the differentially regulated miRNAs
To examine the possibility that changes in specific
miRNAs could result in corresponding changes in the
expression levels of the putative target genes, differentially expressed genes from previous cDNA microarray
analyses of the same LCLs used in this study [21,40] were
compared with the potential target genes of the
differentially expressed miRNAs. Of the 3,905 differentially expressed genes between the autistic and control
groups, 1,406 (36%) were found to be putative targets of
the differentially expressed miRNA, with 1,053 (27%) of
Page 8 of 18
log 2 (Autistic/Control)
Sarachana et al. Genome Medicine 2010, 2:23
/>
1.5
1.2
0.9
0.6
0.3
0.0
0.3
0.6
0.9
1.2
1.5
1.8
2.1
2.4
2.7
miR-219-5p miR-139-5p
miR-29b
miR-103
Figure 3. Results of TaqMan miRNA qRT-PCR analyses of four
brain-associated miRNAs (hsa-miR-219-5p, hsa-miR-139-5p,
hsa-miR-29b, and hsa-miR-103) in autistic and control
lymphoblastoid cell lines. Expression levels of selected miRNAs
associated with brain development from TaqMan qRT-PCR analyses
confirm data obtained by miRNA microarrays. Green bars, qRTPCR data; orange bars, DNA microarray data. Error bars represent
standard errors associated with miRNA Taqman qRT-PCR or miRNA
microarray analyses (hsa-miR-219-5p/hsa-miR-29b/hsa-miR-103, n = 5
case-control pairs; hsa-miR-139-5p, n = 4 pairs).
these genes exhibiting changes inversely correlated with
the respective miRNA changes. These percentages of
target genes predicted to be regulated by the miRNA
identified in this study are within the range of the
approximately 10 to 60% of protein-coding genes that are
estimated to be regulated by miRNA [63-65]. Although
translational repression is the main mechanism of
suppression by miRNA in mammalian cells, the suppressed target mRNA often eventually is degraded in
P-bodies [49], thus leading to the expected decreases in
transcript levels observed here. A recent study further
confirms the effect of miRNA on suppressing target
mRNA levels [66].
To increase the stringency of the pathway analyses, an
expression level cutoff of log2(ratio) ≥ ±0.4 was applied to
the differentially expressed genes, which reduced the list
of potential gene targets to 94 genes. IPA analysis of this
set of genes (Table 3) revealed a number of genes significantly involved in neurological disease (P = 1.38E-03 to
1.89E-02). Inflammatory diseases, which have also been
associated with ASD [22], were found to be significantly
associated with the differentially expressed potential
target genes (P = 2.51E-03 to 2.11E-02). It is interesting to
note that lipid metabolism is a cellular function that is a
potential target of miRNA regulation. The top canonical
pathways implicated by the target genes were nitric oxide
signaling (P = 1.07E-02), vascular endothelial growth
factor (VEGF) signaling (P = 1.47E-02), and amyotrophic
lateral sclerosis signaling (P = 1.88E-02).
Sarachana et al. Genome Medicine 2010, 2:23
/>
Page 9 of 18
Table 3. Predicted biological functions from Ingenuity Pathways Analysis
P-value
Number
of genes Genes
Diseases and disorders
Neurological disease
1.38E-03 to 1.89E-02
8
UCHL1, ATF3, NDP, TUBB2C, KIF1B, TUBB2A, MST1, BCL2
Inflammatory disease
2.51E-03 to 2.11E-02
16
IL6ST, ADM, TUBB2C, IL32, PIK3R1, TUBB2A, EIF1, ALOX5AP, MMP10,
DUSP2, BCL2, GNAI2, HSPA8, FUT8, LDLR, AHNAK
Skeletal and muscular disorders
2.71E-03 to 1.89E-02
16
IL6ST, ADM, COL6A2, TUBB2C, IL32, TUBB2A, ALOX5AP, MMP10,
LARGE, DUSP2, BCL2, GNAI2, HSPA8, CEP290, BMI1, AHNAK
Lipid metabolism
1.19E-04 to 2.51E-02
13
ADM, IL6ST, ABCG5, ABHD5, IL32, PIK3R1, ALOX5AP, BCL2, GNAI2,
IFRD1, LDLR, PRKAR2B, PITPNC1
Molecular transport
1.19E-04 to 2.51E-02
12
IL6ST, IFRD1, HSPA8, GNAI2, ABHD5, ABCG5, LDLR, PIK3R1, IL32,
PITPNC1, ALOX5AP, BCL2
Small molecule biochemistry
1.19E-04 to 2.51E-02
17
IL6ST, ADM, AMPD3, ABCG5, ABHD5, PIK3R1, ASS1, IL32, ALOX5AP,
BCL2, IFRD1, GNAI2, BCAT1, LDLR, PITPNC1, GOT1, GLDC
Cellular development
1.32E-04 to 2.42E-02
13
IL6ST, ATF3, PIK3R1, ID3, BCL2, IGLL1, IFRD1, ELF3, BMI1, PRKAR2B,
PLK2, LAMA1, PLAC8
Cell death
2.36E-04 to 1.89E-02
14
IL6ST, ADM, ATF3, DDIT4, PIK3R1, NCK1, PSIP1, SH3BP5, ID3, BCL2,
PRKAR2B, BMI1, PLK2, PLAC8
Nitric oxide signaling
1.07E-02
3/90
CACNA1E, PRKAR2B, PIK3R1
VEGF signaling
1.47E-02
3/92
PIK3R1, EIF1, BCL2
Amyotrophic lateral sclerosis signaling
1.88E-02
3/108
CACNA1E, PIK3R1, BCL2
4.96E-02
1/8
Molecular and cellular functions
Canonical pathways
Toxicity list
Hormone receptor regulated cholesterol metabolism
LDLR
IPA of significant disorders, molecular and cellular functions, canonical pathways, and toxicity genes that are strongly associated with 94 differentially expressed
potential target genes of the miRNAs (log2 ratio ≥ ±0.4). The Fisher’s exact P-values and the number of genes for each top biological function are listed. VEGF, vascular
endothelial growth factor.
Network prediction of the differentially expressed potential
target genes of the differentially expressed miRNAs in ASD
The differentially expressed potential miRNA targets
were analyzed with Pathway Studio 5 to identify the
possible relationships among the target genes and their
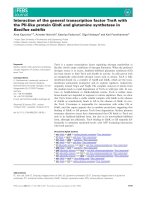
associated functions (Figure 4). Interestingly, the pathway
generated by Pathway Studio revealed relationships
between the potential targets of the miRNAs and autism,
as well as other neurological functions and disorders
previously found to be impacted or associated with ASD,
such as memory, regulation of synapses, synaptic
plasticity, muscle disease, muscular dystrophy, and
muscle strength [50,51,67].
Validation of miRNA targets
Two brain-specific miRNAs (hsa-miR-29b and hsa-miR219-5p), whose differential expression in ASD was
confirmed by TaqMan miRNA qRT-PCR analyses, were
selected for miRNA target validation. Among putative
target genes of these miRNAs are Inhibitor of DNA
binding 3 (ID3), which is a target of miR-29b, and Pololike kinase 2 (PLK2), a target of miR-219-5p. ID3 and
PLK2 have been associated with circadian rhythm
signaling and modulation of synapses, respectively
[68-71], and both biological mechanisms have been
implicated in ASD [12,14-16,72-79]. To examine whether
the overexpression of hsa-miR-29b and the suppression
of hsa-miR-219-5p may be responsible for the respective
decrease in ID3 and increase in PLK2 transcript levels,
LCLs derived from three nonautistic individuals were
transfected with hsa-miR-29b pre-miR precursor and
hsa-miR-219b anti-miR inhibitor, respectively, to increase
hsa-miR-29b and decrease hsa-miR-219-5p activity in the
cells. qRT-PCR analyses of the transfected cells revealed
the down-regulation of the ID3 gene in the LCLs
transfected with hsa-miR-29b pre-miR precursor, and the
up-regulation of the PLK2 gene in the LCLs transfected
with hsa-miR-219b anti-miR inhibitor (Figure 5). These
results suggest that ID3 and PLK2 are targets of hsa-miR29b and hsa-miR-219-5p, respectively. Furthermore,
most of the paired comparisons exhibit opposite changes
in miRNA and mRNA target expression levels, suggesting
that PLK2 and ID3 are in vivo targets of the respective
miRNA (Table 4).
Sarachana et al. Genome Medicine 2010, 2:23
/>
Page 10 of 18
miRNA
Putative target genes
Disrupted biological functions and disorders
Figure 4. Relationships between differentially expressed miRNAs, putative target genes, and functions. Network and pathway analysis
using Pathway Studio 5 shows the relationships among the significantly differentially expressed miRNAs, potential target genes (expression cutoff
log2 ratio ≥ ±0.4), and biological functions and disorders implicated by the differentially expressed target genes. Up-regulated genes and miRNAs
are in red; down-regulated genes and miRNAs are in green.
Discussion
miRNA expression in autism spectrum disorders
In this study, we demonstrate the differential expression
of 43 miRNA species in LCLs from individuals with ASD
relative to controls (Table 1), 16 of which are brainspecific, brain-related, or involved in neural differentiation [59-62]. Although the total number of samples in
this study is modest, the use of discordant monozygotic
twins and sibling case-controls offers the ability to
identify differences in miRNA against the same or closely
related genotype, which is an advantage in investigations
of epigenetic mechanisms contributing to autism. We
have previously used this strategy in first identifying gene
expression differences in these same monozygotic twins
[21] and sibling case-controls [40], and then validated our
initial findings with a larger study involving 116 unrelated
case-controls [77]. Here, we further utilize the original
gene expression data of these same samples to
demonstrate that differentially expressed miRNA can
account for approximately 36% of the differentially
expressed transcripts [21,40], thus implicating miRNA as
a potent regulator of gene expression in ASD. Functional
analyses of the putative gene targets that show inverse
correlation with the expression of miRNA reveal numerous processes relevant to or associated with ASD that are
potentially regulated by the differentially expressed
miRNA (Table 2, Figure 4). These processes include
embryonic development, synaptic development and
function, circadian rhythm signaling, inflammation,
androgen metabolism, and digestive functions, mirroring
the major findings of our gene expression analyses
[21,40,77]. Significantly, we verify inverse changes in the
levels of putative target genes of two of the altered brainspecific miRNAs through the use of anti-miRs (for
knockdown) and pre-miRs (for overexpression)
(Figure 5).
Sarachana et al. Genome Medicine 2010, 2:23
/>
Page 11 of 18
Table 4. Comparison of miRNA and mRNA expression levels for discordant twins and sib pairs for miR-219 and its target,
PLK2, and for miR-29b and its target, ID3
miRNA (target)
A361/C360
A809/C810
A809/C813
A2369/C2368
A2369/C2357
A366/C365
A2769/C2772
Average
miR-219 (PLK2)
-1.447 (0.414)
-1.089 (0.147)
-2.330 (NA)
-2.390 (NA)
-0.175 (NA)
0.398 (0.314)
-1.176 (0.456)
-1.173 (0.333)
miR-29b (ID3)
0.585 (-0.406)
1.720 (-0.187)
1.287 (-0.574)
0.395 (-0.603)
1.315 (0.070)
2.939 (-0.152)
0.061 (-0.233)
1.186 (-0.298)
The first three columns are log2 ratios for discordant monozygotic twins, while the last four columns are ratios for sib-pair comparisons. NA, no expression ratio
obtained for this gene because an intensity value for either the autistic or control sample was missing.
(a)
(b)
*
*
*
*
*
*
Figure 5. Validation of miRNA targets. Three LCLs from non-autistic individuals were transfected with hsa-miR-29b pre-miR precursor,
hsa-miR-219b anti-miR inhibitor, pre-miR negative control, or anti-miR negative control. At 72 hours after transfection, qRT-PCR analyses were
conducted to determine expression of PLK2 and ID3 genes in the pre-miR/anti-miR-transfected LCLs (red), compared to respective pre-miR/antimiR negative controls (navy). (a,b) Expression of PLK2 was significantly increased in the LCLs transfected with anti-miR-219-5p (a), whereas ID3
expression was significantly decreased in pre-miR-29b-transfected LCLs (b). The error bars show the standard error among the technical replicates.
*P < 0.05.
To date, only two other studies have conducted miRNA
expression profiling of autistic individuals. Talebizadeh
and colleagues [38] evaluated the global expression of
470 known human miRNAs using LCLs derived from six
autistic individuals and six sex- and age-matched controls
by miRNA microarray assays. Of these 470 miRNAs, they
found nine that were significantly differentially expressed
in the autistic samples. Three of the nine miRNAs were
replicated in our study, with similar up-regulation of
miR-23a and miR-23b, but down-regulation of miR-132.
Although we have no specific explanation for this
contrasting result for miR-132, differences between our
study and that of Talebizadeh et al. [38] include our use
of related samples (that is, co-twins/siblings) as controls,
a custom-printed rather than commercial platform, and
the restriction of our study to male subjects. Additional
analyses are thus required to further explain the
differences in miRNA expression data between these two
studies on LCLs.
Abu-Elneel et al. [39] investigated the expression of 466
human miRNAs in postmortem cerebellar cortex tissue
of 13 autistic individuals using multiplex quantitative
PCR and found 13 down-regulated and 16 up-regulated
miRNAs. Interestingly, the up-regulation of miR-23a and
down-regulation of miR-106b reported in the autistic
cerebellar cortex were also found in our study using
LCLs. Predicted potential target genes of miR-23a were
found to be associated with neurological diseases and
skeletal and muscular system development and functions,
whereas those of miR-106b were associated with neurological diseases, inflammatory diseases, and gastrointestinal diseases (Table 2). These findings support the
Sarachana et al. Genome Medicine 2010, 2:23
/>
hypothesis that miRNA dysregulation in peripheral blood
cells can reflect at least some miRNA alterations occurring in the brain, thus lending support to the use of LCLs
as a surrogate tissue to study miRNA expression in
individuals with ASD.
Brain-related miRNAs are differentially expressed in LCLs
from ASD patients
Our earlier studies profiling gene expression in LCLs from
monozygotic twins and siblings discordant for diagnosis of
autism and unrelated autistic case-controls reveal the
differential expression of hundreds to thousands of genes
[21,40,77], suggesting that higher level epigenetic gene
regulatory mechanisms are involved in ASD. The present
study provides further insight into the post-transcriptional
gene regulatory network associated with ASD by identifying differential miRNA expression as one mechanism for
the differential gene expression associated with ASD.
Interestingly, at least 16 of these miRNAs have been
previously reported by Sempere and colleagues [59] to be
brain-specific, brain-enriched, or induced by neuronal
differentiation. Krichevsky and colleaques [62] reported
significant changes in the expression of nine miRNAs
during brain development; one of these miRNAs
(miR-103) was also significantly differentially expressed in
our study. Thus, the differential expression of these brainrelated miRNAs in LCLs suggests that gene expression
differences previously observed in LCLs [21,40,77] may
reflect similar changes in the brain, possibly due to global
or system-wide dysregulation of miRNA expression.
Biological functions associated with the confirmed miRNAs
and their target genes
Using miRNA TaqMan qRT-PCR, we confirmed four
differentially expressed miRNAs (hsa-miR-219-5p, hsamiR-139-5p, hsa-miR-29b, and hsa-miR-103) previously
reported to be associated with the brain [59-62]. Of the
confirmed miRNAs, we observed a significant decrease
in brain-specific hsa-miR-219, which is associated with
circadian rhythm and N-methyl-D-aspartate (NMDA)
glutamate receptor signaling, both of which have been
implicated in ASD [72-77,80,81]. In particular, Kocerha
and colleagues [82] found that disruption of NMDA
receptor signaling resulted in decreased levels of miR-219
in mice. Hypofunction of NMDA receptor signaling has
been associated with a number of neurological disorders,
including autism [83-85], attention deficit hyperactivity
disorder [86,87], and schizophrenia [88]. One of the
putative target genes whose expression was confirmed to
be inversely correlated with hsa-miR-219 expression is
PLK2 (Figure 4), a serine/threonine kinase expressed in
the brain [89] that participates in regulation of cell cycle
progression [90] and homeostatic plasticity of hippocampal
neurons [69,70]. A recent study found that PLK2 was
Page 12 of 18
induced during prolonged epileptiform activity, and was
required for the activity-dependent reduction in membrane excitability of pyramidal neurons, suggesting
PLK2’s role in preventing escalating potentiation and in
maintaining synapses in a plastic state [71]. PLK2
induction in hippocampal neurons resulted in weakening
of synapses through phosphorylation and degradation of
post-synaptic spine-associated Rap GTPase-activating
protein (SPAR), a regulator of actin dynamics and dendritic spine morphology [69,71], leading to loss of mature
dendritic spines and synapses [91,92]. Over-expression of
PLK2 in individuals with ASD due to decreased
hsa-miR-219 levels as observed in this study (Figure 5,
Table 4) may thus lead to global reduction in synaptic
strength and neuronal excitability, which could be
partially responsible for the synaptic dysfunction implicated in ASD.
Another confirmed brain-specific miRNA differentially
expressed in individuals with ASD is hsa-miR-29b.
Besides its confirmed target, ID3 (Figure 5), which is
involved in regulating the biological clock (see below),
other target genes that show expression levels inversely
correlated with the over-expression of this miRNA
include COL6A2 (Collagen, type VI, alpha 2), CLIC1
(Chloride intracellular channel 1), ARPC5 (Actin related
protein 2/3 complex, subunit 5, 16kDa), and KIF26b
(Kinesin family member 26B). Interestingly, a number of
mutations in COL6A2 have been observed in muscular
disorders, including Bethlem myopathy [93-95] and
Ullrich congenital muscular dystrophy [94,96-98]. Mutation in the COL6A2 gene results in decreased COL6A2
transcript, leading to disruption of collagen formation
and stability, which results in decreased muscle strength
[93]. A number of motor impairments and muscular disorders, including muscular dystrophy, hypotonia, and
muscle weakness, are observed in individuals with ASD
[50,99,100]. It is therefore interesting to postulate that
suppression of COL6A2 as a result of up-regulated hsamiR-29b may be one of the genetic mechanisms underlying muscular disorders and motor impairments
frequently observed in individuals with ASD.
Among brain-enriched miRNAs [59], hsa-miR-139-5p
was selected for confirmation analysis using miRNA
TaqMan qRT-PCR assay. Although the precise targets in
brain are not known, one of its putative targets (myomegalin or PDE4DIP (Phosphodiesterase 4D interacting
protein)) is a homolog of brain-enriched CDK5RAP2
(CDK5 regulatory subunit associated protein 2), a gene
that regulates brain size [101-104], which has been shown
to be abnormal in ASD [105-119]. Interestingly, this
miRNA has been shown to be involved in prion-induced
neurodegeneration [120].
Two of the most up-regulated miRNAs, miR-103 and
miR-107 (Table 1), have been reported to be paralogous
Sarachana et al. Genome Medicine 2010, 2:23
/>
miRNAs. miR-103 and miR-107 are expressed in many
human organs, with the highest concentrations occurring
in brain tissue [121]. Furthermore, miR-103 was
demonstrated to change during corticogenesis in mice
[62]. Although the specific targets of miR-103/107 in
brain are unknown, these miRNAs are known to be
associated with lipid metabolism [121], and in fact reside
within introns of the pantothenate kinase (PANK) genes,
which catalyze the biosynthesis of Coenzyme A, a critical
component in fatty acid biosynthesis and oxidation. It
should be noted that, while PANK was not found to be
among the significantly differentially expressed genes in
this study, it was found to be increased in ASD and in the
same direction as miR-103/107 in our previous study of a
larger cohort of 31 autistic individuals with severe
language impairment and 29 controls [77]. Aside from
the association of PANK mutations and a neurodegenerative (Hallervorden-Spatz) disease [122,123], alterations in
lipid and fatty acid metabolism are also known to be
associated with ASD. Vancassel and colleagues [124]
examined the levels of phospholipid fatty acids in the
plasma of individuals with ASD compared to controls
with mental retardation and found significant reductions
in docosahexaenoic acid (22:6n-3) levels in autistic
individuals, resulting in significantly lower levels of total
n-3 polyunsaturated fatty acids. The dysregulation of
miR-103/7 may therefore contribute to abnormal lipid
and fatty acid metabolism in ASD.
miRNAs regulating circadian rhythm are significantly
dysregulated in ASD
Recently, dysregulation of circadian rhythm has been
considered as a mechanism for impairments in neurological and other functions (for example, sleep, digestive)
in ASD [72-77]. In particular, the circadian rhythm (or
‘clock’) genes have been posited to underlie social timing
deficits associated with autism [72], as well as lead to the
sleep disorders frequently observed in ASD [125,126].
Bourgeron [75] also proposed an important role for
circadian rhythm with respect to regulation of synaptic
genes (NLGN3 (Neuroligin 3), NLGN4 (Neuroligin 4),
NRXN1 (Neurexin 1), and SHANK3 (SH3 and multiple
ankyrin repeat domains 3)), thus affecting susceptibility
to ASD. Our large-scale genomic study also found strong
support for an association between ASD and circadian
rhythm dysfunction [77]. Interestingly, as many as 15
circadian rhythm genes, including AANAT (Arylalkylamine-N-acetyltransferase), BHLBH2 (Class B basic
helix-loop-helix protein 2), CRY1 (Cryptochrome 1
(photolyase-like)), NPAS2 (Neuronal PAS domain protein
2), PER1 (Period homolog 1), PER3 (Period homolog 3),
and DPYD (Dihydropyrimidine dehydrogenase), were
differentially expressed exclusively in the most severe
phenotype of ASD, which was characterized by severe
Page 13 of 18
language impairment [77,127]. It is interesting to note
that two of the most significantly down-regulated miRNAs
(miR-219 and miR-132) in individuals with ASD have
been reported to be involved in modulating the master
circadian clock located in the suprachiasmatic nucleus
[128-131]. Specifically, brain-specific miR-219 was a
target of the master circadian regulator CLOCK and
BMAL1 (Brain and muscle ARNT-like 1) complex, exhibited robust circadian rhythm expression, and fine-tuned
the length of the circadian period in mice [130,131]. It is
relevant, therefore, that we demonstrate that PLK2,
which is involved in circadian rhythm signaling, is a
target of miR-219 (Figure 5).
Functional analyses of putative target genes using IPA
(Table 2) also showed that other miRNAs (hsa-miR-29b
and hsa-miR-376a) are significantly associated with
circadian rhythm signaling, with hsa-miR-29b targeting
the ID3 gene, which might be important for entrainment
and operation of the mammalian circadian system
through ID3 interaction with CLOCK and BMAL1 [68].
Significantly, we show that hsa-miR-29b pre-miR precursor results in the down-regulation of ID3 transcript.
ID3 is also a neuronal target of MeCP2 (Methyl CpG
binding protein 2), which is the causative gene for Rett
syndrome [132]. Other putative targets of brain-specific
hsa-miR-29b are genes known to interact in the
regulation of the biological clock, including ARNTL (Aryl
hydrocarbon receptor nuclear translocator-like; BMAL1),
ATF2 (Activating transcription factor 2), DUSP2 (Dual
specificity phosphatase 2), PER1, PER3, and VIP (Vasoactive intestinal peptide). Although only DUSP2 was
found to be differentially expressed in the current
analysis, it is interesting to note that our recent largescale gene expression study of LCLs from over 100
unrelated case-controls found significant decreases in
PER1 and PER3 transcript levels in individuals with the
most severe phenotype of ASD [77]. However, further
experimental studies are required to determine whether
or not the over-expression of hsa-miR-29b results in the
suppression of these two PER genes.
Target genes of miRNAs involved in functions and
processes associated with ASD
To obtain more insight into the biological functions
regulated by each of the differentially expressed
miRNAs, the potential target genes of each miRNA
were predicted in silico and uploaded into IPA network
prediction software. For most miRNAs, target genes
were predicted to be involved in neurological disease
and nervous system development and function on the
basis of gene enrichment within the dataset (Table 2).
This finding suggests that the significantly differentially
expressed miRNAs may lead to post-transcriptional
dysregulation of target genes that, in turn, leads to the
Sarachana et al. Genome Medicine 2010, 2:23
/>
disruption in neurological functions contributing to ASD
pathophysiology.
The dysregulation of these specific miRNAs may also
potentially impact other physiological functions. Besides
the neurological functions, almost half of the differentially expressed miRNAs targeted a number of genes
involved in gastrointestinal disorders and hepatic
diseases, which have been found in approximately 50% of
individuals with ASD [133,134]. Our findings thus
provide a plausible explanation for some of the systemic
effects observed in ASD that affect other organs in
addition to the nervous system.
Steroid hormones have been suggested to be involved
in the etiology or susceptibility to ASD [135,136]. In
particular, previous studies have reported elevated
androgen levels in the serum of autistic individuals,
including females [135,136], and we have recently
reported changes in genes in LCLs that correlated with
increases in testosterone [40,77]. Androgens and estrogens are known to participate in synaptic plasticity in the
brain of rats. Whereas estrogens have been found to take
part in synaptic plasticity in the hippocampus of female
rats [137], androgens can modulate that function in both
male and female rats [138]. Within this context, it is noteworthy that four of the differentially expressed miRNAs
(miR-16, miR-186, miR-25, and miR-195) target genes
participating in estrogen receptor signaling. miR-136,
which was one of the most down-regulated miRNAs
found among all five ASD samples, is also associated with
androgen and estrogen metabolism.
miRNAs are known to act through translational
repression [23-27]. However, the repressed transcripts
are often degraded in P-bodies, ultimately leading to
reduced transcript levels for a particular miRNArepressed gene [49]. This inverse correlation between
miRNA and target gene transcript levels is further
suggested by the observed inverse correlation between
miRNA ‘host’ genes and the miRNA target transcripts
using a novel analysis called HOCTAR (for ‘host gene
oppositely correlated targets’) [66]. Thus, an increase in a
particular miRNA is likely to lead to decreased transcript
levels of target genes and vice versa. However, inverse
correlation of miRNA and target mRNA levels is not
necessarily observed. Nevertheless, comparing the
miRNA expression data obtained by the present study
with data obtained by our previous cDNA microarray
analysis of these same samples reveals that the direction
of change for roughly 27% of the differentially expressed
genes was inversely correlated with that of the respective
potentially regulatory miRNAs. Relational gene networks
constructed using computational network prediction
tools show that the inversely correlated target genes of
the significantly differentially expressed miRNAs are
linked to autism as well as to co-morbid disorders
Page 14 of 18
frequently reported in many autistic individuals (Figure 3).
For example, a number of genes in the network are linked
to synaptic function, such as regulation of synapse,
synaptic plasticity, and synaptic transmission. Synaptic
plasticity has been comprehensively described in the
context of fragile X syndrome and linked to autism [139].
FMRP (Fragile X mental retardation protein), the key
protein missing in fragile X syndrome, is an RNA binding
and transport protein that regulates the translation of
many other proteins important for synaptic plasticity,
including neuroligins 3 and 4 and SHANK, all of which
have been previously associated with autism
[12,13,139,140]. Muscular dystrophy and muscle disease
are also known to be among the co-morbid disorders
frequently found in autism [99]. Thus, putative target
genes of the differentially expressed miRNAs identified in
this study can be associated with both neurological as
well as co-morbid features of ASD.
Although the major behavioral symptoms of ASD
appear to be of neurological origin, the prevalence of
gastrointestinal abnormalities, hypotonia, and immune
disorders in individuals with ASD have led some
researchers to view ASD more as a systems disorder that
is a result of gene and environment interactions. Thus,
several recent studies, including three from our laboratory [21,40,77], have used LCLs as a surrogate experimental model to better understand the pathobiology of
ASD as well as to identify peripheral biomarkers of ASD
for diagnostic purposes [21,38,40,77,127,141,142]. In
particular, our previous study of monozygotic twins
discordant for diagnosis or severity of autism revealed
differentially expressed genes with known neurological
functions of potential relevance to autism [21]. Because
identical twins share the same genotype, this study
suggested the involvement of epigenetic factors in the
regulation of gene expression in ASD. Furthermore, the
global scale of the observed changes in gene expression
suggested the operation of ‘master switches’ that can
activate or suppress multiple genes at once. Non-coding
RNAs, including miRNAs, are potential epigenetic
regulators of gene expression and can operate in this
fashion [24,143-146].
Conclusions
Our miRNA expression profiling study of LCLs derived
from individuals with ASD, their discordant monozygotic
co-twins, and/or their unaffected siblings reveals a set of
significantly differentially expressed miRNAs whose
target genes are associated with neurological diseases
and functions. Moreover, by integrating and correlating
both miRNA and gene expression data from the same
samples, we take a systems biology approach to reducing
the total number of relevant targets for further study as
candidate ASD genes. Finally, the significant differential
Sarachana et al. Genome Medicine 2010, 2:23
/>
expression of brain-specific and brain-related miRNAs
detected in LCLs may reflect systemic changes underpinning ASD that give rise to neuropathological
conditions and, moreover, support the use of LCLs as a
surrogate tissue to study miRNA expression in ASD.
Additional files
Additional file 1. Complete list of non-coding RNA probes on
custom microarray printed by NIH Microarray CORE Facility. The
first sheet in the Excel workbook describes all the non-coding RNAs
on the array. The second sheet in the Excel workbook identifies the
human miRNAs that were considered in this study.
Additional file 2. List of 3,905 differentially expressed genes
between discordant twins and between sib pairs after metaanalysis of combined gene expression data. Differential
expression is expressed as log2 ratio of expression between the
autistic individual and his undiagnosed or unaffected twin/sibling.
Additional file 3. Assessment of transfection efficiency of
pre-miRs and anti-miRs. LCLs from non-autistic individuals were
transfected with (a) Cy3-labeled pre-miR negative control and
(b) Cy3-labeled anti-miR negative control. Most of the cells appear
fluorescent, indicating uptake of the pre-miR and anti-miR into the
cells.
Additional file 4. Cytotoxicity assays for transfection of premiRs and anti-miRs. MTS cell proliferation assays (Promega)
were conducted to determine the number of viable cells in three
nonautistic LCLs after transfection with (a) 30 nM pre-miRs, or
(b) 30 nM anti-miRs, for 72 hours. No significant cytotoxicity was
found under any transfection condition.
Abbreviations
AGRE, Autism Genetic Resource Exchange; ASD, autism spectrum disorders;
GEO, Gene Expression Omnibus; IL, interleukin; IPA, Ingenuity Pathway
Analysis; LCL, lymphoblastoid cell line; miRNA, microRNA; NMDA, N-methyl-Daspartic acid; P-org, P-orthologous; qRT-PCR, quantitative reverse-transcription
PCR; TMeV, TIGR Multiexperiment Viewer; UTR, untranslated region.
Competing interests
The authors declare that they have no competing interests.
Authors’ contributions
TS performed all of the experiments and wrote the manuscript for this study.
RZ and GC trained TS in miRNA analysis in the laboratory of HKM who also
provided material support for the miRNA microarray analyses. VWH conceived
of and designed the study, and also participated in the writing of this
manuscript.
Acknowledgements
We thank Ms Ioline Henter (NIMH) for her help in editing this manuscript.
This work was supported by grant #2381 from Autism Speaks (VWH) and
in part by NIMH Grant # R21 MH073393 (VWH). TS is supported by a Higher
Educational Strategic Scholarship for Frontier Research from the Office of the
Commission on Higher Education of the Royal Thai Government, Thailand.
TS is a predoctoral student in the Institute for Biomedical Sciences at The
George Washington University. This work is part of dissertation research
to be presented in partial fulfillment of the requirements for the PhD. We
also gratefully acknowledge the resources provided by the Autism Genetic
Resource Exchange (AGRE) Consortium* and the participating AGRE families.
The Autism Genetic Resource Exchange is a program of Autism Speaks and
is supported, in part, by grant 1U24MH081810 from the National Institute
of Mental Health to Clara M Lajonchere (PI). *The AGRE Consortium: Dan
Page 15 of 18
Geschwind, MD, PhD, UCLA, Los Angeles, CA; Maja Bucan, PhD, University of
Pennsylvania, Philadelphia, PA; W Ted Brown, MD, PhD, FACMG, NYS Institute
for Basic Research in Developmental Disabilities, Long Island, NY; Rita M
Cantor, PhD, UCLA School of Medicine, Los Angeles, CA; John N Constantino,
MD, Washington University School of Medicine, St Louis, MO; T Conrad
Gilliam, PhD, University of Chicago, Chicago, IL; Martha Herbert, MD, PhD,
Harvard Medical School, Boston, MA; Clara Lajonchere, PhD, Cure Autism
Now, Los Angeles, CA; David H Ledbetter, PhD, Emory University, Atlanta,
GA; Christa Lese-Martin, PhD, Emory University, Atlanta, GA; Janet Miller, JD,
PhD, Cure Autism Now, Los Angeles, CA; Stanley F Nelson, MD, UCLA School
of Medicine, Los Angeles, CA; Gerard D Schellenberg, PhD, University of
Washington, Seattle, WA; Carol A Samango-Sprouse, EdD, George Washington
University, Washington, DC; Sarah Spence, MD, PhD, UCLA, Los Angeles, CA;
Matthew State, MD, PhD, Yale University, New Haven, CT; Rudolph E Tanzi, PhD,
Massachusetts General Hospital, Boston, MA.
Author details
1
Department of Biochemistry and Molecular Biology, The George Washington
University Medical Center, 2300 Eye St NW, Washington, DC 20037, USA.
2
Laboratory of Molecular Pathophysiology, National Institute of Mental Health,
National Institutes of Health, 9000 Rockville Pike, Bethesda, MD 20892, USA.
Received: 3 December 2009 Revised: 19 February 2010
Accepted: 7 April 2010 Published: 7 April 2010
References
1. Volkmar F, Chawarska K, Klin A: Autism in infancy and early childhood. Annu
Rev Psychol 2005, 56:315-336.
2. Barton M, Volkmar F: How commonly are known medical conditions
associated with autism? J Autism Dev Disord 1998, 28:273-278.
3. Rutter M, Bailey A, Bolton P, Le Couteur A: Autism and known medical
conditions: myth and substance. J Child Psychol Psychiatry 1994, 35:311-322.
4. Volkmar FR, Lord C, Bailey A, Schultz RT, Klin A: Autism and pervasive
developmental disorders. J Child Psychol Psychiatry 2004, 45:135-170.
5. International Molecular Genetic Study of Autism Consortium (IMGSAC):
A genomewide screen for autism: strong evidence for linkage to
chromosomes 2q, 7q, and 16p. Am J Hum Genet 2001, 69:570-581.
6. Auranen M, Vanhala R, Varilo T, Ayers K, Kempas E, Ylisaukko-Oja T, Sinsheimer
JS, Peltonen L, Jarvela I: A genomewide screen for autism-spectrum
disorders: evidence for a major susceptibility locus on chromosome 3q2527. Am J Hum Genet 2002, 71:777-790.
7. Yonan AL, Alarcon M, Cheng R, Magnusson PK, Spence SJ, Palmer AA, Grunn
A, Juo SH, Terwilliger JD, Liu J, Cantor RM, Geschwind DH, Gilliam TC: A
genomewide screen of 345 families for autism-susceptibility loci. Am J
Hum Genet 2003, 73:886-897.
8. Philippe A, Martinez M, Guilloud-Bataille M, Gillberg C, Rastam M, Sponheim
E, Coleman M, Zappella M, Aschauer H, Van Maldergem L, Penet C, Feingold J,
Brice A, Leboyer M: Genome-wide scan for autism susceptibility genes.
Paris Autism Research International Sibpair Study. Hum Mol Genet 1999,
8:805-812.
9. International Molecular Genetic Study of Autism Consortium (IMGSAC):
Further characterization of the autism susceptibility locus AUTS1 on
chromosome 7q. Hum Mol Genet 2001, 10:973-982.
10. McCauley JL, Li C, Jiang L, Olson LM, Crockett G, Gainer K, Folstein SE, Haines
JL, Sutcliffe JS: Genome-wide and Ordered-Subset linkage analyses
provide support for autism loci on 17q and 19p with evidence of
phenotypic and interlocus genetic correlates. BMC Med Genet 2005, 6:1.
11. Weiss LA, Shen Y, Korn JM, Arking DE, Miller DT, Fossdal R, Saemundsen E,
Stefansson H, Ferreira MA, Green T, Platt OS, Ruderfer DM, Walsh CA, Altshuler
D, Chakravarti A, Tanzi RE, Stefansson K, Santangelo SL, Gusella JF, Sklar P, Wu
BL, Daly MJ, Autism Consortium: Association between microdeletion and
microduplication at 16p11.2 and autism. N Engl J Med 2008, 358:667-675.
12. Lise MF, El-Husseini A: The neuroligin and neurexin families: from structure
to function at the synapse. Cell Mol Life Sci 2006, 63:1833-1849.
13. Jamain S, Quach H, Betancur C, Rastam M, Colineaux C, Gillberg IC,
Soderstrom H, Giros B, Leboyer M, Gillberg C, Bourgeron T, Paris Autism
Research International Sibpair Study: Mutations of the X-linked genes
encoding neuroligins NLGN3 and NLGN4 are associated with autism. Nat
Genet 2003, 34:27-29.
14. Durand CM, Betancur C, Boeckers TM, Bockmann J, Chaste P, Fauchereau F,
Nygren G, Rastam M, Gillberg IC, Anckarsater H, Sponheim E, Goubran-Botros
Sarachana et al. Genome Medicine 2010, 2:23
/>
15.
16.
17.
18.
19.
20.
21.
22.
23.
24.
25.
26.
27.
28.
29.
30.
31.
32.
33.
34.
35.
36.
37.
38.
H, Delorme R, Chabane N, Mouren-Simeoni MC, de Mas P, Bieth E, Roge B,
Heron D, Burglen L, Gillberg C, Leboyer M, Bourgeron T: Mutations in the
gene encoding the synaptic scaffolding protein SHANK3 are associated
with autism spectrum disorders. Nat Genet 2007, 39:25-27.
Kim HG, Kishikawa S, Higgins AW, Seong IS, Donovan DJ, Shen Y, Lally E, Weiss
LA, Najm J, Kutsche K, Descartes M, Holt L, Braddock S, Troxell R, Kaplan L,
Volkmar F, Klin A, Tsatsanis K, Harris DJ, Noens I, Pauls DL, Daly MJ, MacDonald
ME, Morton CC, Quade BJ, Gusella JF: Disruption of neurexin 1 associated
with autism spectrum disorder. Am J Hum Genet 2008, 82:199-207.
Arking DE, Cutler DJ, Brune CW, Teslovich TM, West K, Ikeda M, Rea A, Guy M,
Lin S, Cook EH, Chakravarti A: A common genetic variant in the neurexin
superfamily member CNTNAP2 increases familial risk of autism. Am J Hum
Genet 2008, 82:160-164.
Alarcon M, Abrahams BS, Stone JL, Duvall JA, Perederiy JV, Bomar JM, Sebat J,
Wigler M, Martin CL, Ledbetter DH, Nelson SF, Cantor RM, Geschwind DH:
Linkage, association, and gene-expression analyses identify CNTNAP2 as
an autism-susceptibility gene. Am J Hum Genet 2008, 82:150-159.
Bakkaloglu B, O’Roak BJ, Louvi A, Gupta AR, Abelson JF, Morgan TM,
Chawarska K, Klin A, Ercan-Sencicek AG, Stillman AA, Tanriover G, Abrahams
BS, Duvall JA, Robbins EM, Geschwind DH, Biederer T, Gunel M, Lifton RP,
State MW: Molecular cytogenetic analysis and resequencing of contactin
associated protein-like 2 in autism spectrum disorders. Am J Hum Genet
2008, 82:165-173.
Bourgeron T: A synaptic trek to autism. Curr Opin Neurobiol 2009, 19:231-234.
Geschwind DH: Autism: the ups and downs of neuroligin. Biol Psychiatry
2009, 66:904-905.
Hu VW, Frank BC, Heine S, Lee NH, Quackenbush J: Gene expression profiling
of lymphoblastoid cell lines from monozygotic twins discordant in
severity of autism reveals differential regulation of neurologically relevant
genes. BMC Genomics 2006, 7:118.
Vargas DL, Nascimbene C, Krishnan C, Zimmerman AW, Pardo CA: Neuroglial
activation and neuroinflammation in the brain of patients with autism.
Ann Neurol 2005, 57:67-81.
Ambros V: The functions of animal microRNAs. Nature 2004, 431:350-355.
Bartel DP: MicroRNAs: genomics, biogenesis, mechanism, and function.
Cell 2004, 116:281-297.
Cullen BR: Transcription and processing of human microRNA precursors.
Mol Cell 2004, 16:861-865.
Kim VN: MicroRNA biogenesis: coordinated cropping and dicing. Nat Rev
Mol Cell Biol 2005, 6:376-385.
Zamore PD, Haley B: Ribo-gnome: the big world of small RNAs. Science
2005, 309:1519-1524.
Rogaev EI: Small RNAs in human brain development and disorders.
Biochemistry 2005, 70:1404-1407.
Kim J, Inoue K, Ishii J, Vanti WB, Voronov SV, Murchison E, Hannon G,
Abeliovich A: A microRNA feedback circuit in midbrain dopamine neurons.
Science 2007, 317:1220-1224.
Mehler MF, Mattick JS: Non-coding RNAs in the nervous system. J Physiol
2006, 575:333-341.
Kapsimali M, Kloosterman WP, de Bruijn E, Rosa F, Plasterk RH, Wilson SW:
MicroRNAs show a wide diversity of expression profiles in the developing
and mature central nervous system. Genome Biol 2007, 8:R173.
Caudy AA, Myers M, Hannon GJ, Hammond SM: Fragile X-related protein
and VIG associate with the RNA interference machinery. Genes Dev 2002,
16:2491-2496.
Ishizuka A, Siomi MC, Siomi H: A Drosophila fragile X protein interacts with
components of RNAi and ribosomal proteins. Genes Dev 2002,
16:2497-2508.
Jin P, Alisch RS, Warren ST: RNA and microRNAs in fragile X mental
retardation. Nat Cell Biol 2004, 6:1048-1053.
Li Y, Lin L, Jin P: The microRNA pathway and fragile X mental retardation
protein. Biochim Biophys Acta 2008, 1779:702-705.
Burmistrova OA, Goltsov AY, Abramova LI, Kaleda VG, Orlova VA, Rogaev EI:
MicroRNA in schizophrenia: genetic and expression analysis of miR-130b
(22q11). Biochemistry 2007, 72:578-582.
Mourelatos Z, Dostie J, Paushkin S, Sharma A, Charroux B, Abel L, Rappsilber J,
Mann M, Dreyfuss G: miRNPs: a novel class of ribonucleoproteins
containing numerous microRNAs. Genes Dev 2002, 16:720-728.
Talebizadeh Z, Butler MG, Theodoro MF: Feasibility and relevance of
examining lymphoblastoid cell lines to study role of microRNAs in autism.
Autism Res 2008, 1:240-250.
Page 16 of 18
39. Abu-Elneel K, Liu T, Gazzaniga FS, Nishimura Y, Wall DP, Geschwind DH, Lao K,
Kosik KS: Heterogeneous dysregulation of microRNAs across the autism
spectrum. Neurogenetics 2008, 9:153-161.
40. Hu VW, Nguyen A, Kim KS, Steinberg ME, Sarachana T, Scully MA, Soldin SJ,
Luu T, Lee NH: Gene expression profiling of lymphoblasts from autistic and
nonaffected sib pairs: altered pathways in neuronal development and
steroid biosynthesis. PLoS One 2009, 4:e5775.
41. Chen Y, Kamat V, Dougherty ER, Bittner ML, Meltzer PS, Trent JM: Ratio
statistics of gene expression levels and applications to microarray data
analysis. Bioinformatics 2002, 18:1207-1215.
42. Dudoit S, Gentleman RC, Quackenbush J: Open source software for the
analysis of microarray data. BioTechniques 2003, Suppl:45-51.
43. Saeed AI, Sharov V, White J, Li J, Liang W, Bhagabati N, Braisted J, Klapa M,
Currier T, Thiagarajan M, Sturn A, Snuffin M, Rezantsev A, Popov D, Ryltsov A,
Kostukovich E, Borisovsky I, Liu Z, Vinsavich A, Trush V, Quackenbush J:
TM4: a free, open-source system for microarray data management and
analysis. BioTechniques 2003, 34:374-378.
44. Quackenbush J: Microarray data normalization and transformation.
Nat Genet 2002, 32 Suppl:496-501.
45. Pavlidis P, Noble WS: Analysis of strain and regional variation in gene
expression in mouse brain. Genome Biol 2001, 2:RESEARCH0042.
46. Griffiths-Jones S, Grocock RJ, van Dongen S, Bateman A, Enright AJ: miRBase:
microRNA sequences, targets and gene nomenclature. Nucleic Acids Res
2006, 34:D140-144.
47. Rehmsmeier M, Steffen P, Hochsmann M, Giegerich R: Fast and effective
prediction of microRNA/target duplexes. RNA 2004, 10:1507-1517.
48. R Development Core Team: R: A Language and Environment for Statistical
Computing. Vienna, Austria; 2009.
49. Jakymiw A, Pauley KM, Li S, Ikeda K, Lian S, Eystathioy T, Satoh M, Fritzler MJ,
Chan EK: The role of GW/P-bodies in RNA processing and silencing. J Cell
Sci 2007, 120:1317-1323.
50. Komoto J, Usui S, Otsuki S, Terao A: Infantile autism and Duchenne
muscular dystrophy. J Autism Dev Disord 1984, 14:191-195.
51. Zwaigenbaum L, Bryson S, Rogers T, Roberts W, Brian J, Szatmari P: Behavioral
manifestations of autism in the first year of life. Int J Dev Neurosci 2005,
23:143-152.
52. Horvath K, Papadimitriou JC, Rabsztyn A, Drachenberg C, Tildon JT:
Gastrointestinal abnormalities in children with autistic disorder. J Pediatr
1999, 135:559-563.
53. Horvath K, Perman JA: Autism and gastrointestinal symptoms. Curr
Gastroenterol Rep 2002, 4:251-258.
54. White JF: Intestinal pathophysiology in autism. Exp Biol Med 2003,
228:639-649.
55. Jyonouchi H, Geng L, Ruby A, Reddy C, Zimmerman-Bier B: Evaluation of an
association between gastrointestinal symptoms and cytokine production
against common dietary proteins in children with autism spectrum
disorders. J Pediatr 2005, 146:605-610.
56. Jyonouchi H, Geng L, Ruby A, Zimmerman-Bier B: Dysregulated innate
immune responses in young children with autism spectrum disorders:
their relationship to gastrointestinal symptoms and dietary intervention.
Neuropsychobiology 2005, 51:77-85.
57. Erickson CA, Stigler KA, Corkins MR, Posey DJ, Fitzgerald JF, McDougle CJ:
Gastrointestinal factors in autistic disorder: a critical review. J Autism Dev
Disord 2005, 35:713-727.
58. Valicenti-McDermott M, McVicar K, Rapin I, Wershil BK, Cohen H, Shinnar S:
Frequency of gastrointestinal symptoms in children with autistic
spectrum disorders and association with family history of autoimmune
disease. J Dev Behav Pediatr 2006, 27 Suppl 2:S128-136.
59. Sempere LF, Freemantle S, Pitha-Rowe I, Moss E, Dmitrovsky E, Ambros V:
Expression profiling of mammalian microRNAs uncovers a subset of brainexpressed microRNAs with possible roles in murine and human neuronal
differentiation. Genome Biol 2004, 5:R13.
60. Schaefer A, O’Carroll D, Tan CL, Hillman D, Sugimori M, Llinas R, Greengard P:
Cerebellar neurodegeneration in the absence of microRNAs. J Exp Med
2007, 204:1553-1558.
61. Liang Y, Ridzon D, Wong L, Chen C: Characterization of microRNA
expression profiles in normal human tissues. BMC Genomics 2007, 8:166.
62. Krichevsky AM, King KS, Donahue CP, Khrapko K, Kosik KS: A microRNA array
reveals extensive regulation of microRNAs during brain development. RNA
2003, 9:1274-1281.
63. John B, Enright AJ, Aravin A, Tuschl T, Sander C, Marks DS: Human MicroRNA
Sarachana et al. Genome Medicine 2010, 2:23
/>
targets. PLoS Biol 2004, 2:e363.
64. Friedman RC, Farh KK, Burge CB, Bartel DP: Most mammalian mRNAs are
conserved targets of microRNAs. Genome Res 2009, 19:92-105.
65. Lewis BP, Burge CB, Bartel DP: Conserved seed pairing, often flanked by
adenosines, indicates that thousands of human genes are microRNA
targets. Cell 2005, 120:15-20.
66. Gennarino VA, Sardiello M, Avellino R, Meola N, Maselli V, Anand S, Cutillo L,
Ballabio A, Banfi S: MicroRNA target prediction by expression analysis of
host genes. Genome Res 2009, 19:481-490.
67. Saccomani L, Veneselli E, Di Stefano S, Celle ME, De Negri M: Early autism and
congenital muscular dystrophy: a clinical case. Pediatr Med Chir 1992,
14:231-233.
68. Duffield GE, Watson NP, Mantani A, Peirson SN, Robles-Murguia M, Loros JJ,
Israel MA, Dunlap JC: A role for Id2 in regulating photic entrainment of the
mammalian circadian system. Curr Biol 2009, 19:297-304.
69. Seeburg DP, Pak D, Sheng M: Polo-like kinases in the nervous system.
Oncogene 2005, 24:292-298.
70. Seeburg DP, Feliu-Mojer M, Gaiottino J, Pak DT, Sheng M: Critical role of CDK5
and Polo-like kinase 2 in homeostatic synaptic plasticity during elevated
activity. Neuron 2008, 58:571-583.
71. Seeburg DP, Sheng M: Activity-induced Polo-like kinase 2 is required for
homeostatic plasticity of hippocampal neurons during epileptiform
activity. J Neurosci 2008, 28:6583-6591.
72. Wimpory D, Nicholas B, Nash S: Social timing, clock genes and autism:
a new hypothesis. J Intellect Disabil Res 2002, 46:352-358.
73. Nicholas B, Rudrasingham V, Nash S, Kirov G, Owen MJ, Wimpory DC:
Association of Per1 and Npas2 with autistic disorder: support for the clock
genes/social timing hypothesis. Mol Psychiatry 2007, 12:581-592.
74. Zhang J, Fang Z, Jud C, Vansteensel MJ, Kaasik K, Lee CC, Albrecht U, Tamanini
F, Meijer JH, Oostra BA, Nelson DL: Fragile X-related proteins regulate
mammalian circadian behavioral rhythms. Am J Hum Genet 2008, 83:43-52.
75. Bourgeron T: The possible interplay of synaptic and clock genes in autism
spectrum disorders. Cold Spring Harb Symp Quant Biol 2007, 72:645-654.
76. Melke J, Goubran Botros H, Chaste P, Betancur C, Nygren G, Anckarsater H,
Rastam M, Stahlberg O, Gillberg IC, Delorme R, Chabane N, Mouren-Simeoni
MC, Fauchereau F, Durand CM, Chevalier F, Drouot X, Collet C, Launay JM,
Leboyer M, Gillberg C, Bourgeron T: Abnormal melatonin synthesis in
autism spectrum disorders. Mol Psychiatry 2008, 13:90-98.
77. Hu VW, Sarachana T, Kim KS, Nguyen A, Kulkarni S, Steinberg ME, Luu T, Lai Y,
Lee NH: Gene expression profiling differentiates autism case-controls and
phenotypic variants of autism spectrum disorders: evidence for circadian
rhythm dysfunction in severe autism. Autism Res 2009, 2:78-97.
78. Perry E, Walker M, Grace J, Perry R: Acetylcholine in mind: a neurotransmitter
correlate of consciousness? Trends Neurosci 1999, 22:273-280.
79. Perry EK, Lee ML, Martin-Ruiz CM, Court JA, Volsen SG, Merrit J, Folly E, Iversen
PE, Bauman ML, Perry RH, Wenk GL: Cholinergic activity in autism:
abnormalities in the cerebral cortex and basal forebrain. Am J Psychiatry
2001, 158:1058-1066.
80. Rinaldi T, Kulangara K, Antoniello K, Markram H: Elevated NMDA receptor
levels and enhanced postsynaptic long-term potentiation induced by
prenatal exposure to valproic acid. Proc Natl Acad Sci U S A 2007,
104:13501-13506.
81. Hussman JP: Suppressed GABAergic inhibition as a common factor in
suspected etiologies of autism. J Autism Dev Disord 2001, 31:247-248.
82. Kocerha J, Faghihi MA, Lopez-Toledano MA, Huang J, Ramsey AJ, Caron MG,
Sales N, Willoughby D, Elmen J, Hansen HF, Orum H, Kauppinen S, Kenny PJ,
Wahlestedt C: MicroRNA-219 modulates NMDA receptor-mediated
neurobehavioral dysfunction. Proc Natl Acad Sci U S A 2009, 106:3507-3512.
83. Carlsson ML: Hypothesis: is infantile autism a hypoglutamatergic disorder?
Relevance of glutamate - serotonin interactions for pharmacotherapy.
J Neural Transm 1998, 105:525-535.
84. Moy SS, Nadler JJ: Advances in behavioral genetics: mouse models of
autism. Mol Psychiatry 2008, 13:4-26.
85. Moy SS, Nadler JJ, Poe MD, Nonneman RJ, Young NB, Koller BH, Crawley JN,
Duncan GE, Bodfish JW: Development of a mouse test for repetitive,
restricted behaviors: relevance to autism. Behav Brain Res 2008,
188:178-194.
86. Lehohla M, Kellaway L, Russell VA: NMDA receptor function in the prefrontal
cortex of a rat model for attention-deficit hyperactivity disorder. Metab
Brain Dis 2004, 19:35-42.
87. Adams J, Crosbie J, Wigg K, Ickowicz A, Pathare T, Roberts W, Malone M,
Page 17 of 18
88.
89.
90.
91.
92.
93.
94.
95.
96.
97.
98.
99.
100.
101.
102.
103.
104.
105.
106.
107.
108.
109.
Schachar R, Tannock R, Kennedy JL, Barr CL: Glutamate receptor, ionotropic,
N-methyl D-aspartate 2A (GRIN2A) gene as a positional candidate for
attention-deficit/hyperactivity disorder in the 16p13 region. Mol Psychiatry
2004, 9:494-499.
Beneyto M, Meador-Woodruff JH: Lamina-specific abnormalities of NMDA
receptor-associated postsynaptic protein transcripts in the prefrontal
cortex in schizophrenia and bipolar disorder. Neuropsychopharmacology
2008, 33:2175-2186.
Kauselmann G, Weiler M, Wulff P, Jessberger S, Konietzko U, Scafidi J, Staubli
U, Bereiter-Hahn J, Strebhardt K, Kuhl D: The polo-like protein kinases Fnk
and Snk associate with a Ca(2+)- and integrin-binding protein and are
regulated dynamically with synaptic plasticity. EMBO J 1999, 18:5528-5539.
van de Weerdt BC, Medema RH: Polo-like kinases: a team in control of the
division. Cell Cycle 2006, 5:853-864.
Pak DT, Sheng M: Targeted protein degradation and synapse remodeling
by an inducible protein kinase. Science 2003, 302:1368-1373.
Sheng M, Hoogenraad CC: The postsynaptic architecture of excitatory
synapses: a more quantitative view. Annu Rev Biochem 2007, 76:823-847.
Lampe AK, Bushby KM: Collagen VI related muscle disorders. J Med Genet
2005, 42:673-685.
Lampe AK, Dunn DM, von Niederhausern AC, Hamil C, Aoyagi A, Laval SH,
Marie SK, Chu ML, Swoboda K, Muntoni F, Bonnemann CG, Flanigan KM,
Bushby KM, Weiss RB: Automated genomic sequence analysis of the three
collagen VI genes: applications to Ullrich congenital muscular dystrophy
and Bethlem myopathy. J Med Genet 2005, 42:108-120.
Jobsis GJ, Keizers H, Vreijling JP, de Visser M, Speer MC, Wolterman RA, Baas F,
Bolhuis PA: Type VI collagen mutations in Bethlem myopathy, an
autosomal dominant myopathy with contractures. Nat Genet 1996,
14:113-115.
Martoni E, Urciuolo A, Sabatelli P, Fabris M, Bovolenta M, Neri M, Grumati P,
D’Amico A, Pane M, Mercuri E, Bertini E, Merlini L, Bonaldo P, Ferlini A,
Gualandi F: Identification and characterization of novel collagen VI
non-canonical splicing mutations causing Ullrich congenital muscular
dystrophy. Hum Mutat 2009, 30:E662-672.
Ishikawa H, Sugie K, Murayama K, Awaya A, Suzuki Y, Noguchi S, Hayashi YK,
Nonaka I, Nishino I: Ullrich disease due to deficiency of collagen VI in the
sarcolemma. Neurology 2004, 62:620-623.
Baker NL, Morgelin M, Peat R, Goemans N, North KN, Bateman JF, Lamande
SR: Dominant collagen VI mutations are a common cause of Ullrich
congenital muscular dystrophy. Hum Mol Genet 2005, 14:279-293.
Zwaigenbaum L, Tarnopolsky M: Two children with muscular dystrophies
ascertained due to referral for diagnosis of autism. J Autism Dev Disord
2003, 33:193-199.
Ming X, Brimacombe M, Wagner GC: Prevalence of motor impairment in
autism spectrum disorders. Brain Dev 2007, 29:565-570.
Heuer JG, Li K, Kaufman TC: The Drosophila homeotic target gene
centrosomin (cnn) encodes a novel centrosomal protein with leucine
zippers and maps to a genomic region required for midgut
morphogenesis. Development 1995, 121:3861-3876.
Verde I, Pahlke G, Salanova M, Zhang G, Wang S, Coletti D, Onuffer J, Jin SL,
Conti M: Myomegalin is a novel protein of the golgi/centrosome that
interacts with a cyclic nucleotide phosphodiesterase. J Biol Chem 2001,
276:11189-11198.
Kesavapany S, Li BS, Amin N, Zheng YL, Grant P, Pant HC: Neuronal cyclindependent kinase 5: role in nervous system function and its specific
inhibition by the Cdk5 inhibitory peptide. Biochim Biophys Acta 2004,
1697:143-153.
Mochida GH, Walsh CA: Molecular genetics of human microcephaly. Curr
Opin Neurol 2001, 14:151-156.
Schumann CM, Barnes CC, Lord C, Courchesne E: Amygdala enlargement in
toddlers with autism related to severity of social and communication
impairments. Biol Psychiatry 2009, 66:942-949.
Redcay E, Courchesne E: When is the brain enlarged in autism? A metaanalysis of all brain size reports. Biol Psychiatry 2005, 58:1-9.
Courchesne E, Pierce K: Brain overgrowth in autism during a critical time in
development: implications for frontal pyramidal neuron and interneuron
development and connectivity. Int J Dev Neurosci 2005, 23:153-170.
Carper RA, Courchesne E: Localized enlargement of the frontal cortex in
early autism. Biol Psychiatry 2005, 57:126-133.
Lainhart JE, Piven J, Wzorek M, Landa R, Santangelo SL, Coon H, Folstein SE:
Macrocephaly in children and adults with autism. J Am Acad Child Adolesc
Sarachana et al. Genome Medicine 2010, 2:23
/>
Psychiatry 1997, 36:282-290.
110. Davis LK, Hazlett HC, Librant AL, Nopoulos P, Sheffield VC, Piven J, Wassink TH:
Cortical enlargement in autism is associated with a functional VNTR in the
monoamine oxidase A gene. Am J Med Genet B Neuropsychiatr Genet 2008,
147B:1145-1151.
111. Hazlett HC, Poe M, Gerig G, Smith RG, Provenzale J, Ross A, Gilmore J, Piven J:
Magnetic resonance imaging and head circumference study of brain size
in autism: birth through age 2 years. Arch Gen Psychiatry 2005,
62:1366-1376.
112. Hazlett HC, Poe MD, Gerig G, Smith RG, Piven J: Cortical gray and white brain
tissue volume in adolescents and adults with autism. Biol Psychiatry 2006,
59:1-6.
113. Wassink TH, Hazlett HC, Epping EA, Arndt S, Dager SR, Schellenberg GD,
Dawson G, Piven J: Cerebral cortical gray matter overgrowth and
functional variation of the serotonin transporter gene in autism. Arch Gen
Psychiatry 2007, 64:709-717.
114. Freitag CM, Luders E, Hulst HE, Narr KL, Thompson PM, Toga AW, Krick C,
Konrad C: Total brain volume and corpus callosum size in medicationnaive adolescents and young adults with autism spectrum disorder. Biol
Psychiatry 2009, 66:316-319.
115. Fombonne E, Roge B, Claverie J, Courty S, Fremolle J: Microcephaly and
macrocephaly in autism. J Autism Dev Disord 1999, 29:113-119.
116. Piven J, Arndt S, Bailey J, Havercamp S, Andreasen NC, Palmer P: An MRI
study of brain size in autism. Am J Psychiatry 1995, 152:1145-1149.
117. Piven J, Arndt S, Bailey J, Andreasen N: Regional brain enlargement in
autism: a magnetic resonance imaging study. J Am Acad Child Adolesc
Psychiatry 1996, 35:530-536.
118. Woodhouse W, Bailey A, Rutter M, Bolton P, Baird G, Le Couteur A: Head
circumference in autism and other pervasive developmental disorders.
J Child Psychol Psychiatry 1996, 37:665-671.
119. Kemper TL, Bauman M: Neuropathology of infantile autism. J Neuropathol
Exp Neurol 1998, 57:645-652.
120. Saba R, Goodman CD, Huzarewich RL, Robertson C, Booth SA: A miRNA
signature of prion induced neurodegeneration. PLoS One 2008, 3:e3652.
121. Wilfred BR, Wang WX, Nelson PT: Energizing miRNA research: a review of
the role of miRNAs in lipid metabolism, with a prediction that
miR-103/107 regulates human metabolic pathways. Mol Genet Metab 2007,
91:209-217.
122. Kotzbauer PT, Truax AC, Trojanowski JQ, Lee VM: Altered neuronal
mitochondrial coenzyme A synthesis in neurodegeneration with brain
iron accumulation caused by abnormal processing, stability, and catalytic
activity of mutant pantothenate kinase 2. J Neurosci 2005, 25:689-698.
123. Zhang YM, Rock CO, Jackowski S: Biochemical properties of human
pantothenate kinase 2 isoforms and mutations linked to pantothenate
kinase-associated neurodegeneration. J Biol Chem 2006, 281:107-114.
124. Vancassel S, Durand G, Barthelemy C, Lejeune B, Martineau J, Guilloteau D,
Andres C, Chalon S: Plasma fatty acid levels in autistic children.
Prostaglandins Leukot Essent Fatty Acids 2001, 65:1-7.
125. Johnson KP, Malow BA: Sleep in children with autism spectrum disorders.
Curr Treat Options Neurol 2008, 10:350-359.
126. Malow BA: Sleep disorders, epilepsy, and autism. Ment Retard Dev Disabil Res
Rev 2004, 10:122-125.
127. Hu VW, Steinberg ME: Novel clustering of items from the Autism Diagnostic
Interview-Revised to define phenotypes within autism spectrum
disorders. Autism Res 2009, 2:67-77.
Page 18 of 18
128. Moore RY, Eichler VB: Loss of a circadian adrenal corticosterone rhythm
following suprachiasmatic lesions in the rat. Brain Res 1972, 42:201-206.
129. Ralph MR, Foster RG, Davis FC, Menaker M: Transplanted suprachiasmatic
nucleus determines circadian period. Science 1990, 247:975-978.
130. Cheng HY, Obrietan K: Revealing a role of microRNAs in the regulation of
the biological clock. Cell Cycle 2007, 6:3034-3035.
131. Cheng HY, Papp JW, Varlamova O, Dziema H, Russell B, Curfman JP, Nakazawa
T, Shimizu K, Okamura H, Impey S, Obrietan K: microRNA modulation of
circadian-clock period and entrainment. Neuron 2007, 54:813-829.
132. Peddada S, Yasui DH, LaSalle JM: Inhibitors of differentiation (ID1, ID2, ID3
and ID4) genes are neuronal targets of MeCP2 that are elevated in Rett
syndrome. Hum Mol Genet 2006, 15:2003-2014.
133. Herbert MR, Russo JP, Yang S, Roohi J, Blaxill M, Kahler SG, Cremer L, Hatchwell
E: Autism and environmental genomics. Neurotoxicology 2006, 27:671-684.
134. Levy SE, Souders MC, Ittenbach RF, Giarelli E, Mulberg AE, Pinto-Martin JA:
Relationship of dietary intake to gastrointestinal symptoms in children
with autistic spectrum disorders. Biol Psychiatry 2007, 61:492-497.
135. Ingudomnukul E, Baron-Cohen S, Wheelwright S, Knickmeyer R: Elevated
rates of testosterone-related disorders in women with autism spectrum
conditions. Horm Behav 2007, 51:597-604.
136. Knickmeyer RC, Baron-Cohen S: Fetal testosterone and sex differences in
typical social development and in autism. J Child Neurol 2006, 21:825-845.
137. Zamani MR, Desmond NL, Levy WB: Estradiol modulates long-term synaptic
depression in female rat hippocampus. J Neurophysiol 2000, 84:1800-1808.
138. MacLusky NJ, Hajszan T, Prange-Kiel J, Leranth C: Androgen modulation of
hippocampal synaptic plasticity. Neuroscience 2006, 138:957-965.
139. Harris SW, Hessl D, Goodlin-Jones B, Ferranti J, Bacalman S, Barbato I, Tassone
F, Hagerman PJ, Herman H, Hagerman RJ: Autism profiles of males with
fragile X syndrome. Am J Ment Retard 2008, 113:427-438.
140. Talebizadeh Z, Lam DY, Theodoro MF, Bittel DC, Lushington GH, Butler MG:
Novel splice isoforms for NLGN3 and NLGN4 with possible implications in
autism. J Med Genet 2006, 43:e21.
141. Baron CA, Liu SY, Hicks C, Gregg JP: Utilization of lymphoblastoid cell lines
as a system for the molecular modeling of autism. J Autism Dev Disord 2006,
36:973-982.
142. Schule B, Li HH, Fisch-Kohl C, Purmann C, Francke U: DLX5 and DLX6
expression is biallelic and not modulated by MeCP2 deficiency. Am J Hum
Genet 2007, 81:492-506.
143. Brennecke J, Stark A, Russell RB, Cohen SM: Principles of microRNA-target
recognition. PLoS Biol 2005, 3:e85.
144. Krek A, Grun D, Poy MN, Wolf R, Rosenberg L, Epstein EJ, MacMenamin P, da
Piedade I, Gunsalus KC, Stoffel M, Rajewsky N: Combinatorial microRNA
target predictions. Nat Genet 2005, 37:495-500.
145. Lai EC: Predicting and validating microRNA targets. Genome Biol 2004,
5:115.
146. Lewis BP, Shih IH, Jones-Rhoades MW, Bartel DP, Burge CB: Prediction of
mammalian microRNA targets. Cell 2003, 115:787-798.
doi:10.1186/gm144
Cite this article as: Sarachana T, et al.: Investigation of post-transcriptional
gene regulatory networks associated with autism spectrum disorders
by microRNA expression profiling of lymphoblastoid cell lines. Genome
Medicine 2010, 2:23.