báo cáo khoa học: "Modeling the cumulative genetic risk for multiple sclerosis from genome-wide association data" ppt
Bạn đang xem bản rút gọn của tài liệu. Xem và tải ngay bản đầy đủ của tài liệu tại đây (708.96 KB, 11 trang )
RESEARCH Open Access
Modeling the cumulative genetic risk for multiple
sclerosis from genome-wide association data
Joanne H Wang
1
, Derek Pappas
1
, Philip L De Jager
2,3
, Daniel Pelletier
1
, Paul IW de Bakker
3,4
, Ludwig Kappos
5
,
Chris H Polman
6
, Australian and New Zealand Multiple Sclerosis Genetics Consortium (ANZgene)
7
, Lori B Chibnik
2
,
David A Hafler
8
, Paul M Matthews
9
, Stephen L Hauser
1,10
, Sergio E Baranzini
1
, Jorge R Oksenberg
1,10*
Abstract
Background: Multiple sclerosis (MS) is the most common cause of chronic neurologic disability beginning in early to
middle adult life. Results from recent genome-wide association studies (GWAS) have substantially lengthened the list of
disease loci and provide convincing evidence supporting a multifactorial and polygenic model of inheritance.
Nevertheless, the knowledge of MS genetics remains incomplete, with many risk alleles still to be revealed.
Methods: We used a discovery GWAS dataset (8,844 samples, 2,124 cases and 6,720 controls) and a multi-step logistic
regression protocol to identify novel genetic associations. The emerging genetic profile included 350 independent
markers and was used to calculate and estimate the cumulative genetic risk in an independent validation dataset (3,606
samples). Analysis of covariance (ANCOVA) was implemented to compare clinical characteristics of individuals with
various degrees of genetic risk. Gene ontology and pathway enrichment analysis was done using the DAVID functional
annotation tool, the GO Tree Machine, and the Pathway-Express profiling tool.
Results: In the discovery dataset, the median cumulative genetic risk (P-Hat) was 0.903 and 0.007 in the case and
control groups, respectively, together with 79.9% classification sensitivity and 95.8% specificity. The identified profile
shows a significant enrichment of genes involved in the immune response, cell adhesion, cell communication/
signaling, nervous system development, and neuronal signaling, including ionotropic glutamate receptors, which
have been implicated in the pathological mechanism driving neurodegeneration. In the validation dataset, the
median cumulative genetic risk was 0.59 and 0.32 in the case and control groups, respectively, with classification
sensitivity 62.3% and specificity 75.9%. No differences in disease progression or T2-lesion volumes were observed
among four levels of predicted genetic risk groups (high, medium, low, misclassified). On the other hand, a
significant difference (F = 2.75, P = 0.04) was detected for age of disease onset between the affected misclassified
as controls (mean = 36 years) and the other three groups (high, 33.5 years; medium, 33.4 years; low, 33.1 years).
Conclusions: The results are consistent with the polygenic model of inheritance. The cumulative genetic risk
established using currently available genome-wide association data provides important insights into disease
heterogeneity and completeness of current knowledge in MS genetics.
Background
Multiple sclerosis (MS) is a common cause of non- trau-
matic neurological disability in young adults. Extensive
epidemiological and laboratory data indicate that genetic
susceptibility is an important determinant of MS risk
[1,2]; this risk is modulated by family history, ancestry,
gender, age, and geography [3]. The extent of familial
clustering is often expressed in terms of the l
s
para-
meter derived from the ratio between the risk seen in
the siblings of an affected individual and the risk seen in
the population [4]. In northern Europeans, the preva-
lenceis1per1,000inthepopulationandtherecur-
rence risk in a sibling is 2 to 3%; hence, after corre cting
for age, the l
s
for MS is approximately 15 to 20. On the
other hand, some authors suggest that both of these
risks are difficult to assess and the denominator is
* Correspondence:
1
Department of Neurology, University of California San Francisco, San
Francisco, CA 94143-0435, USA
Full list of author information is available at the end of the article
Wang et al. Genome Medicine 2011, 3:3
/>© 2011 Wang et al.; l icensee BioMed Central Ltd. This is an open access article distributed under the terms of the Creat ive Commons
Attribution License (http://creativecommons.o rg/licenses/by/2.0), which permits unrestricted use, distribution, and reproduction in
any medium, provided the original work is properly cited.
generally underestimated while the numerator is overes-
timated [5,6]; a more accurate value for l
s
maybeless
than 10 [7]. In addition, twin studies from several popu-
lations consistently show that a monozygot ic twin of an
MS patient is at higher risk for MS than is a dizygotic
twin [8,9]; however, they vary in their estimation of
indices of heritability from 0.25 to 0.76 [10].
MS behaves as a prototypic complex genetic disorder,
and although a single-gene etiology cannot be ruled out
for a subset of pedigrees, data from recent genome-wide
association studies (GWAS) provide convincing evidence
that support a multifactorial and polygenic model of
inheritance [11-14]. It is also likely that epistatic and
epigenetic events modulate heritability [15-18]. The
human leukocyte antigen (HLA) gene cluster in chromo-
some 6p21.3 represents by far the strongest MS suscept-
ibility locus genome-wide. The primary signal maps to
the HLA-DRB1 gene in the class II segment of the
locu s, but complex hierarchical allelic and/or haplotypi c
effects and protective signals in the class I region
between HLA-A and HLA-C have b een reported as well
[2,19-21]. Other susceptibility genes discovered primarily
through GWAS i nclude IL2RA, IL7R, EVI5, CD58,
CLEC16A, CD226, GPC5,andTYK2 [11,12,14,22-25]. A
recent meta-analysis of data from three different GWAS
totaling 2,624 MS patients and 7,220 controls identified
additional susceptibility SNPs within or next to
TNFRSF1A, ICSBP1/IRF8 and CD6 [24].Inadditionto
gene discovery, these studies are powering a profound
paradigmshiftinthestudyofMSbyallowingamore
accurate description of the genetic contributions to dis-
ease susceptibility [26]. Even though the full roster of
MS genes remains unknown at this time, we build on
the meta-analysis dataset and use logistic regression
methodology to estimate the collective genetic risk
behind MS susceptibility. In line with other complex
diseases [27], the results remain consist ent with the
polygenic paradigm and suggest that while much of the
genetics of MS remains to be characterized, up to 350
independent variants account for a significant fraction
of the genetic component of MS.
Materials and methods
Data
A genome-wide meta-analysis of MS was recently com-
pleted and reported [24]. Since each of the three pooled
studies used a different genotyping platform, we use
data from the phased chromosomes of HapMap samples
of European ancestry [28] and the MACH algorithm
[29] to impute missing autosomal SNPs with a minor
allele frequency >0.01 in each of the datas ets. Fractional
genotypic scores are generated as the outcome of
MACH imputation algorithm, and are analyzed without
converting them into categorical genotypes to minimize
variance inflation. The distribution of fractional geno-
type scores are tri-modal with the peaks at 0, 1 and 2,
but there are data points that fall in between peaks due
to uncertainty encountered during the imputation pro-
cess. The estimated variance inflation factor was l =
1.077. The final discovery dataset included 8,844 sam-
ples (2,124 cases and 6,720 controls) and a common
panel of 2.56 millio n SNPs (Table 1). The independent
validation dataset is composed of 1,618 ANZgene cases
and 1,988 controls [12]. We used MACH to impute the
ANZgene dataset as described for the discovery dataset.
Statistical analysis
All statistical analyses were performed using SAS v.9.1.3
and JMP Genomics v. 4.0 (SAS Institute, Cary, NC 27513,
USA). Principle component analysis was implemented
prior to data analysis to assess population substructure.
Although no significant population substructure was
Table 1 Demographic statistics of study participants
Discovery dataset (N = 8,844) Validation dataset
b
(N = 3,606)
Case Control Case Control
Stratum
a
(N = 2,124) (N = 6,720) (N = 1,618) (N = 1,988)
IMSGC UK, Affy 500K 17.5% 40.9% - -
IMSGC US, Affy 500K 13.2% 23.3% - -
BWH, Affy 6.0 32.2% 23.9% - -
Gene MSA CH, Illumina 550K 9.6% 2.9% - -
Gene MSA NL, Illumina 550K 8.9% 3.1% - -
Gene MSA US, Illumina 550K 18.6% 5.9% - -
Male 27.9% 50.3% 27.5% 38.1%
Female 72.1% 49.7% 72.5% 61.9%
DRB1*15:01 + 52.7% 25.1% 56.9% 29.8%
DRB1*15:01 - 47.3% 74.9% 43.1% 70.2%
a
Datasets described in [24]. In each pair of matched cases and controls, all subjects are genotyped using the same genome-wide platform.
b
Datasets described in
[12], with 1,618 Australian and New Zealand cases (Illumina Hap370CNV) matched with 1,988 US controls (Illumina Infinium).
Wang et al. Genome Medicine 2011, 3:3
/>Page 2 of 11
observed when compared to the HapMap CEU data, a few
outliers were removed. We organize the top association
analysis results (P < 0.001) of the meta-analysis in the dis-
covery dataset by individual chromosomes and implement
a logistic regression analysis using alternation between the
type I and type III sums of squares tests to remove mar-
kers that are in linkage disequilibrium (LD). The top
ranked SNPs (that is, the SNP wit h the most extreme P-
value) are forced into the model first. We then calculate
the residual effect of each of the other SNPs after account-
ing for the effect of the top ranked SNPs. We used gender
and sample country of origi n (US versus EU, total 6 stra-
tum) as covariates in the model to accoun t for possible
population heterogeneity. Furthermore, conditional logis-
tic regression was implemented conditioning on
DRB1*15:01 status (Yes versus No) in order to control the
effect of genetic heterogeneity. This method is preferred to
the conventional logistic regression model in estimating
the gene risk effect after ‘ conditioning out’ the baseline
risk in DRB1*15:01 carriers and non-carriers, and it is thus
efficient in eliminating the redundancy of markers that are
in LD with DRB1*15:01. HLA-DR B1*15:01 status was
determined using a tagging marker (rs3135388).
Logistic regression stepwise selection was applied to
select a set of genes from the identified independent mar-
kers a nd establish a g enetic profile to assess the cumu la-
tive genetic risk of individuals (P-Hat). Logistic regression
is used for prediction of th e probability of occurrence of
an event by fitting data to a logit function. It is a general-
ized linear model used for binomial regression. The logit
of the unknown binomial probabilities (P-Hat) is modeled
as a linear function of the Xi,withasetofexplanatory
variables, where logit (P-H at) = ln(P-Hat/1 - P-Hat) = b
0
+b
1
X
1
+b
2
X
2
+···+BiXi;andthus,P-Hat=1/1+exp
-(b0+
b1X1 + b2X2 + ···+BiXi)
. The algorithm for calculating the pre-
dicted probab ility i s model ed aft er an even t being a MS
case, P-Hat = 1/(1+ exp(-Ŷi)), where Ŷi = intercept + bcen-
ter × Xcenter + bgender × Xgender + ∑bj×Xij; bj is the esti-
mated regression coefficient of genetic marker j, and j =1
to 350; Xij is the fractional genotype of marker j of indivi-
dual i. The values of intercept, bcenter, bgender,andbj are
the maximum likelihood estimates obtained from the
logistic regression model. The regression coefficient
reflects the differential contribution of each SNP, and the
odds ratio is estimated by exponentiating the correspond-
ing regression coefficient. In order to assess how well the
genetic profile can differentiate MS cases from the con-
trols, the cumulative genetic risk classification is per-
formed. If Ŷi of an individual is >0, then the indi vidual is
classified as a MS case, and if Ŷi is <0, then they are classi-
fied as a control. When Ŷi = 0, the estimated probability
of being an MS patient is 0.5.
Classification sensitivity and specificity are assessed.
Classification sensitivity is defined a s the perc entage of
affected individuals that are classified as an MS case,
and specificity as the percentage of controls that are
classified as a control. Analysis of covariance
(ANCOVA) was implemented to compare clinical char-
acteristics of individuals with various degrees of genetic
risk (high, medium, low and misclassified group), with
gender as covariate in the model. The Hosmer-Leme-
show goodness-of-fit test was implemented to test if the
observed probability is equal to the expected probability
basedonthefittedmodel;aP-value <0.05 indicates a
lack of fit of the fitted logistic regression model [30].
Functional gene ontology and annotation
Gene ontology enrichment analysis was done usin g the
DAVID functional annotation tool [31] and GO Tree
Machine, and pathway enrichment was done with the Path-
way-Express profiling tool [32], usi ng default parameters
and correcting for multiple comparison by the Benjamini
method and the false discovery rate (FDR), respectively.
Results
The characteristics of the discovery (8,844 samples) and
validation datasets (3,606 samples) are shown in Table
1. The frequency of HLA-DRB1*15:01 was similar across
the disease groups. As expected, gender ratios were dif-
ferent between cases and controls in all datasets. Gender
was fit into the model for all subsequent analyses to
minimize the effect of this difference. Using the top 12
validated disease variants for MS including HLA-DRB1
(Additional file 1), we estimated the collective genetic
risk in the discovery datase t, yielding a classification
sensitivity of 35.1% and a specificity of 93.5% (Table 2),
suggesting the presence of many additional susceptibility
alleles in the strata of data that failed to achieve gen-
ome-wide significance. We then tested whether a signifi-
cant fraction of the variance was related to contributions
from additional common alleles with lower association
effects. The analysis was conducted in four major stages:
stage I, genome-wide association analysis; stage II, LD
filtering; stage III, statistical model fitting using the
independent markers identified in stage II; and stage IV,
validation in an independent replication dataset.
Table 2 Estimated cumulative genetic risk using 12
validated multiple sclerosis genes
a
Probability of being a MS case
25% quartile Median 75% quartile
Case (N = 2,062) 0.228 0.379 0.589
Control (N = 6,360) 0.072 0.134 0.268
Classification results in the discovery dataset were: classification sensitivity,
35.1%; classification specificity, 93.5%; classification accuracy rate, 63.8%;
model fit analysis, P = 0.007 (Hosmer-Lemeshow goodness-of-fit test [30] was
implemented to assess ‘lack of fit’ of the selected model; P > 0.05 indicates
that there is no evidence of a lack of fit of the selected model).
a
HLA-DRB1,
CD58, CLEC16a, EVI5, IL2Ra, IRF8, RGS1, CD226, TNFRSF1a, CD6, GPC5 and IL7R.
Wang et al. Genome Medicine 2011, 3:3
/>Page 3 of 11
Stage I analysis
Case- control logistic regression analysis was implemen-
ted on the discovery dataset with 8,844 samples ( 2,124
cases versus 6,720 controls). Two regression models
were applied. The first model included center and gen-
der as covariates, whereas the second model included
center, gender and DRB1*15:01 status as covariates. A
relatively lax threshold of significance was chosen to
compensate for the lack of statistical power to detect
minor effects. Markers with P-value <0.001 (equivalent
to controlling FDR at 25%) from both analyses were
selected for further study. Altogether, 11,334 markers
(0.44% of the 2.56 million markers) wer e included in the
stage II analysis.
Stage II analysis
The main objective of the stage I I analysis was to trim
redundancy among the 11,334 markers identified in the
stage I analysis. Conditional logistic regression was used
to remove markers in LD with DRB1*15:01 [33]. Covari-
ates such as center and gender were placed in the
model throughout the analysis. Two procedures were
implemented; the first examined residual effects after
preceding markers were placed in the model (type I
sums of squares test, also known as sequential sums of
squares test). The significant P-valuefromthetypeI
test indicated that the marker showed an independent
effect in addition to the preceding markers that were
alreadyplacedinthemodel.Thesecondtestsoughtto
examine multicollinearity in between markers due to LD
(type III sums of squares test). The P-value from the
type III test indicated if the marker of interest remained
significant after all other markers were placed in the
model. Thus, if any t wo markers in the model were in
LD, one or both of the marker’ s P-value would not be
significant. Markers that did not reach P <0.01from
both type I and type III tests were removed. The flow
chart of analysis procedures is show n in Additional file
2. We first selected the top significant markers at P <
10
-5
(the most significant markers per gene), then placed
this set of markers into a logistic regression analysis in
the sequence of significance to examine independence
of markers (type I test). This first set of independent
markers was then placed in a logistic regression model
(type III test) to search for markers with remaining
effect at P < 0.001. The second set of markers was then
selected and combined with the first set of markers, and
was examined using both type I and type III anal yses in
a logistic regression model again to examine indepen-
dent effect and multicollinearity. Markers that did not
show additional independent effects were removed. This
expanded set of independent markers was then placed
into a regression model (type III test) to search for addi-
tional independent markers. These steps were repeated
until all markers with an independent effect at P < 0.001
were identified. The analysis identified 713 independent
markers across all autosomal chromosomes, and
included the original GWAS and meta-analysis asso-
ciated markers (CD58, CLEC16a, EVI5, IL2Ra, IRF8,
RGS1, CD226, TNFRSF1a, CD6 and IL7R). Markers with
significance at -Log10 (p) > 6.0 are shown in Table 3.
Markers exceeding significance at FDR = 0.05 are
shown in Additional file 3.
Stage III analysis
Using the identified 713 independent markers, we per-
formed a mode l fitting analysis to select the optimal set
of variants that gave the best estimation of the cumula-
tive genetic risk mediated by common alleles for an
individual and that differentiated MS cases from con-
trols. Logistic regression analysis using stepwise-selec-
tion with different selection entrance and remaining
cutoff values (P = 0.01, P =0.05,P =0.1)wasimple-
mented. The stepwise-selection process included an
alternation between forward selection of a set of signifi-
cant markers and backward elimination of markers that
did not retain significance at the selected threshold after
additional markers were placed in the model. The step-
wise selection process terminated when additional sig-
nificant markers could not be fitted into the model. The
covariates included in the logistic regression analysis
were center and gender. This analysis identified 350
genes using P = 0.05 as the cutoff selecting criteria,
including CD58, EVI5, IRF8, RGS1, CD226, TNFRSF1a,
CD6,andIL7R.However,IL2Ra, CLEC16a, IRF8,and
HLA-C did not survive the stepwise regression analysis.
The cumulative genetic risk for each individual was
calculated using the estimated regression coefficients of
the 350 markers included in the model, providing a
measure of the extent to which common allelic variation
(and the variables in the model) explained disease status
in this dataset. The explanatory potential of these vari-
ables can be expressed a s a summary estimate of the
predicted probability of an individual being a MS case
(P-Hat). The median of the cumulative genetic risk in
the case group is 0.90, and in the control group 0.01.
Quantiles of the estimated cumulative genetic risk (P-
Hat) using different genetic models is summarized in
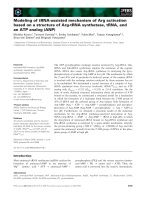
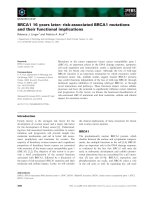
Table 4. Next, classification sensitivity and specificity
were assessed. In addition, rece iver operating character-
istic (ROC) analysis comparing classification results
using different genetic models is shown in Figure 1. The
classification result s did not improve substantially when
more markers were included using less stringent selec-
tion criteria (P = 0.10, 391 markers). Classification sensi-
tivity only increased from 79.9% to 80.3%, and the
adjusted R
2
only improved from 0.75 (P =0.05,350
markers) to 0.76 (391 markers). Therefore, we tested the
Wang et al. Genome Medicine 2011, 3:3
/>Page 4 of 11
predictive power of the selected 350 variants (Additional
file 4). The Hosmer-Lemeshow goodness-of-fit test
resulted in a P-value of 0.092, indicating that there is no
evidence of a la ck of fit or over-fitting in the s elected
model. As expected, this model has much better discri-
minating power than the 12-gene-set model (Table 4).
Stage IV analysis
The genetic profile established in the stage III analysis
was tested on an independent dataset including 1,618
MS cases and 1,988 controls [12]. We used the same
350 genetic markers as predictors in a logistic regression
model to calculate the predicted probability of being an
MS patient, the median of the cumulative predicted
genetic risk (P- Hat) in the case group is 0.59 and 0.32
in the control group. Quantiles of the estimated
cumulative genetic risk (P-Hat) are given in Table 4.
We then used the probability to classify individuals into
cases or controls (if P-Hat of an individual is >0.5, then
the individual is classified as a MS case, otherwise, a
control). The classification results were used to assess
sensitivity and specificity for the 3,606 independent sam-
ples; the statistics are shown in Table 4. The classifica-
tion sensitivity is approximately 62.3%, which shows a
moderate improvement c ompared to u sing the 12 vali-
dated genes (54.3%). The classification sensitivity is
modest, reflecting the limited power of the study, ran-
domness, heterogeneity, possible epistasis, and lack of
fitting environmental and epigenetic factors into the
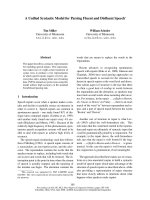
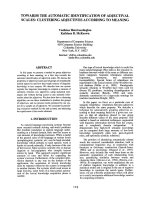
model. We also performed a ROC analysis (ROC curve)
in the validation dataset to compare the area under
curves (AUCs) of various genetic models (Figure 2).
Table 4 Classification results using different genetic models
Classification Classification P-Hat (quantiles, case versus control)
Genetic model sensitivity specificity 25% 50% 75%
Discovery dataset (N = 8,844)
12 Genes
a
35.1% 93.5% 0.23 0.07 0.38 0.13 0.59 0.27
350 Genes
b
79.9% 95.8% 0.65 0.00 0.90 0.01 0.99 0.06
Validation dataset (N = 3,606)
12 Genes
a
54.3% 74.0% 0.36 0.30 0.53 0.36 0.63 0.51
350 Genes
b
62.3% 75.9% 0.41 0.19 0.59 0.32 0.74 0.49
a
The 12-gene set includes HLA -DRB1 and 11 additional validated susceptibility genes.
b
The 350-gene set includes HLA-DRB1 and 349 additional genes identified
in the genetic profile.
Table 3 Top significant markers (-Log 10(p) > 6)) after adjusting for DRB1*15:0 1 among the 700-independent-gene set
rs ID Position Chrom. Gene name Allele 1 Allele 2 -Log10 p OR Lower CL Upper CL
rs9268148 32367505 6 C6orf10 A G 13.13 0.58 0.50 0.67
rs1611715 29937461 6 HLA-G C A 11.49 0.74 0.68 0.81
rs7772297 31436805 6 HLA-B C G 9.14 1.40 1.26 1.56
rs4939490 60550227 11 CD6 G C 9.00 1.30 1.19 1.42
rs9275596 32789609 6 HLA-DQA2 T C 7.85 0.76 0.69 0.84
rs10244467 22584456 7 IL6 T C 7.23 0.57 0.47 0.70
rs9596270 49740441 13 DLEU1 T C 7.08 1.56 1.31 1.85
rs12025416 116750329 1 CD58 C T 6.83 0.69 0.59 0.80
rs6836440 100405684 4 ADH4 A G 6.74 0.68 0.58 0.79
rs7137953 119357405 12 GATC C T 6.47 0.77 0.70 0.85
rs10846336 16413619 12 MGST1 T C 6.43 0.42 0.30 0.59
rs931555 35839334 5 IL7R C T 6.41 1.25 1.15 1.36
rs10203141 179015804 2 OSBPL6 C G 6.40 0.81 0.75 0.88
rs2328523 20575342 6 E2F3 G A 6.28 0.79 0.72 0.87
rs4368946 98497864 8 TSPYL5 T C 6.25 0.70 0.61 0.80
rs3934035 281714 3 CHL1 C T 6.23 0.46 0.34 0.62
rs17062281 73654880 13 KLF12 C G 6.13 0.44 0.31 0.61
rs1356122 155666264 3 GPR149 G C 6.13 1.26 1.14 1.40
rs4447 31599694 22 SYN3 T C 6.10 0.74 0.66 0.83
rs655763 108682027 11 C11orf87 C T 6.03 1.59 1.32 1.92
rs12419184 125561518 11 RPUSD4 C T 6.03 0.72 0.63 0.82
Chrom., chromosome; lower CL, lower bound of the confidence interval; OR, odds ratio; upper CL, upper bound of the confidence interval.
Wang et al. Genome Medicine 2011, 3:3
/>Page 5 of 11
Clinical characteristics of individuals with various degrees
of genetic load
In order to further understand the significance of the
affected individuals’ cumulative genetic risk, patients
with available clinical data in the screening dataset (N =
968) were grouped into four clusters using their
predicted probability of being a MS patient (P-Hat):
high (P-Hat ≥0.95, N = 383); medium (P-Hat <0.9 5 and
≥0.75, N = 313); low (P-Hat <0.75 and ≥0.5, N = 142);
misclassified (P-Hat <0.5, N = 130). Not surprisingly,
Chi-square testing for the association of genetic load
with DRB1*15:01 status showed the strong effect of the
allele or haplotype (high P-Hat: 63.2% in DRB1*15:01+
versus 36.8% in DRB1*15:01-), along with the decrease
in the proportion of DRB1 *15:01 carriers from the high-
est P-Hat group to the lowest P-Hat group: (high,
63.2%; medium, 46.6%; low, 35.9%; misclassified, 23.9%;
P < 0.0001). Simil ar association was observed with gen-
der (female) (high, 74.4%; medium, 6 5.8%; low, 59.9%;
misclassified, 52.3%; P < 0.0001) (Table 5).
Multiple Sclerosis Severity S core (MSSS), T2-lesion
volumes (mm
3
), and age of disease onset (years) were ana-
lyzed using ANCOVA tests, with gender as covariate in the
model. MSSS was transformed using square-root transfor-
mation for normality assumption. T2-lesion volumes
(mm
3
) were tra nsformed using cube-root transformation
for normalit y assumption. The glob al test results did not
show statistically significant difference between the four
groups on MSSS (F = 0.41, P = 0.75) and T2-lesion
volumes (F = 0.98, P = 0.40), whether age of disease onset
was placed in the model as a covariate or not (MSSS, F =
0.41, P = 0.74; T2-lesion volumes, F = 0.69, P =0.56).How-
ever, there was a significant difference in age of disease
onset between the MS affected misclassified as controls
(mean = 36 years) and the other three groups (high group,
mean = 33.77 years; medium group, mean = 33.57 years;
low group, mean = 33.23 years) (Table 5). Sib concordance
in multi-case family studies show that age of onset is the
strongest genotype-phenotype association described so far
for MS [34]. Therefore, the differences in genetic load dri-
ven by the age of onset quantitative trait loci suggest that
the two groups (high P-Hat and misclassified) are charac-
terized by overlapping but distinct genetic profiles.
Functional annotation enrichment
To gain insights into the biological significance of the
350 variants identified in our analysis and assess how
these may relate to the etiology of MS, we interrogated
the gene list for enrichment of known biological labels
such as gene ontologies and protein pathways. DAVID
[31] identified significant enrichment for ontological
categories relating to cell adhesion, cell communication/
signaling, and development (Table 6). Pathway Express
identified significant enrichment of the KEGG (Kyoto
Encyclopedia of Genes and Genomes) pathways for cell
adhesion molecules, neuroactive ligand-receptor interac-
tions, allograft rejection, and type I diabetes mellitus,
including well-defi ned immunological genes coding for
adhesive molecules (CD58, CD226, SELPLG,and
VCAM1) and MHC class I and class II genes.
Figure 1 ROC curves of different genetic models using the
discovery dataset (N = 8,844). Stepwise selection from the 700-
gene list yielded gene sets with different numbers of genes used in
the predictive model: 255 genes (P = 0.01), 350 genes (P = 0.05),
and 391 genes (P = 0.10).
Figure 2 ROC curves of different genetic models using the
validation dataset (N = 3,606). Logistic regression using forward
selection method. The 350 genetic markers were entered into the
model by rank of significance.
Wang et al. Genome Medicine 2011, 3:3
/>Page 6 of 11
Discussion
Partially powered GWAS and ensuing meta-analysis
have identified a nu mber of non-HLA candidate genes
associated with MS susceptibility [11-14]. Each signifi-
cant association has a very modest effect, representing a
small share of the genetic variance affect ing disease risk.
In this follow-up study of the meta-analysis dataset, we
applied logistic regression stepwise selection methods
andidentified350variants.Weusedthesemarkersto
build a genetic profile associated with the cumulative
genetic risk measured by the probability of an individual
being a MS case. In the validation dataset, we tested the
model and found that the classification algorithm
yielded 62.3% sensitivity and 75.9% specificity, with an
AUC of 0.769. These numbers together indicate that the
application of the genetic profile built using the meta-
analysis discovery dataset does not provide a high discri-
minatory accuracy in the indepe ndent dataset despite a
median cumulative genetic risk in the discovery dataset
of 0.90 for the case group, and 0.01 for the control
group. For the validation dataset, the values are 0.59 for
the case group and 0.32 for the control group.
In order to better understand the magnitude of var-
iance explained by different sets of genes in the logistic
regression models, adjusted R
2
(Nagelkerke’sR
2
)ofdif-
ferent models using the discovery and validation data-
sets were compared (summarized in T able 7). This
analysis assigns to the HLA-DRB1*15:01 allele approxi-
mately 7% of the total variance in the predictive model.
The 11 validated genes explain about 3% of the remain-
ing variance in the discovery dataset and 2% in the vali -
dation dataset. For the 350-gene set, the 349 genes in
addition to HLA-DRB1 in the model explain 49% and
17% of the total variance in the discovery and validation
datasets, respectively. The estimated cumulative genetic
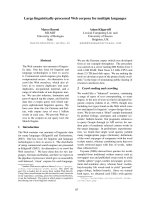
risk in the validation dataset using the 12 validated
genes did not show significant dif ferences between the
case and control groups (Figure 3). On the other hand,
the 350-gene set con tributed to i mproved classification
sensitivity, from 54.3% (12 genes) to 62.3% (350 genes)
in the validation process (Table 4). Furthermore, when
using only the 12 genes, all DRB1*15:01-negative indivi-
duals in the validation dataset were classified as con-
trols, which explains the higher specificity observed in
the 12-gene-set models and its lack of discriminatory
power for DRB1*15:01-negative indivi duals. Finally, the
350-gene set includes 6 markers in the MHC region
other than DRB1, and these are associated with the lar-
gest observed P-values. In order to assess if they play a
surrogate role when calculating the cumulative genetic
risk (P-Hat) in the genetic p rofile, we used logistic
regression condition on DRB1*15:01 (+/-) to assess R
2
of the six MHC variants. The total variance accounted
for these non-DRB1 MHC genes is 2.1% in the discovery
dataset, and 2.6% in the replication dataset.
Several factors could ha ve contributed to the relatively
low sensitivity of the selected genes. First, the power of the
discovery dataset is more likely inadequate to detect all
susceptibility genes. Even though we have used the largest
MS genetic dataset available to date, it has been suggested
that a dataset with 10,000 cases and 10,000 controls might
be able to reach a desirable level of power for GWAS ana-
lysis in order to effectively control both type I and type II
errors. This is especially valid for less frequent alleles
(minor allele frequency ≤10%) and effect size (odds ratio)
in the range 1.1 to 1.3 [35,36]. Second, relevant MS var-
iants may have gone undetected because of the partial
genome coverage in the currently av ailable SNP arrays.
Third, there are unknown interactions between genes
involved in the biochemical pathways that contribute to
MS susceptibility. Fourth, the t otal adjusted R
2
of the
logistic regression model is 0.75 and the r-square attribu-
table to genetic factors in this model accounted for only
56.5%, suggesting that without fitting environmental trig-
gers into the model, predictive accuracy will remain lim-
ited. A large number of environmental exposures have
Table 5 Clinical and demographic characteristics of various genetic-load groups
Genetic-load groups by the level of estimated cumulative genetic risk
High Medium Low Misclassified
Clinical and demographic variables P-Hat ≥ 0.95 P-Hat = 0.75-0.95 P-Hat = 0.5-0.75 P-Hat < 0.5 Test
Sample size, N (%) 383 (39.6%) 313 (32.3%) 142 (14.7%) 130 (13.4%)
MSSS (least-square mean)
a
1.77 1.82 1.83 1.81 F = 0.41, P = 0.75
c
T2-lesion load (mm
3
) (least-square mean)
b
15.41 15.40 14.32 15.81 F = 0.98, P = 0.40
c
Age of disease onset (years) 33.81 33.55 33.18 35.90 F = 2.71, P = 0.03
d
DRB1*15:01 +, N (%) 242 (63.2%) 146 (46.7%) 51 (35.9%) 31 (23.9%) c
2
= 74.13
e
DRB1*15:01 -, N (%) 141 (36.8%) 167 (53.4%) 91 (64.1%) 99 (76.1%) P < 0.0001
Female, N (%) 285 (74.4%) 206 (65.8%) 85 (59.9%) 68 (52.3%) c
2
= 25.41
e
Male, N (%) 98 (25.6%) 107 (34.2%) 57 (40.1%) 62 (47.7%) P < 0.0001
a
MSSS (Multiple Sclerosis Severity Score [44]) after square-root transformation to meet normality assumption.
b
T2-lesion volumes after cube-root transformation
to meet normality assumption.
c
ANCOVA test result, with ‘age of disease onset’ and gender as covariates.
d
ANCOVA test result, with gender as covariate.
e
Chi-square test result.
Wang et al. Genome Medicine 2011, 3:3
/>Page 7 of 11
been investigated in MS, but recent epidemiologic and
laboratory studies have provided support primarily for vita-
min D and Epstein-Barr virus exposure [37,38]. A recent
study suggests that adding environmental risk factors into
a predictive algorithm based on genetic variants enhances
the case-control status classification [39]. Fifth, due to the
suboptimal power in the discovery dataset, it is likely that
theselected350variantsincludebothtrueandfalse
sig nal s. The incl usion of false positives in the estimators
that fit the discovery dataset does not contribute to the
prediction in the validating process, also causing a tractable
drop in classification accuracy. Thus, the results shown in
Table 4 may contain a portion of overestimation of model
fit in the discovery dataset analysis results, indicating that
bias could be embedded in predictive modeling when using
the association tests approach in marker selection.
All these confounders are reflected in the fact that
some individuals in the control group carry a high
cumulative genetic risk (P-Hat >0.8). Thus, in this
experiment utilizing the most updated MS genetic data-
set, a high cumulative genetic risk is not sufficient to
predict with high confidence affectation status even in
the discovery dataset (Table 4). Additional layers of
complexity are represented by the likelihood o f unac-
countable epistatic interactions, etiological heterogene-
ity, and epigenetic and random events. These limitations
notwithstanding, the genetic risk as assessed here still
captures a significant portion of the full cumulative
genetic risk (the pro bability of being a MS case) in the
validation dataset between the case (median = 0.59, 75%
quartile = 0.74) and control group (median = 0.32, 75%
quartile = 0.49). The model with the 350-gene set pro-
duced a larger difference of the estimated cumulative
genetic risk between case and control groups compared
with that produced by the 12-gene set in the models
(Figure 3). Thus, the cumulative genetic risk (P-Hat)
generate d using the 350-gene set can still provide a use-
ful index of the genetic load associated with MS, and
provides important mechanistic insights.
Most valida ted MS susceptibility loci have well-defined
roles in immunologic functions, consistent with the
hypothesis that MS etiology has its primary roots i n early
immune system dysregulation, precipitating secondary
neuronal degeneration. On the other hand, a network-
based pathway analysis of two GWAS in MS, where evi-
dence for genetic association was combined with evi-
dence for protein-protein interaction, demonstrated the
role of neural pathway genes (axon guidance and long-
term potentiation) in conferring susceptibility [26]. The
genetic profile identified in this analysis confir ms the sig-
nificant enrichment of ge nes involved not only in t he
immune response but also in nervous system develop-
ment and neuronal signaling (Table 6). These included
genes encoding cell-cell adhesion molecules (CDH2,
CADM1, CNTN1, NCAM2, NRXN1,andNRXN3)and
Table 6 Functional annotation of the 350 genes
Gene Ontology
a
DAVID
b
Biological process
Cell adhesion (GO:0007155) 0.0000148
Cell communication 0.000632
G-protein signaling, coupled to cyclic nucleotide
second messenger
0.001940
c
System development (GO:0048731) 0.000000016
Central nervous system development 0.000293
c
Organ development (GO:0048513) 0.000017
Cellular compartment
Integral to membrane (GO:0016021) 0.0000018
Integral to plasma membrane (GO:0005887) 0.000000026
Dystrophin-associated glycoprotein complex 0.002081
c
Sarcoglycan complex 0.004398
c
Molecular function
Signal transducer activity (GO:0004871) 0.0000025
Transmembrane receptor activity (GO:0004888) 0.0000274
Transmembrane receptor protein phosphatase
activity
0.003811
c
Amine receptor activity 0.004557
c
Hematopoietin/interferon-class (D200-domain)
cytokine receptor activity
0.001526
c
Phosphoinositide binding 0.000737
c
GPI anchor binding 0.003257
c
Calcium-release channel activity 0.004102
c
Delayed rectifier potassium channel activity 0.001212
c
Enriched KEGG pathways PE
b
Cell adhesion molecules (CAMs) 0.00000036
Neuroactive ligand-receptor interaction 0.000542
Allograft rejection 0.001545
Type I diabetes mellitus 0.003487
a
Only significant Gene Ontology levels 4 or higher are indicated for clarity.
b
P-
value correction: DAVID, Benjamini; Pathway Express (PE), FDR.
c
Analysis
results using GOTree Machine [32]. KEGG, Kyoto Encyclopedia of Genes and
Genomes.
Table 7 The percentage of variance (R
2
) explained by predictors in the regression model
Center Gender DRB1*15:01 12 genes
a
350 genes
b
The discovery dataset (n = 8,844) 15% 4% 7% 10% 57%
The validation dataset (n = 3,606) NA 2% 9% 11% (AUC
c
= 0.68) 27% (AUC
c
= 0.769)
a
The 12-gene set includes HLA -DRB1 and 11 additional validated genes.
b
The 350-gene set includes HLA-DRB1 and 349 additional genes identified in the genetic
profile.
c
AUC, area under curve from ROC analysis results.
Wang et al. Genome Medicine 2011, 3:3
/>Page 8 of 11
several neuronal receptors, such as the G-protein coupled
receptors (ADRA1A, ADARA2A, GABRB3, TACR1,
CHR3, HTR1B, HTR1E,andHTR2A), as well as the
metabotropic glutamate receptor (GRM8) and ionotropic
glutamate receptors (GRIK4 and GRIN2B). Interestingly,
members of the glutamate receptor pathway have been
previously identified by our group in both the netwo rk-
based study of one of the GWAS da tasets included in the
meta-analysis utilized here (GR IN2A, GRIK1, GRIK2,
GRIK4, GRID2, GRIA1, GRIK4) [26] and an independent
pharmacogenomic study o f type I inter feron response
(GRIA1, GRID2, SLC1A2) [40]. A more recent pharmaco-
genomic study also identified the ionotropic glutamat e
receptor (GRIA3) associated with interferon response in
MS [41]. These observations further support the pro-
posed mechanism of glutamate excitotoxicity as a preci-
pitating agent of the glial and axonal injury observed in
MS [42,43]. The ramifications of these SNPs on expres-
sion or functi on are unknown; however, their re cent and
continued identification may help evolve a model of MS
pathogenesis with increasing contributions from neuro-
nal genes.
In summary, the cumulative genetic risk estimation
using a genetic profile composed of 350 genes provides
a useful index of the genetic risk leading to MS. The
incomplete classification accuracy reflects most likely
the limited power of available genetic datasets and the
difficulties in incorporating gene-gene interactions and
gene-environment interactions. The imminent publica-
tion of larger high-resolution GWAS and transcriptomic
studies together with recent progress in identifying true
environmental variables will refine this and other mod-
eling approaches for a greater understanding of MS
genetics and assessment of translational applications.
Additional material
Additional file 1: Table S1. Marker information of the 12 validated
genes.
Additional file 2: Table S2. Flow chart of analysis procedures to identify
independent MS susceptibility markers.
Additional file 3: Table S3. Independent markers significant at FDR P ≤
0.05 in the discovery dataset (N = 8,844).
Additional file 4: Table S4. Genetic profile used for assessing the
cumulative genetic risk (350 genes).
Abbreviations
ANCOVA: analysis of covariance; AUC: area under curve; FDR: false discovery
rate; GWAS: genome-wide association study; HLA: human leukocyte antigen;
LD: linkage disequilibrium; MS: multiple sclerosis; MSSS: Multiple Sclerosis
Severity Score; ROC: receiver operating characteristic; SNP: single-nucleotide
polymorphism.
Figure 3 Distribution of the estimated cumulative genetic risk (P-Hat) of case and control groups using the 12-gene set and 350-gene
set in the validation dataset. P-Hat is the estimated cumulative genetic risk (the probability of being a MS case). The median of the cumulative
genetic risk (50% quantile) in the case group is 0.59, and in the control group 0.32. The genetic profile produced a significant difference of P-Hat
between the case and control groups.
Wang et al. Genome Medicine 2011, 3:3
/>Page 9 of 11
Acknowledgements
We thank the MS patients and healthy controls who participated in the
original genetic studies, and the many dedicated IMSGC, GeneMSA, and
ANZgene consortia investigators that participated in the recruitment of
study participants, acquisition of relevant clinical data, and analysis of
original GWAS data. The contributing authors from The Australian and New
Zealand Multiple Sclerosis Genetics Consortium are: Melanie Bahlo, David R
Booth, Simon A Broadley, Matthew A Brown, Simon J Foote, Lyn R Griffiths,
Trevor J Kilpatrick, Jeanette Lechner-Scott, Pablo Moscato, Victoria M Perreau,
Justin P Rubio, Rodney J Scott, Jim Stankovich, Graeme J Stewart, Bruce V
Taylor, James Wiley, Patrick Danoy, Helmut Butzkueven, Mark Slee, Judith
Greer, Allan Kermode, and William Carroll. This study was supported by NIH
grants RO1NS049477 and RO1NS26799, and National Multiple Sclerosis
Society grant RG2901. SEB and PLD are Harry Weaver Neuroscience Scholars
of the US National MS Society.
Author details
1
Department of Neurology, University of California San Francisco, San
Francisco, CA 94143-0435, USA.
2
Program in Translational NeuroPsychiatric
Genomics, Department of Neurology, Brigham and Women’s Hospital and
Harvard Medical School, Boston, MA 02115, USA.
3
Program in Medical and
Population Genetics, Broad Institute of Harvard University and Massachusetts
Institute of Technology, Cambridge, MA 02139, USA.
4
Division of Genetics,
Department of Medicine, Brigham and Women’s Hospital and Harvard
Medical School, Boston, MA 02115, USA.
5
Department of Neurology,
University Hospital Basel, CH 4031, Basel, Switzerland.
6
Department of
Neurology, Vrije Universiteit Medical Centre, Amsterdam 1007 MB, The
Netherlands.
7
Florey Neuroscience Institutes, University of Melbourne,
Victoria 3053, Australia.
8
Department of Neurology, Yale University, New
Haven, CT 06520-8018, USA.
9
GlaxoSmithKline Clinical Imaging Centre,
Hammersmith Hospital and Department of Clinical Neurosciences, Imperial
College, London W12 0NN, UK.
10
Institute for Human Genetics, School of
Medicine, University of California San Francisco, San Francisco, CA 94143-
0435, USA.
Authors’ contributions
JW and JRO conceived and designed the experiments. JW, PIWdB and PLdJ
performed the experiments. JW completed the statistical analysis. SEB, DP,
DP, LBC, PIWdB, LK, CHP, DAH and PLdJ contributed reagents/materials/
analysis tools. JW, JRO, DP and PMM wrote the paper.
Competing interests
The authors declare that they have no competing interests.
Received: 6 August 2010 Revised: 3 January 2011
Accepted: 18 January 2011 Published: 18 January 2011
References
1. Goodin DS: The causal cascade to multiple sclerosis: a model for MS
pathogenesis. PLoS One 2009, 4:e4565.
2. Oksenberg JR, Baranzini SE, Sawcer S, Hauser SL: The genetics of multiple
sclerosis: SNPs to pathways to pathogenesis. Nat Rev Genet 2008,
9:516-526.
3. Compston A, Coles A: Multiple sclerosis. Lancet 2008, 372:1502-1517.
4. Risch N: Linkage strategies for genetically complex traits. I. Multilocus
models. Am J Hum Genet 1990, 46:222-228.
5. Guo SW: Inflation of sibling recurrence-risk ratio, due to ascertainment
bias and/or overreporting. Am J Hum Genet 1998, 63:252-258.
6. Sawcer S, Ban M, Wason J, Dudbridge F: What role for genetics in the
prediction of multiple sclerosis? Ann Neurol 2010, 67:3-10.
7. Hemminki K, Li X, Sundquist J, Hillert J, Sundquist K: Risk for multiple
sclerosis in relatives and spouses of patients diagnosed with
autoimmune and related conditions. Neurogenetics 2009, 10:5-11.
8. Willer CJ, Dyment DA, Risch NJ, Sadovnick AD, Ebers GC: Twin
concordance and sibling recurrence rates in multiple sclerosis. Proc Natl
Acad Sci USA 2003, 100:12877-12882.
9. Hansen T, Skytthe A, Stenager E, Petersen HC, Bronnum-Hansen H,
Kyvik KO: Concordance for multiple sclerosis in Danish twins: an update
of a nationwide study. Mult Scler 2005, 11:504-510.
10. Hawkes CH, Macgregor AJ: Twin studies and the heritability of MS: a
conclusion. Mult Scler 2009, 15:661-667.
11. International Multiple Sclerosis Genetics Consortium: Risk alleles for
multiple sclerosis identified by a genomewide study. N Engl J Med 2007,
357:851-862.
12. Australian and New Zealand Multiple Sclerosis Genetics Consortium:
Genome-wide association study identifies new multiple sclerosis
susceptibility loci on chromosomes 12 and 20. Nat Genet 2009,
41:824-828.
13. International Multiple Sclerosis Genetics Consortium: Refining genetic
associations in multiple sclerosis. Lancet Neurol 2008, 7:567-569.
14. Baranzini SE, Wang J, Gibson RA, Galwey N, Naegelin Y, Barkhof F,
Radue EW, Lindberg RL, Uitdehaag BM, Johnson MR, Angelakopoulou A,
Hall L, Richardson JC, Prinjha RK, Gass A, Geurts JJ, Kragt J, Sombekke M,
Vrenken H, Qualley P, Lincoln RR, Gomez R, Caillier SJ, George MF,
Mousavi H, Guerrero R, Okuda DT, Cree BA, Green AJ, Waubant E, et al:
Genome-wide association analysis of susceptibility and clinical
phenotype in multiple sclerosis. Hum Mol Genet
2009, 18:767-778.
15.
Casaccia-Bonnefil P, Pandozy G, Mastronardi F: Evaluating epigenetic
landmarks in the brain of multiple sclerosis patients: a contribution to
the current debate on disease pathogenesis. Prog Neurobiol 2008,
86:368-378.
16. Otaegui D, Baranzini SE, Armananzas R, Calvo B, Munoz-Culla M,
Khankhanian P, Inza I, Lozano JA, Castillo-Trivino T, Asensio A, Olaskoaga J,
de Munain AL: Differential micro RNA expression in PBMC from multiple
sclerosis patients. PLoS One 2009, 4:e6309.
17. Brassat D, Motsinger AA, Caillier SJ, Erlich HA, Walker K, Steiner LL, Cree BA,
Barcellos LF, Pericak-Vance MA, Schmidt S, Gregory S, Hauser SL, Haines JL,
Oksenberg JR, Ritchie MD: Multifactor dimensionality reduction reveals
gene-gene interactions associated with multiple sclerosis susceptibility
in African Americans. Genes Immun 2006, 7 :310-315.
18. Gregersen JW, Kranc KR, Ke X, Svendsen P, Madsen LS, Thomsen AR,
Cardon LR, Bell JI, Fugger L: Functional epistasis on a common MHC
haplotype associated with multiple sclerosis. Nature 2006, 443:574-577.
19. Yeo TW, De Jager PL, Gregory SG, Barcellos LF, Walton A, Goris A,
Fenoglio C, Ban M, Taylor CJ, Goodman RS, Walsh E, Wolfish CS, Horton R,
Traherne J, Beck S, Trowsdale J, Caillier SJ, Ivinson AJ, Green T, Pobywajlo S,
Lander ES, Pericak-Vance MA, Haines JL, Daly MJ, Oksenberg JR, Hauser SL,
Compston A, Hafler DA, Rioux JD, Sawcer S: A second major
histocompatibility complex susceptibility locus for multiple sclerosis. Ann
Neurol 2007, 61:228-236.
20. Barcellos LF, Sawcer S, Ramsay PP, Baranzini SE, Thomson G, Briggs F,
Cree BC, Begovich AB, Villoslada P, Montalban X, Uccelli A, Savettieri G,
Lincoln RR, DeLoa C, Haines JL, Pericak-Vance MA, Compston A, Hauser SL,
Oksenberg JR: Heterogeneity at the HLA-DRB1 locus and risk for multiple
sclerosis. Hum Mol Genet 2006, 15:2813-2824.
21. Lincoln MR, Ramagopalan SV, Chao MJ, Herrera BM, Deluca GC, Orton SM,
Dyment DA, Sadovnick AD, Ebers GC: Epistasis among HLA-DRB1, HLA-
DQA1, and HLA-DQB1 loci determines multiple sclerosis susceptibility.
Proc Natl Acad Sci USA 2009, 106:7542-7547.
22. Burton PR, Clayton DG, Cardon LR, Craddock N, Deloukas P, Duncanson A,
Kwiatkowski DP, McCarthy MI, Ouwehand WH, Samani NJ, Todd JA,
Donnelly P, Barrett JC, Davison D, Easton D, Evans DM, Leung HT,
Marchini JL, Morris AP, Spencer CC, Tobin MD, Attwood AP, Boorman JP,
Cant B, Everson U, Hussey JM, Jolley JD, Knight AS, Koch K, Meech E, et al:
Association scan of 14,500 nonsynonymous SNPs in four diseases
identifies autoimmunity variants. Nat Genet 2007, 39:1329-1337.
23. Okuda DT, Srinivasan R, Oksenberg JR, Goodin DS, Baranzini SE,
Beheshtian A, Waubant E, Zamvil SS, Leppert D, Qualley P, Lincoln R,
Gomez R, Caillier S, George M, Wang J, Nelson SJ, Cree BA, Hauser SL,
Pelletier D: Genotype-phenotype correlations in multiple sclerosis: HLA
genes influence disease severity inferred by 1HMR spectroscopy and
MRI measures. Brain 2009, 132:250-259.
24. De Jager PL, Jia X, Wang J, de Bakker PI, Ottoboni L, Aggarwal NT, Piccio L,
Raychaudhuri S, Tran D, Aubin C, Briskin R, Romano S, Baranzini SE,
McCauley JL, Pericak-Vance MA, Haines JL, Gibson RA, Naeglin Y,
Uitdehaag B, Matthews PM, Kappos L, Polman C, McArdle WL, Strachan DP,
Evans D, Cross AH, Daly MJ, Compston A, Sawcer SJ, Weiner HL, et al:
Meta-analysis of genome scans and replication identify CD6, IRF8 and
TNFRSF1A as new multiple sclerosis susceptibility loci. Nat Genet 2009,
41:776-782.
25. De Jager PL, Baecher-Allan C, Maier LM, Arthur AT, Ottoboni L, Barcellos L,
McCauley JL, Sawcer S, Goris A, Saarela J, Yelensky R, Price A, Leppa V,
Wang et al. Genome Medicine 2011, 3:3
/>Page 10 of 11
Patterson N, de Bakker PI, Tran D, Aubin C, Pobywajlo S, Rossin E, Hu X,
Ashley CW, Choy E, Rioux JD, Pericak-Vance MA, Ivinson A, Booth DR,
Stewart GJ, Palotie A, Peltonen L, Dubois B, et al: The role of the CD58
locus in multiple sclerosis. Proc Natl Acad Sci USA 2009, 106:5264-5269.
26. Baranzini SE, Galwey NW, Wang J, Khankhanian P, Lindberg R, Pelletier D,
Wu W, Uitdehaag BM, Kappos L, Polman CH, Matthews PM, Hauser SL,
Gibson RA, Oksenberg JR, Barnes MR: Pathway and network-based
analysis of genome-wide association studies in multiple sclerosis. Hum
Mol Genet 2009, 18:2078-2090.
27. Purcell SM, Wray NR, Stone JL, Visscher PM, O’Donovan MC, Sullivan PF,
Sklar P: Common polygenic variation contributes to risk of schizophrenia
and bipolar disorder. Nature 2009, 460:748-752.
28. The International HapMap Project Nature 2003, 426:789-796.
29. MACH Algorithm [ />download/].
30. Hosmer DW, Lemeshow S: Applied Logistic Regression. 2 edition. New York:
Wiley; 2000.
31. Dennis G Jr, Sherman BT, Hosack DA, Yang J, Gao W, Lane HC, Lempicki RA:
DAVID: Database for Annotation, Visualization, and Integrated Discovery.
Genome Biol 2003, 4:P3.
32. Zhang B, Schmoyer D, Kirov S, Snoddy J: GOTree Machine (GOTM): a web-
based platform for interpreting sets of interesting genes using Gene
Ontology hierarchies. BMC Bioinformatics 2004, 5:16.
33. Rioux JD, Goyette P, Vyse TJ, Hammarstrom L, Fernando MM, Green T, De
Jager PL, Foisy S, Wang J, de Bakker PI, Leslie S, McVean G, Padyukov L,
Alfredsson L, Annese V, Hafler DA, Pan-Hammarstrom Q, Matell R,
Sawcer SJ, Compston AD, Cree BA, Mirel DB, Daly MJ, Behrens TW,
Klareskog L, Gregersen PK, Oksenberg JR, Hauser SL: Mapping of multiple
susceptibility variants within the MHC region for 7 immune-mediated
diseases. Proc Natl Acad Sci USA 2009, 106:18680-18685.
34. Hensiek AE, Seaman SR, Barcellos LF, Oturai A, Eraksoi M, Cocco E, Vecsei L,
Stewart G, Dubois B, Bellman-Strobl J, Leone M, Andersen O, Bencsik K,
Booth D, Celius EG, Harbo HF, Hauser SL, Heard R, Hillert J, Myhr KM,
Marrosu MG, Oksenberg JR, Rajda C, Sawcer SJ, Sorensen PS, Zipp F,
Compston DA: Familial effects on the clinical course of multiple sclerosis.
Neurology 2007, 68 :376-383.
35. Sawcer S: The complex genetics of multiple sclerosis: pitfalls and
prospects. Brain 2008, 131:3118-3131.
36. Nannya Y, Taura K, Kurokawa M, Chiba S, Ogawa S: Evaluation of genome-
wide power of genetic association studies based on empirical data from
the HapMap project. Hum Mol Genet 2007, 16:2494-2505.
37. Ascherio A, Munger KL: Environmental risk factors for multiple sclerosis.
Part I: the role of infection. Ann Neurol 2007, 61:288-299.
38. Ascherio A, Munger KL: Environmental risk factors for multiple sclerosis.
Part II: Noninfectious factors. Ann Neurol 2007, 61:504-513.
39. De Jager PL, Chibnik LB, Cui J, Reischl J, Lehr S, Simon KC, Aubin C,
Bauer D, Heubach JF, Sandbrink R, Tyblova M, Lelkova P, Havrdova E,
Pohl C, Horakova D, Ascherio A, Hafler DA, Karlson EW: Integration of
genetic risk factors into a clinical algorithm for multiple sclerosis
susceptibility: a weighted genetic risk score. Lancet Neurol 2009,
8:1111-1119.
40. Byun E, Caillier SJ, Montalban X, Villoslada P, Fernandez O, Brassat D,
Comabella M, Wang J, Barcellos LF, Baranzini SE, Oksenberg JR: Genome-
wide pharmacogenomic analysis of the response to interferon beta
therapy in multiple sclerosis. Arch Neurol 2008, 65:337-344.
41. Comabella M, Craig DW, Morcillo-Suarez C, Rio J, Navarro A, Fernandez M,
Martin R, Montalban X: Genome-wide scan of 500,000 single-nucleotide
polymorphisms among responders and nonresponders to interferon
beta therapy in multiple sclerosis. Arch Neurol 2009, 66:972-978.
42. Trapp BD, Stys PK: Virtual hypoxia and chronic necrosis of demyelinated
axons in multiple sclerosis. Lancet Neurol 2009, 8:280-291.
43. Draghici S, Khatri P, Tarca AL, Amin K, Done A, Voichita C, Georgescu C,
Romero R: A systems biology approach for pathway level analysis.
Genome Res 2007, 17:1537-1545.
44. Roxburgh RH, Seaman SR, Masterman T, Hensiek AE, Sawcer SJ, Vukusic S,
Achiti I, Confavreux C, Coustans M, le Page E, Edan G, McDonnell GV,
Hawkins S, Trojano M, Liguori M, Cocco E, Marrosu MG, Tesser F, Leone MA,
Weber A, Zipp F, Miterski B, Epplen JT, Oturai A, Sorensen PS, Celius EG,
Lara NT, Montalban X, Villoslada P, Silva AM, et al: Multiple Sclerosis
Severity Score: using disability and disease duration to rate disease
severity. Neurology 2005, 64:1144-1151.
doi:10.1186/gm217
Cite this article as: Wang et al.: Modeling the cumulative genetic risk
for multiple sclerosis from genome-wide association data. Genome
Medicine 2011 3:3.
Submit your next manuscript to BioMed Central
and take full advantage of:
• Convenient online submission
• Thorough peer review
• No space constraints or color figure charges
• Immediate publication on acceptance
• Inclusion in PubMed, CAS, Scopus and Google Scholar
• Research which is freely available for redistribution
Submit your manuscript at
www.biomedcentral.com/submit
Wang et al. Genome Medicine 2011, 3:3
/>Page 11 of 11