báo cáo khoa học: "Metabolome in schizophrenia and other psychotic disorders: a general population-based study" pptx
Bạn đang xem bản rút gọn của tài liệu. Xem và tải ngay bản đầy đủ của tài liệu tại đây (640.3 KB, 14 trang )
RESEARCH Open Access
Metabolome in schizophrenia and other psychotic
disorders: a general population-based study
Matej Orešič
1*
, Jing Tang
1
, Tuulikki Seppänen-Laakso
1
, Ismo Mattila
1
, Suoma E Saarni
2
, Samuli I Saarni
2,3
,
Jouko Lönnqvist
2,3
, Marko Sysi-Aho
1
, Tuulia Hyötyläinen
1
, Jonna Perälä
2
and Jaana Suvisaari
2
Abstract
Background: Persons with schizophrenia and other psychotic disorders have a high prevalence of obesity,
impaired glucose tolerance, and lipid abnormalities, particularly hypertriglyceridemia and low high-density
lipoprotein. More detailed molecular information on the metabolic abnormalities may reveal clues about the
pathophysiology of these changes, as well as about disease specificity.
Methods: We applied comprehensive metabolomics in serum samples from a general population-based study in
Finland. The study included all persons with DSM-IV primary psychotic disorder (schizophrenia, n = 45; other non-
affective psychosis (ONAP), n = 57; affective psychosis, n = 37) and controls matched by age, sex, and region of
residence. Two analytical platforms for metabolomics were applied to all serum samples: a global lipidomics
platform based on ultra-performance liquid chromatography coupled to mass spectrometry, which covers
molecular lipids such as phospholipids and neutral lipids; and a platform for small polar metabolites based on two-
dimensional gas chromatography coupled to time-of-flight mass spectrometry (GC × GC-TOFMS).
Results: Compared with their matched controls, persons with schizophrenia had significantly higher metabolite
levels in six lipid clusters containing mainly saturated triglycerides, and in two small-molecule clusters containing,
among other metabolites, (1) branched chain amino acids, phenylalanine and tyrosine, and (2) proline, glutamic,
lactic and pyruvic acids. Among these, serum glutamic acid was elevated in all psychoses (P = 0.0020) compa red to
controls, while proline upregulation (P = 0.000023) was specific to schizophrenia. After adjusting for medication
and metabolic comorbidity in linear mixed models, schizophrenia remained independently associated with higher
levels in seven of these eight clusters (P < 0.05 in each cluster). The metabolic abnormalities were less pronounced
in persons with ONAP or affective psychosis.
Conclusions: Our findings suggest that specific metabolic abnormalities related to glucoregulatory processes and
proline metabolism are specifically associated with schizophrenia and reflect two different disease-related
pathways. Metabolomics, which is sensitive to both genetic and environmental variation, may become a powerful
tool in psychiatric resear ch to investigate disease susceptibility, clinical course, and treatment response.
Background
Psychotic disorders are among the most severe and
impairing medical diseases [1]. Schizophrenia is the most
common of them, with a lifetime prevalence of 1% in a
general population [2]. The current view is that schizo-
phrenia is a developmental disorder caused by a combina-
tion of genetic vulnerability, early environmental insults,
subtle developmental and cognitive impairments, and later
influences such as social adversity and drug abuse [3], with
heritability of about 80% [4,5]. The Diagnostic and Statisti-
cal Manual of Mental Disorders (DSM)-IV divides primary
psychotic disorders into nine different diagnoses based on
symptom patterns, clinical course and outcome, although
it is unclear whether this has any etiological justification.
Nevertheless, while there is overlap in genetic vulnerability
between different psychotic disorders, like schizophrenia
and bipolar I disorder, t hey also have non-sh ared genetic
and environmental risk factors [5,6]. Given the multi-
factori al complexity of ps ychotic disorders [7], ide ntifica-
tion of molecular markers sensitive to the underlying
* Correspondence:
1
VTT Technical Research Centre of Finland, Tietotie 2, PO Box 1000, FI-02044
VTT, Espoo, Finland
Full list of author information is available at the end of the article
Orešič et al. Genome Medicine 2011, 3:19
/>©2011Orešičč et al.; licensee BioMed Central Ltd. This is an open access article distributed under the terms of the Creative Commons
Attribution License ( which permits unrestricted use, distribution, and reproduction in
any medium, provided the original work is properly cited.
pathogenic factors of specific diseases would be of high
relevance, not only to assist in their early detection and
diagnosis, but also to subsequently facilitate disease moni-
toring and treatment responses.
Metabolomics is a discipline dedicated to the global
study of small molecules (that is, metabolites) in cells, tis-
sues, and biofluids. Concentration changes of specific
groups of circulating metabolites may be sensitive to
pathogenically relevant factors, such as genetic variation,
diet, age, or gut microbiota [8-12]. Over the past years,
technologies have been deve loped that allow comprehen-
sive and quantitative investigation of a multitude of
different metabolites [13]. The study of high-dimensional
chemical signatures as obtained by metabolomics may
the refore be a powerful tool for charact eriz ation of com-
plex phenotypes affected by both genetic and environ-
mental factors [14]. Previous metabolomic studies in
schizophrenia and related psychoses have highlighted the
importance of glucoregulatory processes [15,16] and
tryptophan metabolism [17] in psyc hosis, and lipidomics
approaches have identified specific drug-response profiles
for three commonly used atypical a ntipsychotics [18].
However, no metabolomics studies have so far been
conducted to discriminate between different groups of
psychotic disorders.
Here we sought to determine the serum metabolic
profiles associated with different psychotic disorders,
clustered into three main categories: schizophrenia,
affective psychoses, and other non-affective psychoses
(ONAP). A metabolomics approach with broad analyti-
cal coverage was applied to serum samples from a well
characterized population cohort [2]. We investigated
dependencies of the three different diagnostic groups on
specific metabolic profiles in the context of metabolic
comorbidity, antipsychotic medication as well as other
lifestyle variables.
Materials and methods
Study population
The subjects are from the Health 2000 survey, which is
based on a nationally representative sample of 8,028
people aged 30 years or over from Finland [19]. A two-
stage stratified cluster sampling procedure was used.
The field work took p lace between September 2000 and
June 2001, and consisted of a home intervie w and a
health examination at the local health center, or a con-
densed interview and health examination of non-respon-
dents at home. In addition, register information was
gathered on the whole sample. The Health 2000 study
and the accompanying Psychoses in Finland study were
approved by the Ethics Committees of the National
Public Health Institute (since 2009 the National Institute
for Health and Welfare) and the Hospital District of
Helsinki and Uusimaa, and participants gave written
informed consent [19]. The response rate in the survey,
93%, was exceptionally high compared with other recent
surveys.
In the Psychoses in Finland study, we screened people
with possible psychotic disorders from the Health 2000
studysampleandinterviewedthemusingtheResearch
Version of the Structured Clinical Interview for DSM-IV
(SCID-I) [20]. People were invited to participate in the
SCID interview if they reported having been diagnosed
with a psychotic disorder, received a diagnosis of a pos-
sible or definite psychotic disorder from the physician
conducting the health examinati on, or reported possible
psychotic or manic symptoms in the Composite Interna-
tional Diagnostic Interview [21] conducted as part of the
health examination. A register-based screen was also
used, including hospital treatment for a diagnosis of any
psychotic disorder, reimbursement for antipsychotic
medication, receipt of a disability pension because of a
psychotic disorder, or use of mood-stabilizing medica-
tion without a diagnosis of any relevant medical condi-
tion, such as epilepsy [2].
Of the screen-positive people, 63.4% participated in
theSCIDinterview.Wediagnosedthosewhodidnot
participate in the interview using hospital and outpatient
case notes from psychiatric and primary care units. Case
notes for those who participated in the interview were
also collected. Final DSM-IV-based diagnoses were
made by JS, JP, and SIS using all available information.
Kappa values between the raters ranged from 0.74 to
0.97 for different psychotic disorders [2].
In this study, lifetime diagnose s of psychotic disorders
were grouped into schizophrenia, ONAPs (schizophreni-
form disorder, schizoaffective disorder, delusional disor-
der, brief psychotic disorder, psychotic disorder not
otherwise specified), and affective psychosis (major
depressive disorder with psychotic features and bipolar I
disorder). The final study sample comprised 45 subjects
with schizophrenia (19 men), 57 with ONAP (20 men),
and 37 with affective psychosis (23 men) for whom
serum samples were available. There were more women
than men in the schizophrenia and ONAP groups, which
reflects the gender d istribution in the Finnish general
population aged 30 years and over and the higher preva-
lence of schizoaffective disorder in women than in men
[2]. An equal number of controls, matched for age, sex,
and region of residence, was selected for each group
(Table 1). Most of the antipsychotics used by patients
were first-generation antipsychotics (Table 1). A total of
12 subjects in the sample used second-generation anti-
psychotics, of whom 7 used risperidone, 4 clozapine, and
one olanzapine. There were 54 subjects who used first-
gene ration antipsychotics, of which the most commonly
used were perphenazine (22 users) and thioridazine
(16 users).
Orešič et al. Genome Medicine 2011, 3:19
/>Page 2 of 14
Blood samples
Participants were asked to fast a minimum of 4 hours
before the examination. Subjects with antidiabet ic medi-
cation were allowed to take their medication and meals
at the time they would usually take them (the number of
such subjects was three in the schizophrenia group and
two in their controls, six in the ONAP group and two in
their controls, none in the affective psychosis group and
one in their controls). Blo od samples were taken at the
beginning of the health examination or home health
examination. Serum samples were separated, aliquoted
and subsequently stored at -70°C (-94°F).
Biochemical measures
Total, high-density lipoprotein (HDL), and low-density
lipoprotein (LDL) cholesterol, triglycerides and glucose
were measured with an AU400 analyzer (Olympus,
Japan). The inter-assay coefficient of variation for
Table 1 Demographic characteristics and mean values and c
2
tests
a
of variables related to metabolic comorbidity for
persons with psychotic disorders and their matched controls
Schizophrenia Other non-affective psychosis Affective psychosis
Variable Cases Controls P-value Cases Controls P-value Cases Controls P-value
Age (years) 53.7 (12.9) 53.7 (12.9) NS 54.7 (14.3) 54.7 (14.3) NS 54.7 (14.8) 54.7 (14.9) NS
Sex
Male 19 19 NS 20 20 NS 23 23 NS
Female 26 26 37 37 14 14
Antipsychotic medication use
Current 34 (75.6%) 0 (0%) <0.001 24 (42.1%) 0 (0%) <0.001 8 (21.6%) 0 (0%) 0.003
Atypical antipsychotics 8 (17.0%) 0 (0%) 4 (7.0%) 0 (0%) 0 (0%) 0 (0%)
Lifetime 44 (97.8%) NA 50 (87.7%) NA 34 (91.9%) NA
Type 2 diabetes 11 (24.4%) 3 (6.7%) 0.020 8 (14.0%) 4 (7.0%) NS 0 (0%) 3 (8.1%) NS
Metabolic syndrome 19 (42.2%) 13 (28.9%) NS 25 (43.9%) 15 (26.3%) 0.048 10 (27.0%) 11 (29.7%) NS
Metabolic comorbidity
b
22 (48.9%) 15 (33.3%) NS 33 (57.9%) 21 (36.8%) 0.024 14 (37.8%) 14 (37.8%) NS
Daily smoking 20 (44.4%) 12 (26.7%) NS 17 (29.8%) 15 (26.3%) NS 10 (27.0%) 9 (24.3%) NS
Daily use of vegetables 20 (45.5%)
d
32 (71.1%) 0.014 23 (41.1%)
d
35 (61.4%) 0.031 19 (51.4%) 20 (54.1%) NS
Daily use of milk with high fat % 20 (46.5%)
e
16 (36.4%) NS 21 (37.5%)
d
16 (28.6%)
d
NS 15 (40.5%) 12 (32.4%) NS
Daily use of vegetable oils 27 (62.8%)
e
31 (68.9%) NS 35 (61.4%)
d
42 (75.0%) NS 25 (67.6%) 22 (59.5%) NS
Daily use of cheese with high fat
content
8 (19.1%)
f
33.3% (15) NS 16 (28.6%)
d
14 (25.0%)
d
NS 9 (24.3%) 16 (43.2%) NS
Body mass index (kg/m
2
) 28.4 (5.8) 26.1 (3.3) NS 28.8 (6.2) 26.6 (3.9) NS 27.5 (3.7) 26.4 (4.1) NS
Systolic blood pressure 128.4 (20.1) 134.3
(20.7)
NS 131.6 (17.8) 140.8 (25.4) NS 128.1 (18.8) 135.4 (20.1) NS
Diastolic blood pressure 79.8 (10.7) 80.5 (12.0) NS 82.3 (10.5) 82.7 (10.0) NS 79.9 (10.4) 81.5 (9.9) NS
Plasma glucose (mg/dl) 109.9 (31.9) 97.2 (12.3) 0.016 106.5 (42.5) 101.6 (15.0) NS 97.0 (12.0) 100.2 (14.6) NS
Serum cotinine (μg/l) 216.2
(317.2)
96.8
(207.1)
0.030 151.4
(249.4)
121.2
(253.5)
NS 124.5
(234.2)
150.4
(284.6)
NS
Serum total cholesterol (mg/dl)
c
226.0 (50.0) 229.7
(37.9)
NS 232.3 (41.6) 224.7 (39.6) NS 230.0 (40.0) 237.1 (37.0) NS
Serum HDL cholesterol (mg/dl) 45.3 (13.5) 54.5 (14.5) 0.003 49.7 (14.3) 51.6 (14.6) NS 45.0 (13.0) 50.5 (16.7) NS
Serum triglycerides (mg/dl) 197.4
(130.2)
120.6
(55.2)
0.006 156.5
(112.6)
125.9 (81.2) 0.044 151.4 (97.2) 144.5 (85.0) NS
Serum insulin (μIU/ml) 16.6 (19.6) 7.6 (5.4) <0.001 11.9 (12.4) 8.4 (5.8) NS 9.6 (6.1) 9.3 (7.2) NS
HOMA-IR 4.81 (6.98) 1.84 (1.28) <0.001 4.19 (10.99) 2.17 (1.74) NS 2.33 (1.53) 2.42 (2.25) NS
Fasting time (hours) 6.40 (4.17) 7.13 (3.89) NS 9.29 (5.98) 7.87 (4.23) NS 6.43 (3.98) 8.37 (5.06) NS
Waist circumference (cm) 98.8 (15.1) 89.5 (11.7) 0.003 97.4 (16.4) 90.8 (12.4) 0.037 97.4 (12.2) 93.1 (12.6) NS
C-reactive protein (mg/l) 2.5 (2.8) 1.7 (3.3) 0.004 3.7 (4.9) 2.2 (4.3) 0.017 1.9 (2.9) 1.0 (1.4) NS
BDI score 13.5 (10.9) 5.7 (4.4) <0.001 14.9 (12.3) 6.5 (6.1) <0.001 11.1 ( 9.3) 6.0 (5.6) 0.029
Standard deviations for continuous variables and percentages for categorical variables are reported in parentheses.
a
P-values from c
2
tests for categorical and
Mann-Whitney U tests for continuous variables.
b
Metabolic comorbidity: type 2 diabetes, metabolic syndrome, or obesity (BMI ≥30).
c
To convert cholesterol to
mmol/l, multiply values by 0.0259; to convert triglycerides to mmol/l, multiply value by 0.0113; to convert g lucose to mmol/l, multiply values by 0.0555; and to
convert insulin to pmol/l, multiply values by 6.945.
d
Information missing from one participant.
e
Information missing from two participants.
f
Information missing
from three participants. Abbreviations: BDI, Beck Depression Inventory [26]; BMI, body mass index; HOMA-IR, homeos tasis model assessment index; NA, not
applicable (information on lifetime antipsychotic exposure was not available from controls); NS, not statistically significant.
Orešič et al. Genome Medicine 2011, 3:19
/>Page 3 of 14
glucose (Olympus System reagent, O’Callaghan’s Mills,
Co. Clare, Ireland), triglycerides (Olympus System
reagent), total c holesterol (Olympus System reagent),
HDL cholesterol (HDL-C Plus, Roche Diagnostics, Ma n-
nheim, Germany), and LDL cholesterol (LDL-C Plus,
Roche Diagnostics) was 2.3%, 3.2%, 2.2%, 5.3%, and
5.7%, respectively. Serum insulin concentrations were
determined with an IMx analyzer (Abbott Laboratories,
Abbott Park, IL, USA) by microparticle enzyme immu-
noassay. C-reactive protein (CRP) was determined using
an ultra-sensitive immunoturbidometric test (Orion
Diagnostica, Espoo, Finland) on an Optima analyzer
(Thermo Electron Corporation, Vantaa, F inland). The
inter-assay coefficient of variation of both insulin and
CRP assays was 4.5%. The cotinine concentration was
determined from serum using a radioimmunoassay
methodology (Nicotine Metabolite Double Antibody kit,
Diagnostic Products Corporation, Los Angeles, CA,
USA). The inter-assay coefficient of variation was 12.3%.
Other measures
Blood pressure was measured after a 5-minute rest twice
from the right upper arm with the person sitting. Values
used here are average values from the measurements.
Weight was measured during bioimpedance measure-
ment. Waist circumference was measured while stand-
ing, midway between the lowest rib and the iliac crest,
after a modest expiration [22].
Type 2 diabetes was diagnosed according to the
World Health Organization 1999 criteria [23], combin-
ing information from several sources: self -reported diag-
nosis of type 2 diabetes that was further confirmed in
the clinical examination; antidiabetic medication use
based on self-report or health care registers; or fasting
plasma glucose ≥126 mg/dl (7.0 mmo l/l) or nonfasting
glucose ≥200 mg/dl (11.1 mmol/l) [24]. Metabolic syn-
drome was diagnosed using the National Cholesterol
Education Program’s Adult Treatment Panel III (ATPIII)
criteria [25].
The quantit y of alcohol consumption was investiga ted
by asking the respondents to report their average weekly
consumption during the past month, separately for each
type of alcoholic beverage. The answers were converted
into grams of alcohol per week. Daily smoking was self-
reported and was defined as having smoked at least 100
cigarettes, having smoked for at least 1 year, and having
smoked during the day of the interview or the day
before. Standard, validated diet-related questions were
used to assess the habitual use of vegetable oils versus
butter, use of and fat content in milk products, and
daily use of raw vegetables [22].
The Beck Depression Inventory (BDI-21) [26] was
used to assess current depressive symptoms.
Lipidomic analysis by ultra-performance liquid
chromatography coupled to mass spectrometry
EDTA-blood samples (10 ml) were centrifuged at 3,200
rpm (1600 G) for 15 minutes at room temperature within
2 hours of blood sampling. Serum w as separated and
stored at -80°C. For lipidomics profiling, 10 μl aliquots of
serum were used. The samples were mixed with 10 μlof
0.9% (0.15 M) sodium chloride in Eppendorf tubes, spiked
with a standard mixtu re consisting of 10 lipids (0.2 μg/
sample; PC(17:0 /0:0), PC(17: 0/17:0), PE(17:0/17:0), PG
(17:0/17:0), Cer(d18:1/17:0), PS(17:0/17:0), PA(17:0/17:0),
MG(17:0/0:0/0:0)[rac], DG(17:0/17:0/0:0)[rac], TG(17:0/
17:0/17:0), where PC is phosphatidylcholine, PE is phos-
pha tidylethanolamine, PG is phosphati dylglycerol , Ce r is
ceramide, PS is phosphatidylserine, PA is phosphatidic
acid, MG is monoglyceride, DG is diglyceride, and TG is
triglyceride) and extracted with 100 μl of chloroform/
methanol (2:1). After vortexing (2 mi nutes) and standing
(1 hour) the tubes were centrifuged at 10,000 rpm (7826
G) for 3 minutes and 60 μl of the lower organic phase was
separated and spiked with a standard mixture containing
three labeled lipids (0.1 μg/sample; PC(16:0/0:0-D
3
), PC
(16:0/16:0-D
6
), TG(16:0/16:0/16:0-
13
C3)).
Lipid extracts were analyzed in a randomized order on
a Waters Q-Tof Premier mass spectrometer combined
with an Acquity UltraPe rformance LC™ system (UPLC)
(Waters Corporation, Milford, MA, USA). The column
(at 50°C) was an Acquity UPLC™ BEH C18 1 × 50 mm
with 1.7 μm particles. The solvent system included
ultrapure water (1% 1 M NH
4
Ac, 0.1% HCOOH) and
liquid chromatography/mass spectrome try (MS) grade
acetonitrile/isopropanol (5:2, 1% 1 M NH
4
Ac, 0.1%
HCOOH). The gradient started from 65% A/35% B,
reached 100% B in 6 minutes and remained there for
the next 7 minutes. There was a 5-minute re-equilibra-
tion step before the next run. The flow rate was 0. 200
ml/minute and the injected amount 1.0 μl(Acquity
Sample Organizer). Reserpine was used as the lock
spray reference compound. The lipid profiling was car-
ried out using ESI+ mode and the data were collected at
a mass range of m/z 300 to 1,200 wit h a scan duration
of 0.2 s.
The data were processed by using MZmine 2 software
[27] and the lipid identification was based on an internal
spectral library [28].
Metabolomic analysis by two-dimensional gas
chromatography coupled to time-of-flight MS
Each serum sample (30 μl) was spiked with an internal
standard (7 μl 258 ppm labeled palmitic acid) and the
mixture was then extracted with 400 μlofmethanol.
Labeled d-valine (10 μl, 37 ppm) was added to the
extracts as a derivatization standard. After centrifugation
Orešič et al. Genome Medicine 2011, 3:19
/>Page 4 of 14
the s upernatant was evaporated to dryness and the ori-
ginal metabolites were then converted into their
trimethylsilyl (TMS) and methoxime derivative(s) by
two-step derivatization. First, 25 μl methoxyamine
hydrochloride (MOX) reagent was added to the residue
and the mixture w as incubated for 60 minutes at 45°C.
Next, 25 μl N-methy-N-(trimethylsilyl) trifluoroaceta-
mide was added and the mixture was incubated for
60 minutes at 45°C. The derivatized samples were
diluted 1:1 with hexane. Finally, a retention index stan-
dard mixture (n-alkanes) and an injection standard (4,4’-
dibromooctafluorobiphenyl), both in pyridine, were
added to the mixture.
For the analysis, a Leco Pegasus 4D GC × GC-TOFMS
(two-dimensional gas chromatography coupled to time-
of-flight MS) instrument (Leco Corp., St Joseph, MI,
USA) equipped with a cryogenic modulator was used.
The GC part of the instrume nt was an Agilent 6890N
gas chromatograph (Agilent Technologies, Palo Alto,
CA, USA) equipped with a split/ splitless injector. For
the injection, a pulsed splitless injection (0.5 μl) at
240°C was used, with pulse pressure of 55 psig for
1 minu te. The first-dimension chromatograp hic column
was a 10-m RTX-5 capillary column with an internal
diameter of 0.18 mm and a stationary-phase film thick-
ness of 0.20 μm, and the second-dimension chroma to-
graphic column was a 1.5-m BPX-50 capillary column
with an internal diameter of 100 μmandafilmthick-
ness of 0.1 μm. A di phenyltetramethyldisilyl deactivated
retention gap (3 m × 0.53 mm internal diameter) was
used in the front of the first column. High-purity helium
was used as the carrier gas at a constant pressure mode
(39.6 psig). A 5-s separation time was used in the sec-
ond dimension. The MS spectra was measured at 45 to
700 amu with 100 spectra per second. Pulsed splitless
injection 0.5 μl at 240°C was used. The temperature
program was as follows: the first-dimension column
oven ramp began a t 40°C with a 2-minute hold, after
which the temperature was programmed to 295°C at a
rate of 7°C/minute and then held at this temperature for
3 minutes; the second-dimension column temperature
was maintained 20°C higher than the corre sponding
first-dimension column. The programming rate and
hold times were the same for both columns.
Cluster analysis
The data were scaled into zero mean and unit variance
to obtain metabolite profiles comparable to each other.
Bayesian model-based clustering was applied on the
scaled data to group lipids with similar profiles across
all samples. The analyses were performed using the
MCLUST [29] method, implemented in R [30] as pack-
age ‘mclust’. In MCLUST the observed data are viewed
as a mixture of several clusters and each cl uster comes
from a unique probability density function. The number
of clusters in the mixture, together with the cluster-
specific parameters that constrain the probability distri-
butions, will define a model that can then be com pared
to others. The clustering process selects the optimal
model and determines the data partition accordingly.
Thenumberofclustersrangingfrom4to15andall
available model families were considered in our study.
Models were compared u sing the Bayesian information
criterion, which is an approximation of the marginal
likelihood. The best model is the one that gives the lar-
gest marginal likelihood of data, that is, the highest
Bayesian information criterion value.
Descriptive statistical analyses and linear mixed models
Differences between each diagnostic group and their
matched controls in metabolic comorbidity, lifestyle-
related factors, mood, and glucose and lipid measure-
ments were compared using the c
2
test for categorical
variables and Mann-Whitney U test for continuous vari-
ables. One-way analysis of variance (ANOVA), imple-
mented in Matlab (MathWorks , Natick, MA, USA), was
applied to compare the average metabolite profiles in
each metabolite cluster. Individual metabolite level s
were visualized using the beanplots [31], implemented
in the ‘ beanplot’ R package [30]. Beanplot provides
information on the mean metabolite level within each
group, the density of the data-point dist ribution, as well
as shows individual data points. The independent effects
of diagnostic categories, current antipsychotic medica-
tion use, metabolic comorbidity (that is, type 2 diabet es,
metabolic syndrome, and obesity (body mass index
≥30)), diet (use of vegetableoilversusbutter,useof
milk and cheese with high fat content, daily use of vege-
tables), and duration of fasting were anal yzed using lin-
ear mixed models [32] that took the matching of case-
control pairs into account. Because the matching was
based on both sex and age, these were not included in
the models as independent variables. This analysis wa s
performed using PROC MIXED in SAS statistical soft-
ware, version 9.1.3 (Cary, NC, USA). Logarithm trans-
formations were applied to the metabolomics cluster
values to improve normality.
Partial correlation network analysis
Construction of the dependency network for selected
variables was performed using undirected Gaussian gra-
phical Markov networks that represent q-order partial
correlations between variables, implemented in the
R package ‘qpgraph’ [33] from the Bioco nductor project
[34]. In these networks missing edges denote zero par-
tial correlations bet ween pairs of variables, and thus
imply the conditional indepe ndence relationships in the
Gaussian case.
Orešič et al. Genome Medicine 2011, 3:19
/>Page 5 of 14
Structure learning of the Gaussian graphs corresponds
to a statistical test such as t-test for the hypothesis that
agivenq-order partial correlation is zero. If all of such
hypotheses of zero q-order partial correlations are
rejected, then the two variables are joined by an edge.
In practice, we tested the hypothesis by default with
four equidistant q-values along the (1, 52) interval,
namely q = 1, 13, 26 and 38. For each of the q-values,
the test was repeated for each pair of variables by sam-
pling 500 elements randomly selected from the subsets
ofthedatathatcontainq variables. A missing edge is
identified if the proportion of such tests where the null-
hypothesis is not rejected - for example, the average
non-rejection rate of the hypothesis - i s above a certain
threshold. A small average non-rejection rate therefo re
implies strong evidence of dependence. The resulting
graph can thus be obtained by removing all the missing
edges from the complete graph. Unlike Pearson correla-
tion coefficients, use of partial correlation adjusts for the
confounding effects and thu s removes spurious associa-
tions to a large extent. The network was visualized
using Cytoscape [35] and yED graphical editor [36].
Diagnostic model
A logistic regression model implemented in R was
applied to discriminate the 45 schizophrenia patients
from the 94 other participants diagnosed with psychoses
using four selected metabolic markers. In order to assess
the best marker combination, 10,000 cross-validation
runs were performed. In each run, 93 and 46 samples
were selected at random as the training and test sets,
respectively, and the best marker combination in the
logistic regression model was selected using a stepwise
algorithm using Akaike’s information criterion [37]. The
best model was then applied to the test set samples to
calculate their predicted classes. The optimal marker
combinations in each of the cross-validation runs, recei-
ver operating characteristic (ROC) curves with area
under the curve (AUC) statistics, odds-ratios and rela-
tive risks were recorded.
Results
Metabolomic analysis
Two analytical platforms for metabolomics were applied
to all serum samples: a global lipidomics platform based
on UPLC-MS, which covers molecular lipids such as
phospholipids, sphingolipids, and neutral lipids; and a
platform for small polar metabolites based on GC ×
GC-TOFMS covers small molecules such as amino
acids, free fatty acids, keto-acids, various other organic
acids, sterols, and sugars. Both platforms were recently
described and applied in a large prospective study in
type 1 diabetes [12]. The final dataset from each plat-
form consisted of a list of metabolite peaks (identified
or unidentified) and their concentrations, calculated
using the platform-specific methods, across all samples.
All metabolite peaks were inclu ded in the data analyses,
including the unidentified ones. We reasoned that inclu-
sion of complete data as obtained from the platform
best represents the global metabolome, and the unid en-
tified peaks may still be followed-up later on with
de novo identification using additional experiments if
deemed of interest.
Associations of global metabolome with psychotic
disorders
A total of 360 molecular lipids and 201 metabolites were
measured, of which 170 and 155 were identified, respec-
tively. Due to a high degree of co-regulation among the
metabolites [38], one cannot assume that all the 562
measured metabolites are independent. The global meta-
bolome was therefore first surveyed by clustering the
data into a subs et of clusters using the Bayesian model-
based clustering [29]. Lipidomic platform data were
decomposed into 13 clusters (LC1 to LC13) and the
metabolomic data into 8 clusters (MC1 to MC8).
Descriptions of each cluster and representative metabo-
lites are provided in Table 2. As expected, the division
of clusters to a large extent fo llows different metabolite
functional or structural groups.
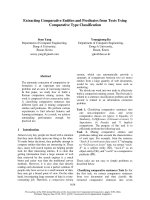
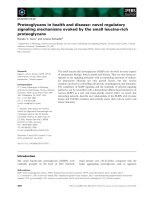
As shown in Fi gure 1, several of the clusters had dif-
ferent average metabolite profiles across the four diag-
nostic groups, with the control groups pooled into one
in this part of the analysis. The a verage profiles of the
lipid clusters LC4 to LC9, which predominantly con-
tained TGs, were most elevated in the schizophrenia
group, although the ONAP and affective psychosis
groups also tended to have higher TGs compared to
controls. The differences were most pronounced for
TGs containing more saturated fatty acids, while the
cluster co ntaining TGs with polyunsaturated fatty acids
(LC10) did not differ bet ween the groups. Two small-
molecule clusters were upregulated in schizophrenia,
MC3 and MC5, containing branched chain amino acids
(BCAAs) and ot her amino acids, including proline, phe-
nylalanine and glutamic acid. A cluster containing var-
ious sugar molecules, MC1, displayed a similar pattern
to those of MC3 and MC5, but at a marginal signifi-
cance level. Cluster MC2, which contained ketone
bodies, keto-acids as wel l as specific free fatty acids, had
a distinct pattern that separated the (high level) ONAP
and the (low level) affective psychosis groups.
Metabolic comorbidity, antipsychotic medication use, and
other lifestyle
It is known that psychoses are associated with metabolic
comorbidities [2] and that the lipid profiles as measured
by lipidomics in schizophrenic patients are greatly
Orešič et al. Genome Medicine 2011, 3:19
/>Page 6 of 14
affected by the use of specific antipsychotic medication
[18]. In order to assess the disease-specificity of the
observed metabolic changes, the linear mixed effects
models were applied on indiv idual metabolite clusters,
which included the three diagnostic categor ies, meta-
bolic comorbidity, current antipsychotic medication, and
diet as well a s fasting time as explanatory variables
(Table 2).
Table 2 Description of metabolite clusters obtained from lipidomic (LC) or metabolomics (MC) platforms
Cluster
name
Cluster
size
Description Examples of metabolites Significant predictors
LC1 112 Major phospholipids,
such as PC, lysoPC, SM
lysoPC(16:0), PC(34:2), SM(d18:1/16:0) None
LC2 48 Mainly PUFA-containing
PCs
PC(16:1/22:6), PC(18:1/20:4) None
LC3 11 PUFA-containing PCs
and PEs
PE(16:0/22:6), PC(18:0/22:6) None
LC4 15 Short chain saturated
TGs
TG(44:0), TG(16:0/16:0/16:0) Schizophrenia (↑, t = 3.72, P = 0.0003), metabolic
comorbidity (↑, t = 6.00, P < 0.0001), daily use of cheese
with high fat content (↑, t = 2.45, P = 0.016)
LC5 31 Mainly unidentified,
includes short odd-
chain TG
TG(43:0) Schizophrenia (↑, t = 2.03, P = 0.045), metabolic
comorbidity (↑, t = 3.09, P = 0.003)
LC6 21 Odd-chain TGs, mainly
saturated or
monounsaturated
TG(47:0), TG(47:1) Schizophrenia (↑, t = 2.27, P = 0.025), metabolic
comorbidity (↑, t = 4.14, P < 0.0001), daily use of cheese
with high fat content (↑, t = 2.29, P = 0.024)
LC7 20 Mainly odd-chain TGs,
longer fatty acids than
LC5 and LC6
TG(15:0/16:0/18:1), TG(51:2), TG(50:2), TG
(16:0/16:0/18:1)
Schizophrenia (↑, t = 3.20, P = 0.002), metabolic
comorbidity (↑, t = 7.99, P < 0.0001), daily use of cheese
with high fat content (↑, t = 2.06, P = 0.042)
LC8
34 Medium- and long-
chain TGs
TG(18:1/16:0/18:1), TG(18:1/16:0/18:2), TG
(18:1/18:1/18:1), TG(18:1/18:2/18:1)
Schizophrenia (↑, t = 3.08, P = 0.003), metabolic
comorbidity (↑, t = 7.04, P < 0.0001)
LC9 17 Longer-chain, SFA- and
MUFA-containing TGs
TG(18:0/18:0/18:1), TG(18:1/18:0/18:1), TG
(18:0/18:0/16:0)
Schizophrenia (↑, t = 4.23, P < 0.0001), metabolic
comorbidity (↑, t = 6.72, P < 0.0001), daily use of cheese
with high fat content (↑, t = 2.93, P = 0.004), fasting time
(↓, t = -1.98, P = 0.050)
LC10 21 PUFA containing long-
chain TGs
TG(16:0/18:1/22:6), TG(56:8), TG(16:0/16:1/
22:6), TG(58:9)
Metabolic comorbidity (↑, t = 5.28, P < 0.0001)
LC11 9 Unknown lipids Use of vegetable oils ( ↓, t = -2.61, P = 0.010), fasting time
(↓, t = -2.06, P = 0.041)
LC12 7 Unknown lipids Use of vegetable oils ( ↓, t = -2.24, P = 0.027)
LC13 5 Unknown lipids None
MC1 34 Sugars, sugar acids, urea
metabolites
Allonic acid, myo-inositol, glycopyranose,
urea
Metabolic comorbidity (↑, t = 3.10, P = 0.002), fasting time
(↓, t = -2.46, P = 0.015)
MC2 18 Ketone bodies, free
fatty
acids
Acetoacetic acid, beta-hydroxybutyric
acid, stearic acid, oleic acid
Schizophrenia (↓, t = -2.68, P = 0.009), affective psychosis
(↓, t = -2.79, P = 0.006), antipsychotic use (↑, t = 2.45, P =
0.016)
MC3 10 Branched chain amino
acids and other amino
acids
Isoleucine, phenylalanine, tyrosine,
ornithine, serine, methionine, threonine
Schizophrenia (↑, t = 2.03, P = 0.045)
MC4 53 Energy metabolites,
various organic acids
Hippuric acid, glycine, succinic acid,
fumaric acid, alpha-linolenic acid, adipic
acid
Antipsychotic use (↓, t = -2.16, P = 0.033)
MC5 38 Amino acids, organic
acids
Proline, glutamic acid, alpha-ketoglutaric
acid, pyruvic acid, alanine, lactic acid,
alpha-hydroxybutyrate
Schizophrenia (↑, t = 2.35, P = 0.020), metabolic
comorbidity (↑, t = 5.19, P < 0.0001), fasting time (↓, t =
-2.34, P = 0.021)
MC6 25 Various organic acids Arachidonic acid, aminomalonic acid,
citric acid
None
MC7 17 Mainly unidentified
carboxylic acids and
alcohols
Beta-sitosterol None
MC8 6 Lipid metabolites 2-Monopalmitin None
The rightmost column shows the results from linear mixed models, with diagnostic categories, current antipsychotic medication use, metabolic comorbidity (that
is, type 2 diabetes, metabolic syndrome, and obesity (body mass index ≥30)), diet (use of vegetable oil versus butter, use of milk and cheese with high fat
content, daily use of vegetables) and hours of fasting. Abbreviations: lysoPC, lysophosphatidylcholine; MUFA, monounsaturated fatty acid; PC,
phosphatidylcholine, PE, phosphatidylethanolamine; PUFA, polyunsaturated fatty acid; SFA, saturated fatty acid; SM, sphingomyelin; TG, triglyceride.
Orešič et al. Genome Medicine 2011, 3:19
/>Page 7 of 14
The TG-containing lipid clusters (LC4 to LC10) all
associated with metabolic comorbidity, but most of
them were also independently and positively associated
with schizophrenia. Diet-related factors also affected
most of them. Surprisingly, none of the lipid clusters
associated with antipsychotic medication use after taking
diagnoses, metabolic como rbidity and diet into account.
Metabolite cluster MC5 was positively associated with
both schizophrenia and metabolic comorbidity, while
one (MC3) was associ ated only with schizophrenia. The
-0.4
-0.2
0.0
0.2
0.4
0.6
0.8
LC1 LC2 LC3 LC4 LC5 LC6 LC7 LC8 LC9 LC10 LC11 LC12 LC13
-0.4
-0.3
-0.2
-0.1
0.0
0.1
0.2
0.3
0.4
0.5
MC1
MC2
MC3 MC4 MC5 MC6
MC7
MC8
Control
Affective psychosis
Other non-affective psychosis
Schizophrenia
Metabolite clusters derived
from lipidomics platform
(360 metabolites)
Metabolite clusters derived
from metabolomics platform
(201 metabolites)
Average metabolite concentration
(relative amount)
Average metabolite concentration
(relative amount)
*
*
P=0.098
P=0.11
*
*
***
*** ***
***
Ctr AP ONAP Sch
Isoleucine (MC3)
Ctr AP ONAP Sch
Phenylalanine (MC3)
200 300 400 500600
300 400 500 600
P=0.00037
P=0.0080
Relative concentration
Relative concentration
Ctr AP ONAP Sch
Proline (MC5)
200 400 600 800 1200
P=0.000023
Relative concentration
Ctr AP ONAP Sch
Ctr AP ONAP Sch
Ctr AP ONAP Sch
TG(44:2) (LC4)
TG(18:1/16:0/18:1) (LC7) TG(18:1/18:0/18:1) (LC9)
0.1 0.5 1.0 5.0 50.0
0.5 1.0 2.0 5.0 10.0 20.0
50.0
2 5 10 20 50 100200 500
P=0.00029
P=0.00045
P=0.000026
μmol/L
μmol/L
μmol/L
200 400 600 8001000
Relative concentration
Ctr AP ONAP Sch
Glutamic acid (MC5)
P=0.0020
2 5 10 20 50 100 500
TG(16:0/18:1/22:6) (LC10)
Ctr AP ONAP Sch
μmol/L
P=0.93
(
a
)
(b)
Figure 1 Mean metabolite levels within each cluster across the three diagnostic groups and the controls. Data were obtained from the
(a) metabolomics (GC × GC-TOFMS) and (b) lipidomics (UPLC-MS) platforms. Error bars show standard error of the mean (*P < 0.05, ***P <
0.001). For each platform, profiles of selected representative metabolites from different clusters are also shown. The order of fatty acids in the
reported triglycerides was not uniquely determined. The metabolite levels are shown as beanplots [31], which provide information on the mean
level (solid line), individual data points (short lines), and the density of the distribution. The concentration scale in beanplots is logarithmic.
Abbreviations: Ctr, control; AP, affective psychoses; ONAP, other non-affective psychoses; Sch, schizophrenia.
Orešič et al. Genome Medicine 2011, 3:19
/>Page 8 of 14
only cluster associated with psychoses other than schi-
zophrenia was MC2, which was negatively associated
with schizophrenia and affective psychosis. One cluster,
MC4, containing various organic acids and energy meta-
bolites, was specifically negatively associated with anti-
psychotic use.
The observed associations of lipid and metabolic clus-
ters with schizophrenia remained significant in most
clusters if patients diagnosed with type 2 diabetes and
their controls were excluded from the analysis (Addi-
tional file 1).
Dependency analysis
The linear mixed model analysis suggests that the
dependencies of different metabolite classes and
related metabolic phenotypes among themselves and
with the specific diagnostic groups are likely complex.
We hypothesized that a network approach may help
elucidate these dependencies to a greater depth. In
addition to diagnostic groups, which included also type
2 diabetes (non-insulin-dependent diabetes mellitus
(NIDDM)) and the metabolite clusters, we selected 27
other environmental and phenotypic variables related
to antipsychotic medication use, diet and lifestyle,
metabolic phenotypes (for example, body mass index,
insulin, glucose, HDL-cholesterol, total TG), and other
biochemical measures, such as CRP and gamma-
glutamyltransferase (GGT). The undirected Gaussian
graphical Markov model was applied to estimate par-
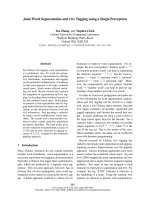
tial correlations between the variables (Figure 2).
In addition to variables related to antipsychotic use,
schizophrenia was associated with two metabolic vari-
ables, lipid cluster LC9 and fasting serum insulin (Insu-
lin in Figure 2). Insulin was further associated with
related metabolic variables such as homeostatic model
assessment (HOMA in Figure 2) index and glucose,
while LC9 was associated with other TG-containing
clusters as well as with total triglyc erides. Both insulin
and LC9 were associated with metabolite cluster MC5,
which was directly linked to MC3. Neither the ONAP
nor the affective psychosis group was directly associated
with the s pecific metabolic clusters. ONAP was asso-
ciated with the inflammatory marker CRP and with
depressive symptoms. Affecti ve psychosis was directly
associated with the liver marker gamma-glutamyltrans-
ferase, w hich not surprisingly was associated with alco-
hol use.
Feasibility of metabolic profile in assisting schizophrenia
diagnosis
We reasoned that due to their independent association
with schizophrenia, insulin as well as specific other
metabolite clusters reflect the disease process itself, and
may thus help discriminate schizophrenia from other
psychoses. To assess the feasibility of diagnosis, we
selected insulin as well as the top-ranking metabolites
from three clusters of most interest based on the net-
work structure in Figure 2: triglyceride TG(18:1/18:0/
18:1) (LC9), isoleucine (MC3), and prolin e (MC5). Only
the three psychotic groups were included in the analysis,
without the c ontrols, and the comparisons were made
between the schizophrenia versus the pooled ONAP and
affective psychosis groups.
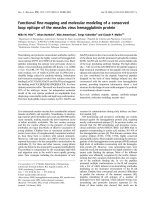
The best model derived from logistic regr ession analy-
sis was obtained by combining proline and TG(18:1/
18:0/18:1). This combination was selected in 53% of
10,000 cross-validation runs. Other strongly performing
models were proline alone (25%) and combined insulin
and proline (13%). Figure 3 shows t he summary of the
combined proline and TG(18: 1/18:0/18:1) diagnosti c
model, based on independently tested data taken from
2,000 samplings.
Discussion
Our f indings, based on a highly phenotypically detailed
general population sample of different psychoses, inde-
pendently associate specific metabolic phenotypes, as
measured by metabolomics, with schizophrenia. It is
known that schizophrenia is associated with elevated
fasting total triglycerides and insulin resistance [39], but
this metabolic abnormality has usually been attributed
to antipsycho tic drug-specific side effects [40]. The
strongest association with schizophrenia based on net-
work analysis as well as linear mixed models was with
the lipid cluster LC9, which contains saturated and
longer chain triglycerides. In a recent lipidomic study of
different lipoprotein fractions in subjects with varying
degrees of insulin resistance, we found that the lipids
found in LC9 are abun dant in liver-produce d very low
density lipoprotein particles and are associated with
insulin resistance [41]. In agreement with this, schizo-
phrenia patients in the present study were insulin resis-
tant and had elevated fasting serum insulin levels.
Together, our data in dicate that schizophrenia, indepen-
dent of antipsychotic medication and metabolic comor-
bidity, is characterized by insulin resistance, and
consequently enhanced hepatic very low density lipopro-
tein production [42] and thus elevated serum concentra-
tions of specific triglycerides. This is consistent with
findings from an earlier study that demonstrated that
antipsychotic medication-naïve patients with schizophre-
nia display hepatic insulin resistance independe nt of
intra-abdominal f at mass or other known factors asso-
ciated with hepatic insulin resistance [43].
The possible pathogenic relevance of our findings is
supported by recent studie s showing that abnormal
insulin secretion and response [44-47] and abnormal
glucose tolerance and risk of diabetes [48] are found
Orešič et al. Genome Medicine 2011, 3:19
/>Page 9 of 14
HDL-Chol
Waist
MC2
BMI
SystBP
MC1
Coitine
High Potency Antipsychotics
LC8
Age
LC7
Low Fat Diet
Gender
High Fat Milk
Smoking
Vegetable Diet
Alcohol
TG
HOMA-IR
Glucose
NIDDM
CRP
BDI
GGT
LC9
Insulin
Low Potency Antipsychotics
Atypical Antipsychotics
Antipsychotics
ONAP
Affective Psychosis
Schizophrenia
MC8
MC6
MC7
LC13
LC12
MC3
LC11
LC6
LC5
LC3
LC2
LDL-Chol
LC1
LC4
Tot-Chol
DiastBP
MC4
LC10
MC5
Colors (Fold change)
P<0.01
P<0.05
P<0.15
NS
P<0.15
P<0.05
P<0.01
Upregulated in
schizophrenia
Down-regulated in
schizophrenia
Lines (Dependencies)
00.250
Average non-rejection rate
Negative Positive
associations
Diagnosis
Clinical variables
Medication
Metabolite clusters
Shapes (data type)
Figure 2 Dependency network in schizophrenia and related psychoses. The network was constructed from the diagnostic, clinical,
antipsychotic medication use, and metabolite cluster data. Node shapes represent different types of variables and platforms, node color
corresponds to significance and direction of regulation (schizophrenia versus controls), and line width is proportional to strength of dependency.
The two metabolic variables directly linked with schizophrenia and two other metabolic network hubs are highlighted with green squares. The
cutoff for the presence of an edge was set at b = 0.25 by the average non-rejection rate, that is, an edge in the graph was tested positive in
25% of the 500 samplings. Abbreviations: BDI, Beck Depression Inventory [26]; BMI, body mass index; Chol, cholesterol; CRP, C-reactive protein;
DiastBP, diastolic blood pressure; GGT, gamma-glutamyltransferase; HDL, high-density lipoprotein; HOMA-IR, homeostatic model assessment
index; LDL, low-density lipoprotein; NIDDM, non-insulin-dependent diabetes mellitus; SystBP, systolic blood pressure; TG, total triglycerides; Tot,
total.
Orešič et al. Genome Medicine 2011, 3:19
/>Page 10 of 14
already in drug-naïve first-episode patients with schizo-
phrenia. In line with this, the insulinotro pic [49,50]
BCAAs from the metabolic cluster MC3 were also ele-
vated and specifically associated with schizophrenia. In
the context of psychoses, BCAAs are not only important
due to their rol e in stimulating insulin secretion, but
also since they compete with aromatic amino acids f or
transport across the blood-brain barrier [51]. Their
increase may thus lead to concentration decreases of
neurotransmitters derived from the aro matic amino
acids in the bra in, specifically catecholamines from tyro-
sine and phenylalanine (MC3) and serotonin from tryp -
tophan (MC5). However, the effect of BCAA-induced
dopamine or serotonin depletion in the brain on schizo-
phrenia-related cognitive performance is currently con-
troversial [52,53]. Another potential mechanism linking
schizophrenia and long-term hyperinsulinemia i s dysre-
gulation of insulin-receptor-mediated signaling, which
has a role in learning and memory as well as in region-
ally specific glucose metabolism in the brain [54].
The metabolic cluster MC5, which included proline
and glutamate, was strongly associated with schizophre-
nia. Glutamate has been hypothesized to play an impor-
tant role in schizophrenia [55]. Our data show that
serum glutamate is elevated in all psychoses compared
to controls (Figure 1), supporting the view that gluta-
mate-related metabolic abnormalities may reflect a com-
mon p athway across differe nt psychoses [56]. However,
one should also note tha t the dependen cy of glutama te
concentrations between the brain and blood is weak and
complex due to restricted and tightly controlled passage
of glutamate across the blood-brain barrier [57].
Upregulation of serum proline was specific to schizo-
phrenia. There is evidence from genetics that poly-
morphisms i n the PRODH gene, encoding proline
oxidase, which is located at 22q11, are associated with
schizophrenia risk [58,59] and that the related hyperpro-
linemia negatively associates with cognitive performance
[60]. In particular, functional variants in the PRODH
gene that result in reduction of proline oxidase activity
and hyperprolinemia are associated with increased risk
of schizophrenia and changes in fronto-striatal structure
and function [59,61]. Interestingly, schizophrenia is
linked to the same copy number variants spanning the
22q11 region including PRODH as autism and other
childhood developmental d isorders, whereas bipolar dis-
order is not [62]. Furthermore, recent functional studies
suggest that microdeletions on human chromosome 22
(22q11.2) lead to impaired long-range synchrony of neu-
ronal activity and may thus be an importa nt component
of the pathophysiology of schizophrenia [63].
Having a population-based sample with carefully
matched controls was a definite strength of the study.
The Psychoses in Finland study has been charact erize d
as ‘arguably the most thorough study ever undertaken
on the prevalence of psycho tic disorders’ [64]. In addi-
tion to the careful screening and assessment of psycho-
tic disorders, the assessment of health and lifestyle in
the Health 2000 survey was comprehensive. Diab etes
and metabolic syndrome had been carefully diagnosed
[24,39] and their effects had been controlled for in the
analyses. Notably, most antipsychotics used by patients
were first-generation antipsychotics, which are less asso-
ciated with diabetes compared to second-generation
antipsychotics [65]. However, the sample was relatively
old and the mean duration of illness among subjects
with psychotic disorders had been long. Although we
controlled for the effects of current lifestyle, all the
long-term effects of antipsychotic m edication and life-
style-related factors, like smoking, nutrition and exer-
cise, may not have been captured. Nevertheless, studies
on drug-naïve first-episode patients already find
impaired glucose tolerance, elevated insulin and meta-
bolic abnormalities [43-48] that are not related to poor
health habits [48]. Longitudinal research in prodromal
and early psychosis is needed to f urther elucidate the
role of the identified metabolomic changes in psychotic
disorders.
Conclusions
Our study suggests that proline-related metabolic
abnormalities and insulin secretion-relate d changes
False positive rate
True positive rate
AUC = 0.67 (0.54, 0.79)
OR = 7.25 (2.00, Inf)
RR = 1.333 (1.094, 1.815)
0.0 0.2 0.4 0.6 0.8 1.0
0.0 0.2 0.4
0.6 0.8 1.0
Figure 3 Feasibility of diagnosing schizophrenia among
different psychoses, based on proline and TG(18:1/18:0/18:1)
concentrations. The characteristics of the model (AUC, OR, RR)
independently tested in one-third of the sample are shown as
mean values (5th, 95th percentiles), based on 2,000 cross-validation
runs. Abbreviations: AUC, area under the receiver operating
characteristic (ROC) curve; OR, odds ratio; RR, relative risk.
Orešič et al. Genome Medicine 2011, 3:19
/>Page 11 of 14
(BCAAs, insulin, triglycerides) ref lect two different dis-
ease-related pathways. T his is further supported by the
fact that the best candidate diagnostic model separating
schizophrenia from other psychoses is obtained by com-
bining the selected metabolites from each of the two
pathways. We believe metabolomics, which is sensitive
to both genetic and environmental variation, will be a
powerful tool to further investigate susceptibility to psy-
chotic disorders, their clinical course, and treatment
responses.
Additional material
Additional file 1: Supplementary Table 1. Linear mixed models, with
diagnostic categories, current antipsychotic medication use, diet,
metabolic comorbidity (obesity or metabolic syndrome) and fasting time
as explanatory variables. People with type 2 diabetes and their matched
controls were excluded from the analysis.
Abbreviations
BCAA: branched chain amino acid; BDI: Beck Depression Inventory; CRP: C-
reactive protein; DSM: Diagnostic and Statistical Manual of Mental Disorders;
GC × GC-TOFMS: two-dimensional gas chromatography coupled to time-of-
flight mass spectrometry; HDL: high-density lipoprotein; LDL: low-density
lipoprotein; MS: mass spectrometry; ONAP: other non-affective psychoses;
PC: phosphatidylcholine, PE: phosphatidylethanolamine; SCID: Structured
Clinical Interview for DSM-IV; TG: triglyceride; UPLC: ultra-performance liquid
chromatography.
Acknowledgements
We thank Ulla Lahtinen, Anna-Liisa Ruskeepää, and Sandra Castillo for their
help in metabolomic analysis and data processing. This work was supported
in part by the EU-funded projects ETHERPATHS (FP7-KBBE-222639 to MO)
and TORNADO (FP7-KBBE-222720 to MO), and by the NARSAD Maltz
Investigator Award and the Academy of Finland grant (129434; to JS).
Author details
1
VTT Technical Research Centre of Finland, Tietotie 2, PO Box 1000, FI-02044
VTT, Espoo, Finland.
2
National Institute for Health and Welfare,
Lintulahdenkuja 4, PO Box 30, FI-00271, Helsinki, Finland.
3
Department of
Psychiatry, Helsinki University Central Hospital, Välskärinkatu 12, PO Box 590,
FIN-00029 HUCH, Helsinki, Finland.
Authors’ contributions
JT, MSA, MO, and JS performed the statistical analysis. TSL, IM, and TH
carried out metabolomic analyses. JL and JP participated in the study
design. SES, SIS, JP, and JS researched the primary clinical data. MO and JS
conceived of the study, and participated in its design and coordination and
drafted the manuscript. All authors read and approved the final manuscript.
Competing interests
The authors declare that they have no competing interests.
Received: 13 November 2010 Revised: 6 February 2011
Accepted: 23 March 2011 Published: 23 March 2011
References
1. Üstün TB, Rehm J, Chatterji S, Saxena S, Trotter R, Room R, Bickenbach J:
Multiple-informant ranking of the disabling effects of different health
conditions in 14 countries. Lancet 1999, 354:111-115.
2. Perälä J, Suvisaari J, Saarni SI, Kuoppasalmi K, Isometsä E, Pirkola S,
Partonen T, Tuulio-Henriksson A, Hintikka J, Kieseppa T, Harkanen T,
Koskinen S, Lonnqvist J: Lifetime prevalence of psychotic and bipolar I
disorders in a general population. Arch Gen Psychiatry 2007, 64:19-28.
3. Murray RM, Lappin J, Di Forti M: Schizophrenia: from developmental
deviance to dopamine dysregulation. Eur Neuropsychopharmacol 2008, 18:
S129-S134.
4. Sullivan PF, Kendler KS, Neale MC: Schizophrenia as a complex trait:
evidence from a meta-analysis of twin studies. Arch Gen Psychiatry 2003,
60:1187-1192.
5. Lichtenstein P, Yip BH, Björk C, Pawitan Y, Cannon TD, Sullivan PF,
Hultman CM: Common genetic determinants of schizophrenia and
bipolar disorder in Swedish families: a population-based study. Lancet
2009, 373:234-239.
6. Goldstein JM, Buka SL, Seidman LJ, Tsuang MT: Specificity of familial
transmission of schizophrenia psychosis spectrum and affective
psychoses in the New England family study’s high-risk design. Arch Gen
Psychiatry 2010, 67:458-467.
7. van Os J, Kapur S: Schizophrenia. Lancet 2009, 374:635-645.
8. Illig T, Gieger C, Zhai G, Romisch-Margl W, Wang-Sattler R, Prehn C,
Altmaier E, Kastenmuller G, Kato BS, Mewes HW, Meitinger T, de
Angelis MH, Kronenberg F, Soranzo N, Wichmann HE, Spector TD,
Adamski J, Suhre K: A genome-wide perspective of genetic variation in
human metabolism. Nat Genet 2010, 42:137-141.
9. Lenz EM, Bright J, Wilson ID, Hughes A, Morrisson J, Lindberg H, Lockton A:
Metabonomics, dietary influences and cultural differences: a 1H NMR-
based study of urine samples obtained from healthy British and
Swedish subjects. J Pharm Biomed Anal 2004, 36:841-849.
10. Nikkilä J, Sysi-Aho M, Ermolov A, Seppänen-Laakso T, Simell O, Kaski S,
Oresic M: Gender dependent progression of systemic metabolic states in
early childhood. Mol Syst Biol 2008, 4:e197.
11. Velagapudi VR, Hezaveh R, Reigstad CS, Gopalacharyulu PV, Yetukuri L,
Islam S, Felin J, Perkins R, Boren J, Oresic M, Backhed F: The gut microbiota
modulates host energy and lipid metabolism in mice. J Lipid Res 2010,
51:1101-1112.
12. Oresic M, Simell S, Sysi-Aho M, Näntö-Salonen K, Seppänen-Laakso T,
Parikka V, Katajamaa M, Hekkala A, Mattila I, Keskinen P, Yetukuri L,
Reinikainen A, Lähde J, Suortti T, Hakalax J, Simell T, Hyöty H, Veijola R,
Ilonen J, Lahesmaa R, Knip M, Simell O: Dysregulation of lipid and amino
acid metabolism precedes islet autoimmunity in children who later
progress to type 1 diabetes. J Exp Med 2008, 205:2975-2984.
13. van der Greef J, Stroobant P, Heijden Rvd: The role of analytical sciences
in medical systems biology. Curr Opin Chem Biol 2004, 8
:559-565.
14.
Oresic M: Metabolomics, a novel tool for studies of nutrition, metabolism
and lipid dysfunction. Nutr Metab Cardiovasc Dis 2009, 19:816-824.
15. Holmes E, Tsang TM, Huang JT-J, Leweke FM, Koethe D, Gerth CW,
Nolden BM, Gross S, Schreiber D, Nicholson JK, Bahn S: Metabolic profiling
of CSF: evidence that early intervention may impact on disease
progression and outcome in schizophrenia. PLoS Med 2006, 3:e327.
16. Schwarz E, Prabakaran S, Whitfield P, Major H, Leweke FM, Koethe D,
McKenna P, Bahn S: High throughput lipidomic profiling of
schizophrenia and bipolar disorder brain tissue reve als alterations of
free fatty acids, phosphatidylcholines, and ceramides. J Proteome Res
2008, 7:4266-4277.
17. Yao JK, Dougherty GG Jr, Reddy RD, Keshavan MS, Montrose DM,
Matson WR, Rozen S, Krishnan RR, McEvoy J, Kaddurah-Daouk R: Altered
interactions of tryptophan metabolites in first-episode neuroleptic-naive
patients with schizophrenia. Mol Psychiatry 2009, 15:938-953.
18. Kaddurah-Daouk R, McEvoy J, Baillie RA, Lee D, Yao JK, Doraiswamy PM,
Krishnan KRR: Metabolomic mapping of atypical antipsychotic effects in
schizophrenia. Mol Psychiatry 2007, 12:934-945.
19. Health and functional capacity in Finland: baseline results of the Health
2000 Health Examination Survey (Publication B12/2004). [.
fi/terveys2000/index.uk.html].
20. First MB, Anthony JC, Tepper S, Dryman A: Structured Clinical Interview for
DSM-IV Axis I Disorders, Research Version, Nonpatient Edition (SCID-I/NP) New
York: Biometrics Research, New York State Psychiatric Institute; 1997.
21. Wittchen HU, Pfister H: DIA-X-Interviews: Manual für screening-verfahren und
Interview; Interviewheft Längsschnittuntersuchung (DIA-X-Lifetime);
Ergänzungsheft (DIAX-Lifetime); Interviewheft Querschnittuntersuchung (DIA-X-
12 Monate); Ergänzungsheft (DIA-X-12 Monate); PC-Programm zur
Durchführung des Interviews (Längs- und Querschnittuntersuchung) Frankfurt,
Germany: Swets and Zeitlinger; 1997.
22. Methodology report: Health 2000 Survey. [ />methodologyrep.pdf].
Orešič et al. Genome Medicine 2011, 3:19
/>Page 12 of 14
23. Definition, diagnosis and classification of diabetes mellitus and its
complications (WHO/NCD/NCS/99.2). [ />WHO_NCD_NCS_99.2.pdf].
24. Suvisaari J, Perälä J, Saarni S, Härkänen T, Pirkola S, Joukamaa M, Koskinen S,
Lönnqvist J, Reunanen A: Type 2 diabetes among persons with
schizophrenia and other psychotic disorders in a general population
survey. Eur Arch Psychiatry Clin Neurosci 2008, 258:129-136.
25. Expert Panel on Detection, Evaluation and Treatment of High Blood
Cholesterol in Adults: Executive summary of the third report of the
National Cholesterol Education Program (NCEP) expert panel on
detection, evaluation, and treatment of high blood cholesterol in adults
(Adult Treatment Panel III). JAMA 2001, 285:2486-2497.
26. Beck AT, Ward CH, Mendelson M, Mock J, Erbaugh J: An inventory for
measuring depression. Arch Gen Psychiatry 1961, 4:561-571.
27. Pluskal T, Castillo S, Villar-Briones A, Oresic M: MZmine 2: Modular
framework for processing, visualizing, and analyzing mass spectrometry-
based molecular profile data. BMC Bioinformatics 2010, 11:395.
28. Yetukuri L, Katajamaa M, Medina-Gomez G, Seppanen-Laakso T, Vidal-
Puig A, Oresic M: Bioinformatics strategies for lipidomics analysis:
characterization of obesity related hepatic steatosis. BMC Syst Biol 2007,
1:12.
29. Fraley C, Raftery AE: Model-based methods of classification: Using the
mclust software in chemometrics. J Stat Soft 2007, 18:1-13.
30. The R Project for Statistical Computing. [ />31. Kampstra P: Beanplot: a boxplot alternative for visual comparison of
distributions. J Stat Soft 2008, 28:1-9.
32. McCulloch CE, Searle SR, Neuhaus JM: Generalized, Linear, and Mixed Models.
2 edition. New York: John Wiley and Sons; 2008.
33. Castelo R, Roverato A: Reverse engineering molecular regulatory
networks from microarray data with qp-graphs. J Comput Biol 2009,
16:213-227.
34. Bioconductor. [ />35. Cline MS, Smoot M, Cerami E, Kuchinsky A, Landys N, Workman C,
Christmas R, Avila-Campilo I, Creech M, Gross B, Hanspers K, Isserlin R,
Kelley R, Killcoyne S, Lotia S, Maere S, Morris J, Ono K, Pavlovic V, Pico AR,
Vailaya A, Wang PL, Adler A, Conklin BR, Hood L, Kuiper M, Sander C,
Schmulevich I, Schwikowski B, Warner GJ, et al: Integration of biological
networks and gene expression data using Cytoscape. Nat Protoc 2007,
2:2366-2382.
36. Brohee S, Faust K, Lima-Mendez G, Vanderstocken G, van Helden J:
Network Analysis Tools: from biological networks to clusters and
pathways. Nat Protoc 2008, 3:1616-1629.
37. Yamashita T, Yamashita K, Kamimura R: A stepwise AIC method for
variable selection in linear regression. Commun Stat Theory Methods 2007,
36:2395-2403.
38. Steuer R, Kurths J, Fiehn O, Weckwerth W: Observing and interpreting
correlations in metabolomic networks.
Bioinformatics 2003, 19:1019-1026.
39.
Suvisaari JM, Saarni SI, Perälä J, Suvisaari JV, Härkänen T, Lönnqvist J,
Reunanen A: Metabolic syndrome among persons with schizophrenia
and other psychotic disorders in a general population survey. J Clin
Psychiatry 2007, 68:1045-1055.
40. Meyer JM, Davis VG, Goff DC, McEvoy JP, Nasrallah HA, Davis SM,
Rosenheck RA, Daumit GL, Hsiao J, Swartz MS, Stroup TS, Lieberman JA:
Change in metabolic syndrome parameters with antipsychotic treatment
in the CATIE Schizophrenia Trial: Prospective data from phase 1.
Schizophr Res 2008, 101:273-286.
41. Kotronen A, Velagapudi VR, Yetukuri L, Westerbacka J, Bergholm R, Ekroos K,
Makkonen J, Taskinen MR, Oresic M, Yki-Järvinen H: Saturated fatty acids
containing triacylglycerols are better markers of insulin resistance than
total serum triacylglycerol concentrations. Diabetologia 2009, 52:684-690.
42. Kotronen A, Yki-Jarvinen H: Fatty liver: a novel component of the
metabolic syndrome. Arterioscler Thromb Vasc Biol 2008, 28:27-38.
43. van Nimwegen LJ, Storosum JG, Blumer RM, Allick G, Venema HW, de
Haan L, Becker H, van Amelsvoort T, Ackermans MT, Fliers E, Serlie MJ,
Sauerwein HP: Hepatic insulin resistance in antipsychotic naive
schizophrenic patients: stable isotope studies of glucose metabolism.
J Clin Endocrinol Metab 2008, 93:572-577.
44. Fernandez-Egea E, Bernardo M, Donner T, Conget I, Parellada E, Justicia A,
Esmatjes E, Garcia-Rizo C, Kirkpatrick B: Metabolic profile of antipsychotic-
naive individuals with non-affective psychosis. Br J Psychiatry 2009,
194:434-438.
45. Steiner J, Walter M, Guest P, Myint AM, Schiltz K, Panteli B, Brauner M,
Bernstein HG, Gos T, Herberth M, Schroeter ML, Schwarz MJ, Westphal S,
Bahn S, Bogerts B: Elevated S100B levels in schizophrenia are associated
with insulin resistance. Mol Psychiatry 2010, 15:3-4.
46. Guest PC, Wang L, Harris LW, Burling K, Levin Y, Ernst A, Wayland MT,
Umrania Y, Herberth M, Koethe D, van Beveren JM, Rothermundt M,
McAllister G, Leweke FM, Steiner J, Bahn S: Increased levels of circulating
insulin-related peptides in first-onset, antipsychotic naive schizophrenia
patients. Mol Psychiatry 2010, 15:118-119.
47. Guest PC, Schwarz E, Krishnamurthy D, Harris LW, Leweke FM,
Rothermundt M, van Beveren NJ, Spain M, Barnes A, Steiner J, Rahmoune H,
Bahn S: Altered levels of circulating insulin and other neuroendocrine
hormones associated with the onset of schizophrenia.
Psychoneuroendocrinology 2011.
48. Kirkpatrick B, Miller BJ, Garcia-Rizo C, Fernandez-Egea E, Bernardo M: Is
abnormal glucose tolerance in antipsychotic-naive patients with
nonaffective psychosis confounded by poor health habits? Schizophr Bull
2010.
49. Newsholme P, Bender K, Kiely A, Brennan L: Amino acid metabolism,
insulin secretion and diabetes. Biochem Soc Trans 2007, 35:1180-1186.
50. Newgard CB, An J, Bain JR, Muehlbauer MJ, Stevens RD, Lien LF, Haqq AM,
Shah SH, Arlotto M, Slentz CA, Rochon J, Gallup D, Ilkayeva O, Wenner BR,
Yancy WS Jr, Eisenson H, Musante G, Surwit RS, Millington DS, Butler MD,
Svetkey LP: A branched-chain amino acid-related metabolic signature
that differentiates obese and lean humans and contributes to insulin
resistance. Cell Metab 2009, 9:311-326.
51. Fernstrom JD: Branched-chain amino acids and brain function. J Nutr
2005, 135:1539S-1546.
52. Neuhaus AH, Goldberg TE, Hassoun Y, Bates JA, Nassauer KW, Sevy S,
Opgen-Rhein C, Malhotra AK:
Acute dopamine depletion with branched
chain
amino acids decreases auditory top-down event-related potentials
in healthy subjects. Schizophr Res 2009, 111:167-173.
53. Leung S, Croft R, Guille V, Scholes K, O’Neill B, Phan K, Nathan P: Acute
dopamine and/or serotonin depletion does not modulate mismatch
negativity (MMN) in healthy human participants. Psychopharmacology
2010, 208:233-244.
54. Craft S, Stennis Watson G: Insulin and neurodegenerative disease: shared
and specific mechanisms. Lancet Neurol 2004, 3:169-178.
55. Coyle J: Glutamate and schizophrenia: beyond the dopamine hypothesis.
Cell Mol Neurobiol 2006, 26:365-384.
56. Cherlyn SY, Woon PS, Liu JJ, Ong WY, Tsai GC, Sim K: Genetic association
studies of glutamate, GABA and related genes in schizophrenia and
bipolar disorder: a decade of advance. Neurosci Biobehav Rev 2010,
34:958-977.
57. Smith QR: Transport of glutamate and other amino acids at the blood-
brain barrier. J Nutr 2000, 130:1016S-1022S.
58. Liu H, Heath SC, Sobin C, Roos JL, Galke BL, Blundell ML, Lenane M,
Robertson B, Wijsman EM, Rapoport JL, Gogos JA, Karayiorgou M: Genetic
variation at the 22q11 PRODH2/DGCR6 locus presents an unusual
pattern and increases susceptibility to schizophrenia. Proc Natl Acad Sci
USA 2002, 99:3717-3722.
59. Kempf L, Nicodemus KK, Kolachana B, Vakkalanka R, Verchinski BA, Egan MF,
Straub RE, Mattay VA, Callicott JH, Weinberger DR, Meyer-Lindenberg A:
Functional polymorphisms in PRODH are associated with risk and
protection for schizophrenia and fronto-striatal structure and function.
PLoS Genet 2008, 4:e1000252.
60. Raux G, Bumsel E, Hecketsweiler B, van Amelsvoort T, Zinkstok J,
Manouvrier-Hanu S, Fantini C, Breviere G-MM, Di Rosa G, Pustorino G,
Vogels A, Swillen A, Legallic S, Bou J, Opolczynski G, Drouin-Garraud V,
Lemarchand M, Philip N, Gerard-Desplanches A, Carlier M, Philippe A,
Nolen MC, Heron D, Sarda P, Lacombe D, Coizet C, Alembik Y, Layet V,
Afenjar A, Hannequin D, et al: Involvement of hyperprolinemia in
cognitive and psychiatric features of the 22q11 deletion syndrome. Hum
Mol Genet 2007, 16:83-91.
61. Bender HU, Almashanu S, Steel G, Hu CA, Lin WW, Willis A, Pulver A,
Valle D: Functional consequences of PRODH missense mutations. Am J
Hum Genet 2005, 76:409-420.
62. Guilmatre A, Dubourg C, Mosca AL, Legallic S, Goldenberg A, Drouin-
Garraud V, Layet V, Rosier A, Briault S, Bonnet-Brilhault F, Laumonnier F,
Odent S, Le Vacon G, Joly-Helas G, David V, Bendavid C, Pinoit JM, Henry C,
Impallomeni C, Germano E, Tortorella G, Di Rosa G, Barthelemy C, Andres C,
Orešič et al. Genome Medicine 2011, 3:19
/>Page 13 of 14
Faivre L, Frebourg T, Saugier Veber P, Campion D: Recurrent
rearrangements in synaptic and neurodevelopmental genes and shared
biologic pathways in schizophrenia, autism, and mental retardation. Arch
Gen Psychiatry 2009, 66:947-956.
63. Sigurdsson T, Stark KL, Karayiorgou M, Gogos JA, Gordon JA: Impaired
hippocampal-prefrontal synchrony in a genetic mouse model of
schizophrenia. Nature 2010, 464:763-767.
64. McGrath JJ: The surprisingly rich contours of schizophrenia
epidemiology. Arch Gen Psychiatry 2007, 64:14-16.
65. Smith M, Hopkins D, Peveler RC, Holt RIG, Woodward M, Ismail K: First- v.
second-generation antipsychotics and risk for diabetes in schizophrenia:
systematic review and meta-analysis. Br J Psychiatry 2008, 192:406-411.
doi:10.1186/gm233
Cite this article as: Orešič et al.: Metabolome in schizophrenia and other
psychotic disorders: a general population-based study. Genome Medicine
2011 3:19.
Submit your next manuscript to BioMed Central
and take full advantage of:
• Convenient online submission
• Thorough peer review
• No space constraints or color figure charges
• Immediate publication on acceptance
• Inclusion in PubMed, CAS, Scopus and Google Scholar
• Research which is freely available for redistribution
Submit your manuscript at
www.biomedcentral.com/submit
Orešič et al. Genome Medicine 2011, 3:19
/>Page 14 of 14