báo cáo khoa học: " Classification of unknown primary tumors with a data-driven method based on a large microarray reference database" ppsx
Bạn đang xem bản rút gọn của tài liệu. Xem và tải ngay bản đầy đủ của tài liệu tại đây (574.89 KB, 12 trang )
METH O D Open Access
Classification of unknown primary tumors with a
data-driven method based on a large microarray
reference database
Kalle A Ojala, Sami K Kilpinen and Olli P Kallioniemi
*
Abstract
We present a new method to analyze cancer of unkno wn primary origin (CUP) samples. Our method achieves
good results with classification accuracy (88% leave-one-out cross validation for primary tumors from 56 categories,
78% for CUP samples), and can also be used to study CUP samples on a gene-by-gene basis. It is not tied to any a
priori defined gene set as many previous methods, and is adaptable to emerging new information.
Background
Cancer of un known primary origin (CUP) i s a classifica-
tion given to a malignant neoplasm when a metastasis is
discover ed but the source of the primary tumor remains
hidden. If counted together as a single clinical entity,
CUP is one of the most common cancer types diagnosed
in the world. Some 3 to 5% of all newly diagnosed can-
cers are CUPs, which qualifies this disease entity as one
of the ten most common cancer types, with an inci-
dence that is greater than that of, for example, leukemia
or pancreatic cancers [1,2]. Even at autopsy, the location
of the primary tumor remains a mystery in up to 70% of
CUP cases [1,3]. CUPs present a significant challenge
for physicians, since many of the current treatment
regimes rely on knowledge of the t ype and origin of the
primary tumor.
Several methods for identifying CUP samples based on
their gene expression profiles have been developed.
Talantov et al. [4] and Varadhachary et al. [5] presented
an RT-PCR based method that measures the expression
of ten signature genes. Ma et al. [6] proposed a similar
method based on 92 genes, which resulted in an overall
accuracy of 82% among 39 cancer types. Tothill et al.
[7] presented a support vector machine-based method
for classifying cancer types, and selected 79 genes for an
RT-PCR test reaching a total accuracy of 89% but only
among 13 cancer types. Rosenfeld et al. [8] applied a
similar approach, but instead of measuring traditional
gene expression, they looked at microRNA expression to
classify CUP samples. For a majority of the samples,
they achieved approximately 90% classification accuracy.
Since the development and adoption of gene expres-
sion microarrays, there has bee n interest in developing a
microarray-based cancer classification, including a te st
to identify the origin of CUP cases. Microarrays provide
a robust way to meas ure the expression of a large num-
ber of genes, and recently have been proven to be
applicable in the clinical setting as well [9-12]. At least
two custom microarrays are commercially available,
CUPPrint by Agendia [13] and the Pathwork Diagnostics
TOO test [14,15], and their validation data have been
published [16,17]. Both tests utilize an aprioridefined
set of genes whose expression in the test sample is
measured.
All the previous methods for identification of CUP
tumors thus rely on a fixed set of training samples,
sometimes with a narrow representation of histological
types and anatomical sites, from which the informative
genes have been determined. Thus, these methods can-
not take into account the constantly accumulating scien-
tific knowledge on gene expression across all types of
cancers. Therefore, a more universal and adaptable
method for microarray-based CUP prediction is desir-
able. If the identifi cation of CUPs is performed algorith-
mically from genome-wide expression profiles, as
opposed to from a de fined gene list, the method is scal-
able, more flexible and open to improvement as refer-
ence data increase in both quality and quantity.
* Correspondence:
Institute for Molecular Medicine Finland (FIMM), University of Helsinki,
Tukholmankatu 8, 00140 Helsinki, Finland
Ojala et al. Genome Medicine 2011, 3:63
/>© 2011 Ojala et al.; licensee BioMed Central Ltd. This is an open access article distributed under the terms of the Creative Commons
Attribution License (http:// creativecommons.o rg/licenses/by/2.0), which permits unrestricted use, distributio n, and reproduction in
any medium, provided the original work is properl y cited.
Importantly, definitions of the histopathological and
molecular subgroups of the reference tumors will dra-
matically influence the classifiers, possibly requiring
major changes and improvements to existing disease
classifications. For example, it may be important in the
future to develop specific predictors for, for example,
estrogen receptor-positive and -negative breast cancers,
or the five major breast cancer subgroups, or for other
very small sub groups, such as anapla stic lymphoma
kinase-positive non-small cell lung ca ncers [18,19]. In
other words, the scope of classifying the origin of CUPs
will evolve rapidly as small subgroups of common can-
cers become better understood and it may become
necessarytodiagnosenotjusttheoriginoftheprimary
tumor, but also the molecular subtype of the tumor.
Staub et al. [20] demonstrated that CUP prediction is
possible using available microarray data from about 800
healthy samples and 600 cancer samples extracted from
theGeneExpressionOmnibus(GEO)[21]asarefer-
ence.Theywereabletoconstructapredictorusing
both cancer and healthy tissue samples. Their method is
scalable, in that when new data become available, the
genes used in the classifier can be re-evaluated.
Although they achieved good accuracy (approximately
90%) in a leave-one-out cross-validation (LOOCV) test
using primary tumors, the actual CUP prediction accu-
racy was only 60% in a small set of 20 test samples.
Here, we set out to create a CUP classifier that could
easily be adapted to any reference data set. For this pur-
pose, we analyzed test samples by aligning their micro-
array profiles against the annotated and normalized
GeneSapiens microarray reference database and applied
a slightly modified alignment of gene expression profiles
(AGE P) method - weighted AGEP (wAGEP) - which we
recently developed and described for classification of
cell differentiation patterns [22]. The wAGEP method is
described and validated in this paper.
Materials and methods
Study design
The aim of this study was to study CUP sample charac-
terization using the previously published AGEP method
[22]. The intent was to cr eate a methodology suited not
only to the classical problem of classifying the sample,
but also one that would enable us to study CUP cases
on a gene- by-gene basis. We wanted to be able to com-
pare any gene’s expression in the sample to reference
data, and thus hopefully not only determine the tissue
of origin, but also derive information relevant for treat-
ment from the analysis.
AGEP methodology
This study uses a modified version of the AGEP metho-
dology. Briefly, AGEP calculates a tissue specificity score
(ts-score) for each gene in a test sample for each prede-
fined grou p (such as a tissue or cancer type) in the re fer-
ence data. The ts-score measures, on a scale of -1 to 1 ,
how well the gene’s expression in the test sample classifies
the sample as belonging to the group. A score of -1 indi-
cates that, according t o this gene, the sample is anything
but a member of this group, while a score of 1 means a
perfect fit to the group to the exclusion of all other groups.
A score of 0 means the gene’s expression is indeterminate
when considering if the sample should belong to the
group or not. A final similarity s core between the test
sample and each group in the reference data is then calcu-
lated taking the mean of all ts-scores for each group. The
original AGEP algorithm can be found in [22].
Gene uniqueness calculation
Theweightforageneinaparticularcancertypewas
calculated as follows. First, density estimates for the
gene for each cancer type in the reference data were
constructed as demonstrated in [22]. We then examined
the density estimate of the cancer type in question, and
determined where it was higher than that of any other
cancers. Within the range where the density estimate of
the cancer in question was highest, we calcula ted the
area between it and the next highest density estimate,
regardless of what cancer type it represented (Additional
file 1). Since all density estimates had their area normal-
ized to 1, this procedure resulted in a number between
0 and 1, and represents the uniqueness of that gene’s
expression pattern i n that cancer type when compared
to all other cancer types.
Gene weight application
Gene weights were applied as follows. When calculatin g
the final similarity score between a test sample and a
cancer type (mean of the ts-scores for each gene for
that cancer type), each gene’s ts-score was multiplied by
the weight that gene had for the cancer type in question.
The resulting ts-scores were then divided by the mean
of all gene weights for that cancer type. This was done
to normalize the different amounts of specific genes dif-
ferent cancer types possess. Finally, the similarity score
between the test sample and the cancer type was calcu-
lated by taking a mean of the ts-scores. The workflow is
depicted in Additional file 1.
Reference database
Reference data, both expression values and annotation,
were fetched from the GeneSapiens database [23]. The
cancer data consisted of 5,577 samples that were
grouped into 56 cancer types (Additional file 2). The
healthy tissue reference data were the same as used in
[22], consisting of 1,667 samples representing 44 tissue
types.
Ojala et al. Genome Medicine 2011, 3:63
/>Page 2 of 12
Test data
The test data were from GEO [21] study GSE12630.
They were transformed to be compatible with the Gene-
Sapiens database by using MAS5 and the equalization
transformation as described previously [23,24]. Array-
generation-based gene centering (AGC) was performed
using the ge ne and array generation specific correction
factors used to construct the GeneSapiens database.
Data analysis
All data analysis was done with R [25].
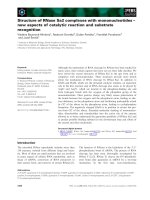
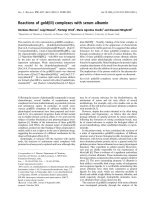
Accuracy versus best similarity score
The test samples were arranged according to the highest
similarity score they had attained for any cancer, and
whether this cancer was a correct classification was also
recorded. From this, the fr actions with the highest score
above a certain threshold were trivial to calculate. A
graph showing accuracy as a function of the highest
similarity score was calculated using a sliding window.
The width of the window was 0.1 (in similarity units)
and it was moved in steps of length 0.005 over the
ordered test sample population. The percentage of cor-
rect classifications within the window at each step was
calculated (Figure 1).
Heatmap and hierarchical clustering
Heatmaps were produced with the ‘heatmap.2’ function
from the ‘gplots’ R library. Standard settings (Euclidean
distance, complete linkage) were used f or the hierarchi-
cal clustering of both genes and samples.
AGEP and wAGEP functions
An R library that contains the original AGEP functional-
ity and function for calculating and applying the gene
weight (wAGEP portion) can be found at [26].
Results
AGEP method and its modification for CUP analysis
AGEP compares the expression value of a gene in a test
sample to the distributions of expression levels of the
same gene across all reference sample groups (for exam-
ple, tissue or tumor types ), and determines how well the
expression level for the gene in the test sample fits with
the corresponding distributions in the reference data.
This analysis is then repeated f or each gene. For a test
sample, AGEP thereby provides a tissue match score
(tm-score) for each gene for each reference tissue type,
which quantifies how well that gene’s expression corre-
sponds to the levels in the reference tissue types. The
AGEP method also evaluates how uniquely the tm-score
categorizes the test sample among the tissues of the
reference data. This is the tissue specificity score (ts-
score). The output from an AGEP analysis are the tm-
and ts-scores for each gene of the test sample in relation
to each tissue type in the reference data. For a more in-
depth description, please see Kilpinen et al. [22].
Tm- and ts-scores allow for comprehensive interpreta-
tion of the molecular nature of the query sample in rela-
tion to the entire reference dataset. For example, among
healthy tissues, the tissue w ith the highest average ts-
score for a test sample indicates the tissue of origin with
high accuracy (93.6%) [22]. The original AGEP method
considers each gene to be equally important when deter-
mining the similarity between a test sample and the
reference data. In the case of cancer classifications, the
search space is increased in both size and complexity.
Cancers are composed of many more histological types
and subtypes and most anatomically defined cancers are
much more heterogeneous than their properly differen-
tiated normal tissue counterparts. In order to further
improve the tissue identification accuracy of the
method, we applied an ad ditional weight factor for each
gene and for each cancer type in the reference data
(resulting in the wAGEP method). This weight is based
on the uniquenes s of the gene’s expression in each par-
ticular cancer type, and was added to strengthen the
impact of highly predictive genes. The weight factor is
derived from the densit y estimates for each gene, and is
calculated from the area of the density estimate that is
higher in the specific cancer type than in any other can-
cer type (Additional file 1), and is thus ind ependent of
the tm- and ts-scores. This w eight ranges from zero to
one, and is applied so that the tissue specificity score for
each gene is multiplied by the appropriate weight before
the final tissue similarity of the sample is considered.
The entire workflow is depicted in Additional file 1, and
further explained in the Materials and methods section.
The key advantage of the AGEP method is that it
examines each gene of the test sample and each sample
group (such as cancer types) in the reference database
independently, and then compares the results across tis-
sues to find the genes that best classify the test sample.
This attribute is retained with the addition of the weight
factor, and the weight only enhances the classifying
potential of genes with cancer-specific expression pro-
files. Additional file 3 shows all the 17,730 genes used in
this study, and their weight for each cancer type. As can
be seen, most cancers have clusters of genes that are
highly unique to them, and form the root of that can-
cer’s histological identity. Therefore, as part of the effort
to develop a reference set for CUP studies, we deter-
mined the most tumor-specific genes across all cancers.
The method used to determine gene weight gives, as
expected, a high weight factor to genes already known
to be highly expressed in certain cancers. For example,
KIT in gastrointestinal stromal tumor (GIST; second
highest weight in GIST, 0.95) and KLK2 and KLK3 in
Ojala et al. Genome Medicine 2011, 3:63
/>Page 3 of 12
prostate cancer (the two highest weights in prostate ade-
nocarcinoma, 0.97 and 0.95, respectively). Also, some
new cancer-specific genes are found, such as TMEM204,
which h as the highest weight for GIS T, 0.96; when
looking at GeneSapiens [23] data, the gene’sexpression
is shown to be extremely specific to GIST (Additional
file 4). Overall, this set of cancer-specific genes could
serve not only as a base for the bioinformatic analysis of
Score > 0.01. 50% of samples, 97% accuracy.
Score > 0.05. 69% of samples, 89% accuracy.
0.0 0.1 0.2 0.3 0.4
0.0
0.2
0.4
0.6
0.8
1.0
Highest similarity score
Percentage correct
Figure 1 A graph of the accuracy of the method as a function of the similarity score of the best hit. The graph was formed by moving a
sliding window of width 0.1 along the score axis, which ranges from -0.021 to 0.495, and calculating the achieved accuracy within that window.
As can clearly be seen, the better the similarity, the higher the probability that the classification is correct.
Ojala et al. Genome Medicine 2011, 3:63
/>Page 4 of 12
CUP samples, but also as a starting point to develop
tumor-specific biomarkers.
It is important to note that the classification is still
based on all genes; some genes in each cancer type just
have a bi gger impact than others in determining the tis-
sue specificity.
Training data
We used the cancer samples from the GeneSapiens
database as the reference data [23,24]. The data consist
of 5,577 malignant tumor samples, whose gene expres-
sion microarray were all normalize d to be directly com-
parable. The data represent 56 different cancer types,
each class having an average of 100 samples per class,
with a minimum of 6 (Additional file 2). Less than 1%
of the samples were metastases; we thus refer to the
reference data as primary cancer samples. These data
were then used to construct cancer-specific gene density
estimates for each gene in each of the 56 different can-
cer classes as described in Kilpinen et al. [22].
LOOCV validation of the training data
To validate the integrity and applicability of the refer-
ence database for AGEP analysis, we performed a
LOOCV analysis of the entire reference data. Thus, the
tissue origins of all 5,577 individual malignant samples
were analyzed by reconstructing cancer-specific gene
density estimat es without the sample in question. AGEP
analysis revealed a total accuracy of 88.2% within the
search space of 56 different in vivo cancer types when a
match to similar cancer types was accepted or 79% if
the exact match was required. Average sensitivity with
the less strict criteria was 0.748 with a specificity of
0.999. Without the application of gene weights (general
AGEP) the total accuracy of training data LOOCV was
78%, substantially less than with wAGEP (88%).
Identification of the tissue of origin of CUP samples
Test data were from GEO [21] study GSE12630, which
contains 187 metastases and poorly differentiated
tumors (128 metastases and 59 poorly differentiated pri-
mary tumors).
We originally compared the test samples against both
the healthy tissue samples (1,667 samples in 44 healthy
tissue types) and the 56 different cancer classes of the
GeneSapiens database. The accuracy of prediction was
69% if we considered both appropriate healthy tissues
and cancers as correct. Interestingly, we found that only
7% of the test samples had a healthy tissue group, a s
opposed to a primary cancer group, as their best match.
This was the case for both test groups, the dedifferen-
tiated primary tumors and metastases. We therefore
conclude that the test samples, which imitate CUP pro-
blem solving, resemble cancers significantly more than
their differentiated healthy tissue counterparts. As a
consequence, subsequent analyses for this study were
done by comparing the test samples only agains t the
cancer reference data. Figure 2 illustrates the findi ngs of
the comparison of test samples against both healthy tis-
sues and cancers.
Comparing the GSE12630 test set against reference
tumors, we achieved 78.1% (78.1% for the metastases,
and 78.0% for t he primary tumor samples) total accu-
racy in identifying the tissue of origin. Classification was
counted as a ccurate when (a) the cancer type with the
highest similarity score was exa ctly the same as the test
sample’sannotation(’ exact’); (b) when the cancer type
with the highest similarity score was from the same
organ, such as lung adenocarcinoma being identified a s
lung squamous cell carcinoma (’ simila r’ ); or (c) when
the cancer type with the highest similarity score was
from the anatomical site of the metastasis and the sec-
ond highest cancer type was of category a or b above
(’same site ’). These results would all prompt a physician
to consider the primary tumor in the correct anatomical
site. Of the metastasis test samples, 64.8% were accurate
according to definition a, 12.5% additional cases accord-
ing to definition b and and additional 0.8% according to
criteria c, resulting in a total accuracy of 78.1%. The
percentages for the primary samples were 71.2%, 6.8%
and not applicable (a sample from a primary tumor can-
not fulfill this criterion), respectively, resulting in a total
accuracy of 78.0%, with an average sensitivity of 72%
and specificity of 99% across all samples (Table 1). The
combined accuracies for each cancer type are shown in
Table 1.
All but one cancer type showed at least 50% classifica-
tion accuracy. The cancer that was particularly difficult
to classify is pancreatic cancer, which is known to have
a complex and heterogeneous genetic base [27]. Pan-
creatic cancer samples were often identified as esopha-
geal cancers. Also, AGEP tends to confuse cancers
originating from one part of the intestinal tract with
cancers originating from ano ther part of it. In fact, if we
were to accept esophagus, gastric and colorectal as cor-
rect predictions for a cancer being of gastrointestinal
origin, the total classification accuracy of gastric cancer
would go from 66.7% to 93.3%, and that of colorectal
cancer from 55.6% to 88.9%.
Intere stingly, there is a strong correlation between the
similarity score for the best match and the likelihood of
it being correct. As can be seen from Figure 1, the
higher the similarity score for the best hit among the
referencedata,themorelikelyitistobecorrect.Thus,
a low wAGEP similarity score means that the test sam-
ple does not resemble any of the cancers it is being
compared to. It may be that the transcriptomic profile
of a metastasis has deviated so much from its origin
Ojala et al. Genome Medicine 2011, 3:63
/>Page 5 of 12
Similarity to own cancer
Similarity to target tissue
-0.4
-0.2
0.0
0.2
0.4
0.6
-0.6
-0.4
-0.2
0.0
0.2
Target tissue
Adrenal gland
Colorectal
Kidney
Liver
Lung
Lymph node
Ovary
Stomach
Thyroid gland
Similarity to cancer of target tissue
Similarity to own cancer
-0.4
-0.2
0.0
0.2
0.4
0.6
-0.6
-0.4
-0.2
0.0
0.2
Target tissue
Adrenal gland
Colorectal
Kidney
Liver
Lung
Lymph node
Ovary
Stomach
Thyroid gland
(
a
)
(b)
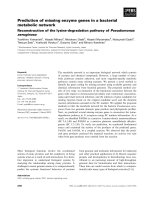
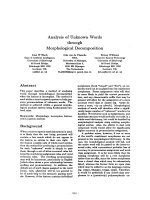
Figure 2 Similarities for 83 metastatic test samples . (a) A comparison of the test samples’ similarities to the healthy tissue where the
metastasis was found (y-axis) and the cancer of origin for the metastasis (x-axis). The spheres are colored according the site of the metastasis
(’target tissue’). The gray diagonal line indicates a boundary, above which the similarity to the target tissue is greater than the similarity to the
sample’s original cancer. Only ten samples display this behavior, and all but one of these are lymph node metastases. (b) A comparison of the
test samples’ similarities to a representative cancer of the tissue where the metastasis was found (y-axis) and the cancer of origin for the
metastasis (x-axis). The triangles are colored according to the site of the metastasis (’target tissue’). The gray diagonal line indicates a boundary
above which the similarity to the cancer of the target tissue is greater than the similarity to the sample’s original cancer. As can be seen, most
samples fall below this line.
Ojala et al. Genome Medicine 2011, 3:63
/>Page 6 of 12
that it is more like an entirely n ew type o f cancer. The
apparent drop in accuracy around the value 0.2 seen in
Figure 1 is due to a single gastric cancer metastasis sam-
ple being incorrectly classified as colorectal cancer.
However, the annotation of the sample suggests that its
real cancer type is at best an educated guess. If we were
to ignore it, the resulting graph would rise steadily until
it plateaued at around 0.15. Thus, we can assess the
reliability of a wAGEP result simply by evaluating the
similarity score of the best hit for that sample. If the
highest similarity score for a ca ncer type is 0. 1 or above
(50% of test samples), the likelihood of the prediction
being correct is 96.8%. If the score is 0.05 or higher
(69% of test samples), the likelihood is still 89.1%. Con-
versely, if the score is lower than 0.05 (bottom 31%), the
likelihood drops to 53.4%. Thus, it is advantageous not
only to predict CUP tissue of origin, but also give an
indication of how likely it is that the prediction is cor-
rect. The detailed results and original annotation for
each sample can be seen in Additional file 5.
Similarity to tissue of metastasis site
We also looked at whether the metastases would resemble
the tissue where they were found. To do this, we returned
to the comparison of the test samples versus the combined
healthy and cancer data. Where possible, we determined
the matching healthy target tissue to where the metastasis
was detected (’target tissue’) and a representative primary
cancer of the same tissue (’cancer of target tissue’ )from
the reference data. T his was done for all metastasis sam-
ples. Of the 128 metastasis samples, 83 could be assigned
to both a target tissue and a cancer of target tissue. We
then studied wheth er the similarity of these test samples
to either their target tissues or cancer of target tissue was
dependent on any of the following: similarity to their origi-
nal cancer, their cancer type, or the target tissue. In 62 of
the 83 cases, the test sample ’s similarity to the cancer of
target tissue was higher than its similarity to the target tis-
sue. In all target tissues except lymph node the vast major-
ity of the test samples resembled the cancer of target
tissue more than the target tissue. In the case of the lymph
node there was an about even split. In terms of the origi-
nal cancer type, the results are similar. All other cancer
types except thyroid carcinoma resemble their cancer of
target tissue more often than the target tissue. For thyroid
carcinoma, five out of the six samples resembled the target
tissue more than the cancer of target tissue. However, four
of th ese samples were lymp h node metastas es. The find-
ings are not surprising, as any epithelial tumors metasta-
sizing to lymph nodes will not start resembling lymphatic
tissue derived cancers. The numbers for each target tissue
and original cancer type can be seen in Tables 2 and 3.
Figur e 2 displays the similarities of the metastatic sam-
ples with their original cancer type, their target tissue
and their cancer of ta rget tissue. As can be seen, when
the metastasis sample s are compared against all-encom-
passing reference data, in over 80% of the cases (below
the gray diagonal line) they still retain a higher similarity
to their original cancer than to either their t arget tissue
or their cancer of target tissue. A combined image for
further study can be found in Additional file 6.
All these results reaffirmed our decision to analyze the
test samples by comparing them to cancer only refer-
ence data.
Table 1 Accuracies per cancer
Cancer Total correct Total samples Percent correct Sensitivity Specificity
Bladder cancer 7 11 63.6% 64% 100%
Breast cancer 11 11 100% 100% 99%
Colorectal cancer 5 9 55.6% 54% 99%
Gastric cancer 10 15 66.7% 67% 98%
Liver cancer 6 8 75.0% 75% 100%
Lung cancer 14 15 93.3% 93% 95%
Lymphoma 23 25 92.0% 88% 99%
Melanoma 15 17 88.2% 88% 99%
Ovarian cancer 7 9 77.8% 78% 98%
Pancreatic cancer 4 13 30.8% 23% 99%
Prostate cancer 10 11 90.9% 91% 100%
Renal cancer 10 11 90.9% 91% 100%
Sarcoma 5 7 71.4% 71% 97%
Testicular cancer 13 16 81.3% 81% 100%
Thyroid cancer 6 9 66.7% 67% 100%
Total/average 146 187 78.1% 72% 99%
Numbers given for each cancer type are all samples correctly classified, all samples tested, the percentage of samples correctly classified as well as the sensitivity
and specificity of the tissue of origin identification.
Ojala et al. Genome Medicine 2011, 3:63
/>Page 7 of 12
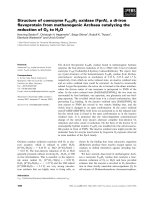
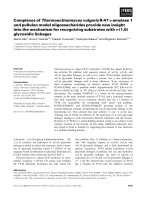
Cancer-specific genes
An advantage of the wAGEP method is that the results
can be analyzed on a per gene basis. Thus, it is possible
to identify the genes that would be good classifiers in
the reference data (that is, genes that have a cancer-
specific expression level) and explore whether those
genes are useful in the identification of the metastasis
samples.
We looked at the samples that were metastases of
renal cancer from the test da ta, and specifically at genes
having renal cancer-specific expression levels. There
were 58 genes with gene weight >0.25 in renal cancer,
and these were selected as the renal cancer-specific
genes. Forty of these were present in all test samples.
When their tissue specificity scores are plotted, a subset
of genes are seen to loose their renal cancer-specific
expression in the metastases (Figure 3a). The 40 genes
can be divided into those that generally retain renal can-
cer-specific expression among all samples, and those
that retain it only in the subset of samples (samples 1 to
3, indicated in blue in Figure 3a). Of note is that sample
10, a lung metastasis, did not have renal cancer as the
closest match, instead identifying as lung squam ous cell
carcinoma.
The vast majority of the renal cancer-specific genes
encode membrane bound proteins, such as the numer-
ous solute carrier family (SLC) genes. The genes that
retain their renal cancer-specific expression in all sam-
ples do not seem to d iffer strongly from the genes that
do not. Of the genes that do not retain their renal can-
cer-specific expression in all samples a few are worth
pointing out. One interesting gene is CNDP2,knownto
be overexpressed in renal cancer [28], but only in grade
1 and 2 cancers [29], with levels in grade 3 and 4 can-
cers being the same as thoseofnormaltissues.When
we examine the tm-scores obtained for this gene for
each sample, a progression can be seen where those
metastases that most closely resemble primary renal
cancers have a high score for this gene, and as the sam-
ples diverge from the primary cancer, so does this
gene’s expression.
Also, the three angiogenesis-related genes, ANGPTL4,
VEGFA and ESM1, seem to be expressed at their origi-
nal levels in most samples and have altered expression
in only a few samples. Finally, a group of three renal
cancer-specific genes, ATAD2, SLC13A1 and DOC2A,
seem to ha ve lost their renal cancer-specific expression
in all sam ples (all the samples are metastases), but the
level of divergence from the renal cancer-specific
expression seems to be stable, independent of the sam-
ple’s overall similarity to renal cancer.
Similar analyses were done for melanoma (Figure 3b)
and gastric cancer (Figure 3c). There were 17 metastasis
samples of melanoma with 42 of 63 genes present, and
10 metastasis samples of gastric cancer with 40 of 53
genes present. In the melanoma case, we could see a
group of genes that retained their melanoma-specific
expression in some samples, and had lost it in others.
However, the retention of melanoma-specific expressio n
Table 2 Numbers of metastasis samples that resemble
the cancer of target tissue more than the target tissue,
and vice versa, sorted per target tissue
Target
tissue
Resembles target
tissue more
Resembles cancer of target
tissue more
Adrenal
gland
17
Colorectal 1 1
Kidney 0 1
Liver 0 6
Lung 3 18
Lymph
node
15 18
Ovary 0 6
Stomach 0 3
Thyroid
gland
12
Total 21 62
Table 3 Numbers of metastasis samples that resemble
the cancer of target tissue more than the target tissue,
and vice versa, sorted per original cancer
Original cancer Resembles target
tissue more
Resembles cancer of
target tissue more
B-cell lymphoma 1 5
Bladder cancer 2 7
Breast ductal cancer 1 6
Colorectal carcinoma 1 4
Gastric
adenocarcinoma
09
Liver cancer 1 1
Lung
adenocarcinoma
34
Lung, squamous cell
carcinoma
02
Melanoma 0 9
Ovarian,
endometrioid
carcinoma
01
Ovarian, serous
carcinoma
11
Pancreatic cancer 1 1
Prostate
adenocarcinoma
12
Renal cancer 2 8
Testis, non-
seminoma
11
Testis, seminoma 1 0
Thyroid cancer 5 1
Total 21 62
Ojala et al. Genome Medicine 2011, 3:63
/>Page 8 of 12
GAL3ST1
CUBN
ZNF395
CDH16
FXYD2
SLC3A1
C14orf105
SLCO4C1
GALNT14
SLC22A2
TMCC1
PLVAP
SLC28A1
PHKA2
ATAD2
SLC13A1
DOC2A
CYP2J2
SLC22A11
BBOX1
EGLN3
TLR3
SLC17A1
ENSG00000135245
IMPA2
SLC17A3
BHMT
KL
ACADL
CNDP2
TMEM140
NAT8
LRP2
ASPA
ADFP
TCN2
ANGPTL4
VEGFA
ESM1
ENPEP
10. Lung metastasis
7. Lymph node metastasis
6. Lung metastasis
9. Lung metastasis
8. Lung metastasis
5. Lung metastasis
4. Liver metastasis
3. Adrenal metastasis
2. Lymph node metastasis
1. Adrenal metastasis
-0.5 0.5
Value
0510
Hi
stogram
Count
ANGPT2
CRSP6
SPINT1
USPL1
EIF4G1
DPP4
GAPDHS
TRPM1
USP19
C1orf50
GRK6
TNFRSF10D
CCDC93
GAB2
HIST1H3G
ZNF518
EPB42
NCAPD2
H2AFY
F5
ENSG00000164548
TUT1
UBE2C
WARS
TP53I11
C20orf42
ENSG00000163694
TBRG4
PAX3
CA14
C10orf110
SLC45A2
SNCA
CART1
DCT
ROPN1B
SOX10
GPR143
MITF
TYR
MLANA
SILV
16. Intestinal metastasi
s
17. Lung metastasis
13. Intestinal metastasi
s
5. Intestinal metastasis
3. Intestinal metastasis
14. Liver metastasis
15. Skin metastasis
1. Intestinal metastasis
11. Lung metastasis
9. Lung metastasis
12. Lung metastasis
7. Peritoneal metastasis
8. Lung metastasis
10. Lung metastasis
2. Lung metastasis
4. Intestinal metastasis
6. Lung metastasis
-0.5
Value
030405060
Histogram
Count
CCL11
GKN1
PLS3
DHRS7B
KIAA0774
SNX5
BDH2
IRS1
STXBP6
EXOSC9
KIF15
TMEM70
RAG2
CD44
AGBL5
ASPM
CLN8
TCF2
I
VNS1ABP
SLC5A4
RPS6KA6
UBFD1
PPFIA4
MAPT
RHOB
TWF2
CHD1
USP3
CNOT3
ISCA1
LIMD1
DNMT3A
RND3
DTX4
F5
ARRB1
PLA2G10
CLDN18
TSPAN8
ANXA10
8. Lymph node metastasis
7. Chest wall metastasis
10. Ovary metastasis
2. Lymph node metastasis
9. Lymph node metastasis
6. Ovary metastasis
4. Ovary metastasis
5. Ovary metastasis
1. Lymph node metastasis
3. Lymph node metastasis
Histogram
20
0
0
0.5
10 20
0
30
40
50
60
Count
10
20
-0.5
Value
0 0.5
(c)
(b)
(a)
Figure 3 Canc er-specific genes. (a) Tissue specificity scores, unmodified by gene weight, for genes whose weight in renal cancer is greater
than 0.25 (40 out of 58 present) are shown for 10 renal cancer metastasis samples. The genes can be divided into two groups, those that lose
their renal cancer-specific expression (blue) and those that do not (red). The samples are named according to where the metastasis was located,
and numbered according to their (relative to each other) similarity to renal cancer. Sample 10 was the only one whose closest similarity was not
renal cancer, it instead being lung squamous cell carcinoma. Samples 1 to 3 are the closest to renal cancer, and retain for most of the genes
renal cancer-specific expression levels. The other samples have lost renal cancer-specific expression among the genes with a blue background.
(b) Similar analysis for the 17 metastatic melanoma samples, showing 42 (out of 63) genes. (c) Similar analysis for 10 metastatic gastric cancer
samples, showing 40 (out of 53) genes.
Ojala et al. Genome Medicine 2011, 3:63
/>Page 9 of 12
does not correlate well with either the sample’s similar-
ity to melanoma or the tissue where the metastasis was.
Also, about half of the genes with melanoma-specific
expression had altered expression in all the melan oma
metastasis samples.
Inthegastriccancercaseweseeagroupoffour
genes, on the left side of the plot, which display different
tm-scores between samples. In most samples the genes
retain gastric cancer-specific expression, but in a few
samples the genes’ expression seems dramatically
altered. As with the melanomas discussed above, most
of the genes that have melanoma-specific expression
seem to have lost that expression.
In both the melanoma and gastric cancer sample sets,
one or two samples had completely lost their cancer-
specific expression for all genes. These could be samples
originally incorrectly annotated, or metastases that are
dedifferentiated to the extent that they have no resem-
blance to their original cancer type.
Discussion
Metastasis is an indicator of poor prognosis for any can-
cer patient, but the issue is even more difficult if the
primary tumor is unknown and the diagnosis has t o be
made solely based on the discovery of metastases. This
‘type’ of cancer is known as a cancer of unknown pri-
mary (CUP) and represents a condition requiring speci-
fic clinical attention. The origin of the metastasis needs
to be identified as primary treatment regimes for cancer
are typically based on the anatomical origin and histolo-
gical type of the primary tumor. Studies by several
groups [4-7,20] have shown that finding the tissue of
origin of metastatic samples is possible based on gene
expression data. Some of these tests are already com-
mercially available and have been clinically applied
[13- 15,17]. Most of the previously described approaches
are based on a fixed set of genes measured with a cus-
tom designed array, multiplexed PCR or other molecular
profiling assay. We sought to explore an approach
where one can algorithmically solve the tissue of origin
of the sample by comparing the whole genome expres-
sion profile of the sample to a large collection of refer-
ence data from the public domain, extracted from the
GeneSapiens database [23]. This approach has the
advantage of improving c onstantly as more data are
acquired and as algorithms are optimized. This also
allows more flexible customization of the molecular pro-
filing to determine things such as where the metastasis
originates from or whether the metastasis originates, for
example, from esophagus or lung.
We show here that the wAGEP method is capable of
identifying the tissue of origin of CUP samples with 89%
accuracy when excluding the most uncertain 30% of the
samples. If we, like some of the previously published
studies have done [5], categorize any intestinal tract
match as the correct classification for any tumor arising
from that anatomical location, the accuracy increases
substantially (by 26.7 to 33.3%). This is comparable to
or better than what is achieved by most of the known
methods, conside ring in particular the fact that we used
one of the widest search spaces (56 different cancer
types) compared to previous CUP s tudies [13-17]. The
method can be improved in a data-driven way by adding
more annotated reference data to the analysis. Thus, no
specific gene selection or assay development is needed.
Another key advantage of the wAGEP method is that it
is able to determine how reliable the classification was.
This would be helpful in a clinical setting when consid-
ering multiple treatment options for a patient in the
context of, for example, contradicting diagnos tic results
from various tests.
Pancreatic cancer is quite common as a source of
metastatic disease (between 25% and 12.5% of post-mor-
tem identified CUP cases [3]), and it is the most difficult
type of CUP tumor to identify using our method as well
as all published methods [13-17]. Pancreatic cancer is
often very poorly differentiated and progresses rapidly.
As the wAGEP method makes it possible to identify
the tissue similarity as well as the genes behind the
similarity, we were able to show which cancer-specific
genes lose their cancer of origin-specific expression in
metastatic samples (Figure 3). Even though each cancer
is unique and metastatic progression and evolution are
dependent on many variables, there were some systema-
tic changes. To an extent, metastases maintain a similar
transcriptomic program to that of the cancer of or igin.
This is reflected in the ability to identify the origin of
metastases with reference data on primary tumors, but
it is also visible at the level of i ndividual genes (Figure
3). Further studies are also needed to uncover systema-
tic changes in the transcriptomic program correlating
with the site of metastasis. There are multiple studies
indicating such changes, including in vivo mouse studies
[30]. However, the currently available datasets of in vivo
metastatic samples are still too few in number and size
to allow systematic studies of this subject
The ability to directly interpret expression profiles of
CUP tumors using a constantly increasing body of
scientific data and knowledge allows for a faster and
more economical way of providing more accurate diag-
nostics for CUP patients. This is essential as having
metastatic carcinoma of unknown origin is a difficult
situation for cancer patients; the average survival of
thesepatientsisonlyafewmonths[1].Applicationof
the proposed method needs a microarray-based expres-
sion profile from the metastasis, but several large hospi-
tals and institutions around the world have already
developed infrastructure for genomic and molecular
Ojala et al. Genome Medicine 2011, 3:63
/>Page 10 of 12
profiling of tumors. Also, microarray technology in gen-
eral is mature and, for example, Affymetrix genechips
have been found to be a clinically applicable and robust
platform [9-11,31-33]. Our method is Affymetrix-based,
but could equally well be adapted for other platforms.
Full genome microarray analyses of CUP patien ts, like
of any cancer patient, will also provide more informa-
tion than just the tissue of origin. As the poor survival
statistics of metastatic cancer patients show, CUP
patients would need more than just the identificati on of
the origin of metastasis. The wAGEP approach will pro-
vide data on the expression of all genes in the metastatic
tumor, including information on potentially important
subgroups or the expression of therapeutic targets that
couldbesimultaneouslyassessed. Tailored medication
based on these observations might prove to be a more
useful approach than the traditional approach of anat-
omy- and histology-based treatment regimes.
Conclusions
The wAGEP method proved to be good for classifying
CUP samples. More than that, however, it showed that
it was capable of finding and analyzing differences
between the metastasis samples and their primary can-
cer types, thus providing interesting information that
could have clinical significance. It is also not tied to any
predefined gene list, or indeed anything predefined. It is
fully scalable and able to adapt to new emerging scienti-
fic data.
Additional material
Additional file 1: An illustration of the method used to calculate
similarities between a test sample and the reference data. (a) The
weight of a gene for each cancer type in the reference data is calculated
by taking the area where the gene’s density estimate is higher than that
of any other cancer. Since the area under each density estimate is 1, the
resulting weights are numbers between 0 and 1. The weights are unique
for each cancer, and represent the ability of the gene’s expression to
distinguish that cancer from all others. (b) A schematic of the process for
calculating the similarity between a test sample and the reference data.
The AGEP procedure is modified by having the gene weights calculated
from the density estimates and applied to the ts-scores of the normal
AGEP result. Then, as per normal AGEP procedure, the tissue similarity for
the test sample and each cancer in the reference data is calculated by
averaging the now weighted ts-scores for that cancer.
Additional file 2: A summary of the reference data, the name of
each cancer type and the number of samples it has.
Additional file 3: Heatmap of all genes and all cancers used in the
analyses. Genes are colored according to their weight.
Additional file 4: GeneSapiens boxplot of the TMEM204 gene.
Additional file 5: Results for each individual test sample. Each
sample is annotated as accurately as possible, and the five highest
similarity scores and their corresponding cancer types are shown.
Additional file 6: A combination of the two images from Figure 2.
Similarities of 83 metastatic test samples. Displayed are the similarities to
the samples’ own cancer, the tissue where the metastasis was found and
a representative cancer of that tissue. The x-axis indicates the similarity of
the sample to its cancer of origin. On the y-axis, a sphere indicates
similarity to the healthy tissue where the metastasis was found. A
triangle indicates similarity to a representative cancer of that tissue. The
vertical lines are simply connectors for ease of visualization, indicating
which sphere and triangle represent the same sample. If the line is solid,
the test sample has a higher similarity to the cancer of the target tissue
than the target healthy tissue, and vice versa if the line is dashed. The
icons are colored based on the tissue where the metastasis was.
Abbreviations
AGEP: alignment of gene expression profiles; CUP: cancer of unknown
primary origin; GEO: Gene Expression Omnibus; GIST: gastrointestinal stromal
tumor; LOOCV: leave-one-out cross-validation; tm-score: tissue match score;
ts-score: tissue specificity score; wAGEP: weighted AGEP.
Acknowledgements
Academy of Finland (Centres of Excellence funding no. 213502), Cancer
Organizations of Finland Sigdrid Juselius Foundation (OPK) and personal
grants to SKK from Cancer Organizations of Finland and Helsinki University
funds.
Authors’ contributions
KAO designed the study, performed the majority of the work and wrote the
manuscript. SKK did the LOOCV validation part, provided ideas for the
project and participated in the writing of the manuscript. OPK supervised
the project. All authors have read and approved the manuscript for
publication.
Competing interests
KAO and SKK are inventors on a patent application regarding the original
AGEP method. SKK and OPK are shareholders in Medisapiens Ltd, which
develops microarray data analysis technologies.
Published: 17 October 2011
References
1. Pavlidis N, Fizazi K: Cancer of unknown primary (CUP). Crit Rev Oncol
Hematol 2005, 54:243-250.
2. American Cancer Society: Cancer Facts and Figures 2010 Atlanta, GA:
American Cancer Society; 2010.
3. Pavlidis N, Pentheroudakis G: Cancer of unknown primary site: 20
questions to be answered. Ann Oncol 2010, 21(Suppl 7):vii303-vii307.
4. Talantov D, Baden J, Jatkoe T, Hahn K, Yu J, Rajpurohit Y, Jiang Y, Choi C,
Ross JS, Atkins D, Wang Y, Mazumder A: A quantitative reverse
transcriptase-polymerase chain reaction assay to identify metastatic
carcinoma tissue of origin. J Mol Diagn 2006, 8:320-329.
5. Varadhachary GR, Talantov D, Raber MN, Meng C, Hess KR, Jatkoe T, Lenzi R,
Spigel DR, Wang Y, Greco FA, Abbruzzese JL, Hainsworth JD: Molecular
profiling of carcinoma of unknown primary and correlation with clinical
evaluation. J Clin Oncol 2008, 26:4442-4448.
6. Ma XJ, Patel R, Wang X, Salunga R, Murage J, Desai R, Tuggle JT, Wang W,
Chu S, Stecker K, Raja R, Robin H, Moore M, Baunoch D, Sgroi D,
Erlander M: Molecular classification of human cancers using a 92-gene
real-time quantitative polymerase chain reaction assay. Arch Pathol Lab
Med 2006, 130:465-473.
7. Tothill RW, Kowalczyk A, Rischin D, Bousioutas A, Haviv I, van Laar RK,
Waring PM, Zalcberg J, Ward R, Biankin AV, Sutherland RL, Henshall SM,
Fong K, Pollack JR, Bowtell DD, Holloway AJ: An expression-based site of
origin diagnostic method designed for clinical application to cancer of
unknown origin. Cancer Res 2005, 65:4031-4040.
8. Rosenfeld N, Aharonov R, Meiri E, Rosenwald S, Spector Y, Zepeniuk M,
Benjamin H, Shabes N, Tabak S, Levy A, Lebanony D, Goren Y,
Silberschein E, Targan N, Ben-Ari A, Gilad S, Sion-Vardy N, Tobar A,
Feinmesser M, Kharenko O, Nativ O, Nass D, Perelman M, Yosepovich A,
Shalmon B, Polak-Charcon S, Fridman E, Avniel A, Bentwich I, Bentwich Z,
et al: MicroRNAs accurately identify cancer tissue origin. Nat Biotechnol
2008, 26:462-469.
9. Shi L, Reid LH, Jones WD, Shippy R, Warrington JA, Baker SC, Collins PJ, de
Longueville F, Kawasaki ES, Lee KY, Luo Y, Sun YA, Willey JC, Setterquist RA,
Ojala et al. Genome Medicine 2011, 3:63
/>Page 11 of 12
Fischer GM, Tong W, Dragan YP, Dix DJ, Frueh FW, Goodsaid FM,
Herman D, Jensen RV, Johnson CD, Lobenhofer EK, Puri RK, Schrf U, Thierry-
Mieg J, Wang C, Wilson M, Wolber PK, et al: The MicroArray Quality
Control (MAQC) project shows inter- and intraplatform reproducibility of
gene expression measurements. Nat Biotechnol 2006, 24:1151-1161.
10. Shi L, Tong W, Fang H, Scherf U, Han J, Puri RK, Frueh FW, Goodsaid FM,
Guo L, Su Z, Han T, Fuscoe JC, Xu ZA, Patterson TA, Hong H, Xie Q,
Perkins RG, Chen JJ, Casciano DA: Cross-platform comparability of
microarray technology: intra-platform consistency and appropriate data
analysis procedures are essential. BMC Bioinformatics 2005, 6(Suppl 2):S12.
11. Tillinghast GW: Microarrays in the clinic. Nat Biotechnol 2010, 28:810-812.
12. Nimgaonkar A, Sanoudou D, Butte AJ, Haslett JN, Kunkel LM, Beggs AH,
Kohane IS: Reproducibility of gene expression across generations of
Affymetrix microarrays. BMC Bioinformatics 2003, 4:27.
13. Horlings HM, van Laar RK, Kerst JM, Helgason HH, Wesseling J, van der
Hoeven JJ, Warmoes MO, Floore A, Witteveen A, Lahti-Domenici J, Glas AM,
Van’t Veer LJ, de Jong D: Gene expression profiling to identify the
histogenetic origin of metastatic adenocarcinomas of unknown primary.
J Clin Oncol 2008, 26:4435-4441.
14. Dumur CI, Lyons-Weiler M, Sciulli C, Garrett CT, Schrijver I, Holley TK,
Rodriguez-Paris J, Pollack JR, Zehnder JL, Price M, Hagenkord JM, Rigl CT,
Buturovic LJ, Anderson GG, Monzon FA: Interlaboratory performance of a
microarray-based gene expression test to determine tissue of origin in
poorly differentiated and undifferentiated cancers. J Mol Diagn 2008,
10:67-77.
15. Monzon FA, Lyons-Weiler M, Buturovic LJ, Rigl CT, Henner WD, Sciulli C,
Dumur CI, Medeiros F, Anderson GG: Multicenter validation of a 1,550-
gene expression profile for identification of tumor tissue of origin. J Clin
Oncol 2009, 27:2503-2508.
16. Monzon FA, Medeiros F, Lyons-Weiler M, Henner WD: Identification of
tissue of origin in carcinoma of unknown primary with a microarray-
based gene expression test. Diagn Pathol 2010, 5:3.
17. van Laar RK, Ma XJ, de Jong D, Wehkamp D, Floore AN, Warmoes MO,
Simon I, Wang W, Erlander M, van’t Veer LJ, Glas AM: Implementation of a
novel microarray-based diagnostic test for cancer of unknown primary.
Int J Cancer 2009, 125:1390-1397.
18. Perou CM, Sorlie T, Eisen MB, van de Rijn M, Jeffrey SS, Rees CA, Pollack JR,
Ross DT, Johnsen H, Akslen LA, Fluge O, Pergamenschikov A, Williams C,
Zhu SX, Lonning PE, Borresen-Dale AL, Brown PO, Botstein D: Molecular
portraits of human breast tumours. Nature 2000, 406:747-752.
19. Soda M, Choi YL, Enomoto M, Takada S, Yamashita Y, Ishikawa S, Fujiwara S,
Watanabe H, Kurashina K, Hatanaka H, Bando M, Ohno S, Ishikawa Y,
Aburatani H, Niki T, Sohara Y, Sugiyama Y, Mano H: Identification of the
transforming EML4-ALK fusion gene in non-small-cell lung cancer. Nature
2007, 448:561-566.
20. Staub E, Buhr HJ, Grone J: Predicting the site of origin of tumors by a
gene expression signature derived from normal tissues. Oncogene 2010,
29:4485-4492.
21. Edgar R, Domrachev M, Lash AE:
Gene Expression Omnibus: NCBI gene
expression and hybridization array data repository. Nucleic Acids Res 2002,
30:207-210.
22. Kilpinen SK, Ojala KA, Kallioniemi OP: Alignment of gene expression
profiles from test samples against a reference database: New method
for context-specific interpretation of microarray data. BioData Min 2011,
4:5.
23. Kilpinen S, Autio R, Ojala K, Iljin K, Bucher E, Sara H, Pisto T, Saarela M,
Skotheim RI, Bjorkman M, Mpindi JP, Haapa-Paananen S, Vainio P, Edgren H,
Wolf M, Astola J, Nees M, Hautaniemi S, Kallioniemi O: Systematic
bioinformatic analysis of expression levels of 17,330 human genes
across 9,783 samples from 175 types of healthy and pathological
tissues. Genome Biol 2008, 9:R139.
24. Autio R, Kilpinen S, Saarela M, Kallioniemi O, Hautaniemi S, Astola J:
Comparison of Affymetrix data normalization methods using 6,926
experiments across five array generations. BMC Bioinformatics 2009,
10(Suppl 1):S24.
25. R Development Core Team: R: A Language and Environment for Statistical
Computing Vienna, Austria: R Foundation for Statistical Computing; 2007.
26. Kilpinen S, Ojala K: R AGEP Library.[ />27. Jones S, Zhang X, Parsons DW, Lin JC, Leary RJ, Angenendt P, Mankoo P,
Carter H, Kamiyama H, Jimeno A, Hong SM, Fu B, Lin MT, Calhoun ES,
Kamiyama M, Walter K, Nikolskaya T, Nikolsky Y, Hartigan J, Smith DR,
Hidalgo M, Leach SD, Klein AP, Jaffee EM, Goggins M, Maitra A, Iacobuzio-
Donahue C, Eshleman JR, Kern SE, Hruban RH, et al: Core signaling
pathways in human pancreatic cancers revealed by global genomic
analyses. Science 2008, 321:1801-1806.
28. Okamura N, Masuda T, Gotoh A, Shirakawa T, Terao S, Kaneko N,
Suganuma K, Watanabe M, Matsubara T, Seto R, Matsumoto J, Kawakami M,
Yamamori M, Nakamura T, Yagami T, Sakaeda T, Fujisawa M, Nishimura O,
Okumura K: Quantitative proteomic analysis to discover potential
diagnostic markers and therapeutic targets in human renal cell
carcinoma. Proteomics 2008, 8:3194-3203.
29. Perroud B, Ishimaru T, Borowsky AD, Weiss RH: Grade-dependent
proteomics characterization of kidney cancer. Mol Cell Proteomics 2009,
8:971-985.
30. Kang Y, Siegel PM, Shu W, Drobnjak M, Kakonen SM, Cordon-Cardo C,
Guise TA, Massague J: A multigenic program mediating breast cancer
metastasis to bone. Cancer Cell 2003, 3:537-549.
31. Jarvinen AK, Hautaniemi S, Edgren H, Auvinen P, Saarela J, Kallioniemi OP,
Monni O: Are data from different gene expression microarray platforms
comparable? Genomics 2004, 83:1164-1168.
32. Barnes M, Freudenberg J, Thompson S, Aronow B, Pavlidis P: Experimental
comparison and cross-validation of the Affymetrix and Illumina gene
expression analysis platforms. Nucleic Acids Res 2005, 33:5914-5923.
33. Ioannidis JP, Allison DB, Ball CA, Coulibaly I, Cui X, Culhane AC, Falchi M,
Furlanello C, Game L, Jurman G, Mangion J, Mehta T, Nitzberg M, Page GP,
Petretto E, van Noort V: Repeatability of published microarray gene
expression analyses. Nat Genet 2009, 41:149-155.
doi:10.1186/gm279
Cite this article as: Ojala et al.: Classification of unknown primary
tumors with a data-driven method based on a large microarray
reference database. Genome Medicine 2011 3:63.
Submit your next manuscript to BioMed Central
and take full advantage of:
• Convenient online submission
• Thorough peer review
• No space constraints or color figure charges
• Immediate publication on acceptance
• Inclusion in PubMed, CAS, Scopus and Google Scholar
• Research which is freely available for redistribution
Submit your manuscript at
www.biomedcentral.com/submit
Ojala et al. Genome Medicine 2011, 3:63
/>Page 12 of 12