Contaminated Ground Water and Sediment - Chapter 4 potx
Bạn đang xem bản rút gọn của tài liệu. Xem và tải ngay bản đầy đủ của tài liệu tại đây (1.87 MB, 82 trang )
4
Modeling Fate and
Transport of Chlorinated
Organic Compounds
in the Subsurface
prepared by Brent E. Sleep
with contributions by
Neal D. Durant, Charles R. Faust,
Joseph G. Guarnaccia, Mark R. Harkness,
Jack C. Parker, Lily Sehayek
CONTENTS
4.1Introduction and Overview
4.2Basic Concepts and Equations
4.2.1Multiphase Fluid Flow
4.2.1.1Darcy’s Law for Multiphase Flow
4.2.1.2Capillary Pressure and Relative Permeability Relations
4.2.2Multicomponent Mass Transport
4.2.2.1Mass Balance and Transport Flux Equations
4.2.2.2Interphase Mass Transfer
4.2.3Modeling Biotic and Abiotic Transformations
4.2.3.1Review of Chlorinated Solvent
Transformation Mechanisms
4.2.3.2Petroleum Hydrocarbon Biodegradation Models
4.2.3.3Chlorinated Solvent Biodegradation Models
4.2.4Computational Issues
4.2.4.1Spatial Discretization
4.2.4.2Temporal Discretization
4.2.4.3Linearization of Nonlinear Equations of Multiphase
Flow and Transport
4.2.4.4Solution of Linear Equations
4.3Modeling DNAPLs — State of Practice
4.3.1Roles of Modeling
4.3.1.1Research and Education
L1667_book.fm Page 179 Tuesday, October 21, 2003 8:33 AM
©2004 CRC Press LLC©2004 CRC Press LLC
Appendix A:
Workshop Panels
PANEL 1
MIXING ZONE: DISCHARGE OF CONTAMINATED
GROUND WATER INTO SURFACE WATER BODIES
E
XPERT
P
ANEL
L
EADER
Miguel A. Medina, Jr., Duke University
A
SSISTANT
E
XPERT
P
ANEL
L
EADER
Nancy R. Grosso, DuPont Company
E
XPERT
P
ANEL
M
EMBERS
Robert L. Doneker, Oregon Graduate Institute of Science and Technology
Henk Haitjema, Indiana University
D. Michael Johns, Windward Environmental LLC
Wu-Seng Lung, University of Virginia
Steven C. McCutcheon, USEPA National Exposure Research Laboratory
Farrukh Mohsen, Gannett Fleming, Inc.
Aaron I. Packman, Northwestern University
Philip J. Roberts, Georgia Institute of Technology
J. Bart Ruiter, DuPont Company
PANEL 2
CONTAMINATED SEDIMENT: ITS FATE AND
TRANSPORT
E
XPERT
P
ANEL
L
EADER
Danny D. Reible, Louisiana State University
A
SSISTANT
E
XPERT
P
ANEL
L
EADER
Richard H. Jensen, DuPont Company
L1667_book.fm Page 259 Tuesday, October 21, 2003 8:33 AM
©2004 CRC Press LLC
E
XPERT
P
ANEL
M
EMBERS
Sam Bentley, Louisiana State University
Mimi B. Dannel, USEPA Headquarters
Joseph V. DePinto, Limno-Tech, Inc.
James A. Dyer, DuPont Company
Kevin J. Farley, Manhattan College
Marcelo H. Garcia, University of Illinois
David Glaser, Quantitative Environmental Analysis
John M. Hamrick, Tetra Tech, Inc.
Wilbert J. Lick, University of California at Santa Barbara
Robert A. Pastorok, Exponent Environmental Group
Richard F. Schwer, DuPont Company
C. Kirk Ziegler, Quantitative Environmental Analysis
PANEL 3
OPTIMIZATION MODELING FOR REMEDIATION
AND MONITORING
E
XPERT
P
ANEL
L
EADER
George F. Pinder, University of Vermont
A
SSISTANT
E
XPERT
P
ANEL
L
EADER
Robert B. Genau, DuPont Company
E
XPERT
P
ANEL
M
EMBERS
Robert M. Greenwald, GeoTrans, Inc.
Hugo A. Loaiciga, University of California at Santa Barbara
George P. Karatzas, Technical University of Crete
Peter K. Kitanidis, Stanford University
Reed M. Maxwell, Lawrence Livermore National Laboratory
Alexander S. Mayer, Michigan Technological University
Dennis B. McLaughlin, Massachusetts Institute of Technology
Richard C. Peralta, U.S. Air Force Reserve and Utah State University
Christine A. Shoemaker, Cornell University
Brian J. Wagner, U.S. Geological Survey
Kathleen M. Yager, USEPA Technology Innovation OfÞce
William W G. Yeh, University of California at Los Angeles
L1667_book.fm Page 260 Tuesday, October 21, 2003 8:33 AM
©2004 CRC Press LLC
PANEL 4
SIMULATION OF HALOGENATED HYDROCARBONS
IN THE SUBSURFACE
E
XPERT
P
ANEL
L
EADER
Charles R. Faust, GeoTrans, Inc.
A
SSISTANT
E
XPERT
P
ANEL
L
EADERS
Neal D. Durant, GeoTrans, Inc.
Craig L. Bartlett, DuPont Company
E
XPERT
P
ANEL
M
EMBERS
Robert C. Borden, North Carolina State University
Ronald J. Buchanan, Jr., DuPont Company
Randall Charbeneau, University of Texas
Eva L. Davis, USEPA Kerr Laboratory
Joseph G. Guarnaccia, CIBA-Geigy Specialty Chemicals
Mark R. Harkness, General Electric Corporation
Jack C. Parker, Oak Ridge National Laboratory
Hanadi Rafai, University of Houston
Lily Sehayek, Penn State Great Valley
Brent E. Sleep, University of Toronto
Jon F. Sykes, University of Waterloo
Albert J. Valocchi, University of Illinois
L1667_book.fm Page 261 Tuesday, October 21, 2003 8:33 AM
©2004 CRC Press LLC
4.3.1.2Policy Development
4.3.1.3Site Assessment and Remedial Design
4.3.2Overview of Existing Models
4.3.2.1Three-Phase Models
4.3.2.2Two-Phase Models
4.3.2.3Single-Phase Models
4.3.2.4Chlorinated Solvent Biodegradation Models
4.3.3Model Selection and Limitations
4.4Site Applications
4.4.1Gulf Coast EDC DNAPL Release
4.4.2DNAPL Source Area Characterization Coastal Plain of New Jersey
4.5Research Needs
4.5.1Constitutive Relationships for Multiphase Flow, Transport,
and Interphase Mass Transfer
4.5.1.1k–S–P Relationships
4.5.1.2Mass Transfer Relationships
4.5.1.3Summary
4.5.2DNAPLs In Fractured Media
4.5.2.1Unsaturated Water Flow
4.5.2.2NAPLs
4.5.2.3Summary
4.5.3Impact of Biodegradation on DNAPL Dissolution
4.5.3.1Model Development
4.5.3.2Reductive Dechlorination Rates at High
Concentrations of Dissolved PCE
4.5.3.3Reductive Dechlorination in the Presence of DNAPL
4.5.3.4Summary
4.5.4Plume Attenuation
4.5.4.1Biotransformation Kinetics
4.5.4.2Halorespiration
4.5.4.3Spatial Variability in Redox Conditions
4.5.4.4Complex Mixtures
4.5.4.5Bioavailability and Mass Transfer from Sorbed Phase
4.5.4.6Summary
4.6Technology Transfer
4.6.1Approach
4.6.1.1QA Standards
4.6.1.2Expert Decision Support System
4.6.1.3Model Application Archive and Database Support
4.6.1.4Training Support
4.6.2Implementation Recommendations
4.7Summary, Conclusions, and Recommendations
4.7.1Multiphase Flow and Transport
4.7.2Chlorinated Hydrocarbon Biodegradation
4.7.3Technology Transfer
L1667_book.fm Page 180 Tuesday, October 21, 2003 8:33 AM
©2004 CRC Press LLC
Acknowledgments
References
4.1 INTRODUCTION AND OVERVIEW
Halogenated organic compounds such as chlorinated aliphatic and aromatic com-
pounds have been used widely as solvents since the early 1940s. As a result of
widespread production, transportation, use, and disposal, these compounds are com-
mon ground water contaminants. Due to their limited but environmentally signiÞcant
aqueous phase solubilities, spills of these compounds typically result in the formation
and migration of a separate organic phase that is denser than water. This dense
nonaqueous phase liquid (DNAPL) can move signiÞcant distances in the subsurface,
contaminating large volumes of the subsurface environment. The residual DNAPL
left in the wake of DNAPL ßow can persist as a source of contamination for decades,
slowly dissolving into the water phase and volatilizing into the soil–gas phase in
the vadose zone.
Chlorinated organic compounds are among the most serious ground water con-
taminants because of their mobility and persistence in the subsurface, their wide-
spread use, and their health effects. Consequently, billions of dollars are being spent
in efforts to remediate ground water contamination from chlorinated organic com-
pounds. Developing and applying reliable, accurate, and readily available fate and
transport models is greatly needed to assess the risks posed by spills of these
compounds to the subsurface and to aid in evaluating and designing remediation
programs to address these spills. A variety of sophisticated research level models to
predict chlorinated organic compound fate and transport in the subsurface have been
developed. The use of these models is limited, however, due to mathematical com-
plexity, signiÞcant data demands, and the inability to validate the many assumptions
inherent in these models. Research on the physics, chemistry, and biology of these
compounds and the prediction of their fate and transport in a complex, heterogeneous
subsurface is ongoing, with many questions yet to be answered.
The panel discussed issues associated with simulating chlorinated organic com-
pound behavior in the subsurface. Presentations by panel members focused on
modeling chlorinated organic compound fate and transport under natural conditions
rather than under enhanced remediation conditions. The uncertainty associated with
constitutive relationships appropriate for use in Þeld-scale modeling was identiÞed
as an area for continued research. Aspects of modeling DNAPL source dissolution
and volatilization were covered, and practical techniques for modeling source-term
behavior at the Þeld scale were presented. The problems of dealing with subsurface
heterogeneities in simulating Þeld-scale DNAPL behavior were identiÞed, and the
need for upscaling methods and robust inverse modeling techniques were empha-
sized. Several presentations addressed the current practices for modeling the natural
attenuation of chlorinated compounds. Chlorinated compound biodegradation mod-
els of varying levels of complexity were reviewed. The need for a framework for
choosing the appropriate level of simpliÞcation in modeling was discussed, and the
need for technology transfer to end users of models was emphasized.
L1667_book.fm Page 181 Tuesday, October 21, 2003 8:33 AM
©2004 CRC Press LLC
The objective of this chapter is to review the state of the art with respect to
the simulation of chlorinated organic compounds in the subsurface and to present
the conclusions and recommendations of the panel with respect to basic research
needs and issues of technology transfer. Basic concepts and equations underlying
models for chlorinated organic compound behavior in the subsurface are reviewed
in Section 4.2. The current state of practice with respect to modeling chlorinated
organic compound fate and transport is described in Section 4.3. Section 4.4
contains Þeld applications presented by the panel. Research needs identiÞed by
the panel are discussed in Section 4.5, while Section 4.6 examines aspects of
technology transfer required for the effective promulgation of simulation models
for chlorinated organic compounds.
4.2 BASIC CONCEPTS AND EQUATIONS
Halogenated organic compounds exhibit a broad range of physical and chemical
properties. Those of particular concern as ground water contaminants include indus-
trial solvents, such as tetrachloroethylene (also known as perchloroethylene or PCE),
trichloroethylene (TCE), and carbon tetrachloride (CT), and a variety of polychlo-
rinated biphenyl (PCB) oils used in various industrial applications (Pankow and
Cherry, 1996). These compounds are liquids at normal subsurface temperatures and
have limited solubility in water and speciÞc gravities greater than water. They thus
fall under the deÞnition of DNAPLs (Schwille, 1988). The speciÞc gravity of chlo-
rinated aliphatic hydrocarbons can be as high as 1.6 (Mercer and Waddell, 1993).
Low solubility and relatively high density are key properties that lead to the com-
plexity of their distribution in the subsurface. In this section, these and other impor-
tant factors are discussed.
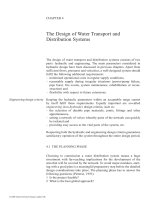
The transport and fate of halogenated organic compounds in the subsurface are
controlled by complex phenomena in a wide variety of hydrologic settings. Halo-
genated organic compounds can occur as a nonaqueous phase liquid (NAPL) and
as species in the aqueous, vapor, and soil phases (Figure 4.1). The phenomena that
govern the behavior of halogenated organic compounds in the subsurface can be
classed into two broad categories that control the following:
• Fluid-phase distributions and bulk ßow of NAPL, water, and vapor phases
in the subsurface as affected by gravity, capillary and buoyancy forces,
pore geometry, and larger-scale heterogeneity
• Interphase mass transfer, transport, and attenuation of halogenated com-
pounds and their by-products through dissolution, volatilization, sorp-
tion/desorption, colloidal transport, diffusion–dispersion, and chemical
and biological reactions
In general, modeling halogenated organic compounds involves simulating sub-
surface systems composed of more than one ßuid phase and requires a conceptual
understanding of the relevant chemical, physical, and biological processes that con-
trol the distributions, interactions, and reactions within all phases.
L1667_book.fm Page 182 Tuesday, October 21, 2003 8:33 AM
©2004 CRC Press LLC
Mathematical models for multiphase migration of organic contaminants in soils
and aquifers were presented by numerous authors beginning in the 1980s (e.g.,
Abriola and Pinder, 1985; Faust, 1985; Osborne and Sykes, 1986; Kuppusamy et
al., 1987; Faust et al., 1989; Sleep and Sykes, 1989, 1993) based on earlier models
developed for petroleum reservoir engineering (Aziz and Settari, 1979).
4.2.1 M
ULTIPHASE
F
LUID
F
LOW
4.2.1.1 Darcy’s Law for Multiphase Flow
When an organic ßuid enters the subsurface, it ßows downward due to gravity and
capillary forces and moves laterally due to capillary forces. In the vadose zone, the
organic displaces the air and water as it moves through the soil pores. DNAPLs can
move below the water table, whereas LNAPLs pool on the water table. Below the
water table, a DNAPL displaces the water phase as it moves downward. The move-
ment of the organic phase through the soil pores is affected by the organic ß uid
density, viscosity, interfacial tension with water and air, contact angle of the phase
interface with the aquifer solids (i.e., wettability), and by the soil porosity, perme-
ability, and pore-size distribution. The inßuence of these factors is manifested in the
following generalized form of Darcy’s law that can be used to describe continuum
level multiphase ßow in porous media:
(4.1)
FIGURE 4.1
Fate and transport of chlorinated organic compound releases in the subsurface.
Ground Water
Flow
DNAPL Vapor
DNAPL Release
Dissolved DNAPL Plume
Residual DNAPL
Low-permeability layer
DNAPL Pool
DNAPL
q
k
Pgz
r
b
b
b
bb
m
r=- — + —
()
k
L1667_book.fm Page 183 Tuesday, October 21, 2003 8:33 AM
©2004 CRC Press LLC
In this equation,
q
b
is the Darcy velocity of phase
b (b
= g
for gas,
w
for water,
and
n
for NAPL)
,
k
r
b
is the relative permeability of phase
b,
k
is the intrinsic
permeability tensor
, m
b
is the viscosity of phase
b,
P
b
is the phase pressure,
r
b
is the
phase mass density,
g
is the gravitational acceleration constant, and
z
is the elevation.
Intrinsic permeability is so called because it is generally assumed to be an
inherent characteristic of the porous medium. This assumption is usually valid in
coarse-grained media but can be a poor assumption in certain cases in which inter-
actions between ßuids and soil grains result in temporal changes in the pore structure
or if the porosity or pore structure are affected by changes in pore pressure (e.g.,
consolidation, shrink-swell, hydraulic fracturing). Although in most applications
permeability is assumed to be constant over time for a given porous medium, in
certain cases consideration of possible relationships to present or historical phase
pressures or species concentrations may be necessary for accurate predictions. The
tensorial nature of permeability reßects anisotropy that may develop due to a non-
random spatial orientation of the pore structure or ßuid distributions or of larger
scale heterogeneities (e.g., fractures, layering).
Fluid densities vary as a function of respective ßuid pressures. For liquids
subjected to small pressure variations, ßuid compressibility can often be safely
disregarded. Gas-phase compressibility is signiÞcantly greater than that of liquids,
and, if gas ßow is modeled, compressibility should be considered. Gas compress-
ibility can be easily modeled based on ideal gas theory. Density effects may be
signiÞcant in the vapor transport of dense volatile organics in permeable porous
media (Sleep and Sykes, 1989).
The mobility of NAPLs is inßuenced by viscosity. Less viscous NAPLs tend to
migrate farther and more rapidly than others (Cohen and Mercer, 1993). Capillary
pressures (i.e., the pressure differences between phases) are related to interfacial
tension between the phases, wettability, and pore geometry. Decreases in interfacial
tension or increases in contact angle decrease capillary pressures between phases
for a given pore geometry. Decreases in interfacial tension or increases in contact
angle thus decrease entry pressures for nonwetting phases into Þne-grained media,
increasing the mobility of the nonwetting phase.
In general, ßuid density, viscosity, and interfacial tensions vary as functions of
temperature and phase composition (Ma and Sleep, 1997). In isothermal, noncompo-
sitional models, the dependence of ßuid properties on temperature and ßuid compo-
sition and their temporal and spatial variations are disregarded. However, where these
effects are expected to be signiÞcant, they should be taken into account. Temperature
effects on these properties are well understood, and mixture theories exist to compute
compositional effects. In cases where the effects of surfactants may be under consid-
eration, speciÞc experimental studies are required to characterize the behavior.
4.2.1.2 Capillary Pressure and Relative Permeability Relations
In multiphase systems, pressure differences (i.e., capillary pressures) exist between
phases as a result of interfacial tension between phases and curvature of the phase
interfaces. The capillary pressure across a curved interface with principal radii
r
1
and
r
2
is given by the following Laplace–Young Equation (Hunter, 1991):
L1667_book.fm Page 184 Tuesday, October 21, 2003 8:33 AM
©2004 CRC Press LLC
(4.2)
where
p
≤
and
p
¢
are pressures on opposite sides of the interface. The principal radii
for an interface in a soil pore are related to pore shape, the location of the phase
interface in the pore, and the contact angle between the phase interface and the
aquifer solids.
The contact angle, measured through the denser ßuid, is determined by the
chemical nature of the ßuids and the solid. Wetting ßuids have contact angles
less than 90°, while nonwetting ßuids have contact angles greater than 90°. In
the vadose zone, liquids (i.e., NAPLs or water) are usually wetting ßuids com-
pared with air. In the saturated zone, most natural porous media are strongly
water-wet (Anderson, 1986); the exception may be when signiÞcant quantities of
natural organic matter, graphite, silicates, and many sulÞdes are present in the
porous medium. When determining the wettability of multiphase systems con-
taining NAPLs, several factors should be considered, including water chemistry,
NAPL chemical composition, presence of natural organic matter, presence of
other agents (e.g., surfactants), aquifer saturation history, and mineral composi-
tion of the porous medium.
For a three-phase (i.e., gas, water, NAPL) system, water is usually the most
wetting phase, gas the least wetting, and NAPL the intermediate (Parker et al., 1987).
The physically relevant capillary pressures are thus:
p
gn
= p
g
–
p
n
(4.3a)
p
nw
= p
n
–
p
w
(4.3b)
where subscripts
g
,
w
, and
n
designate gas, water, and NAPL, respectively. For
monotonically changing ßuid saturations, the gas–NAPL interface curvature, and,
thus, the gas–NAPL capillary pressure, is expected to be a function of gas-phase
saturation. The gas-phase saturation controls gas-relative permeability. Similarly,
NAPL–water capillary pressure is expected to be a function of water saturation,
which controls water-relative permeability.
Various mathematical functions have been proposed to describe ßuid satura-
tion–capillary pressure (k–S–P) relationships for two-phase and three-phase ßuid
systems (Aziz and Settari, 1979; Corey, 1986; Parker et al., 1987). For example, for
a two-phase NAPL–water system, the Brooks–Corey relationship for NAPL–water
capillary pressure is as follows:
(4.4a)
(4.4b)
ppp
rr
c
=
¢¢
-
¢
=+
È
Î
Í
ù
û
ú
g
11
12
S
p
p
for p p
ew
dow
cow
cow
dow
=
Ê
Ë
Á
ˆ
¯
˜
>
l
S for p p
ew cow
dow
==1
L1667_book.fm Page 185 Tuesday, October 21, 2003 8:33 AM
©2004 CRC Press LLC
where
S
ew
is the effective water saturation calculated from the water saturation,
S
w
;
the maximum water saturation,
S
m
;
and the irreducible water saturation,
S
wr
:
(4.5)
where
p
dow
is the entry or bubbling pressure for the nonwetting (i.e., NAPL) phase,
and
l
is an empirical constant termed the pore size index. In contrast, Lenhard
and Parker (1987) used relationships based on the following van Genuchten (1980)
formulation:
(4.6)
where
a
,
m
, and
n
are empirical parameters. It should be noted that the
Brooks–Corey model incorporates a distinct entry pressure for the onset of non-
wetting-phase displacement of the wetting phase, whereas the van Genu-
chten–based model does not.
As ß uid saturations change in multiphase systems, the relative permeability of
the phase changes. Stone (1973) proposed a method for computing three-phase
relative permeabilities from measured two-phase air–NAPL and NAPL–water rela-
tive permeabilities assuming the water relative permeability to be a function of water
saturation only, air relative permeability to be a function of air saturation only, and
NAPL relative permeability to be a function of air and water saturations. Relative
permeability expressions based on ßuid saturations and the parameters from the
capillary pressure saturation relationships also have been developed for the
Brooks–Corey relationship by using the Burdine (1953) pore size distribution model
by integrating the capillary pressure saturation relationships over the range of allow-
able saturations. The Mualem (1976) model was used with the van Genuchten model
to develop corresponding relative permeability expressions. For given organic-phase
saturations, the Burdine relative permeability is always smaller than the Mualem
relative permeability (Oostrom and Lenhard, 1998).
Oostrom and Lenhard (1998) compared results from one-dimensional column
LNAPL inÞltration experiments with predictions of a simulator by using the
Brooks–Corey and the van Genuchten models. They found that the Brooks–Corey
model gave a better match to experimental data than did the van Genuchten model.
This match was attributed to the Þnite entry pressure of the Brooks–Corey model
as well as to differences in the relative permeability expressions associated with
the two models.
Direct measurement of three-phase k–S–P relations is difÞcult and tedious, and
three-phase relations are generally predicted theoretically from two-phase data.
Relative permeabilities are seldom measured but are predicted using the parameters
determined from capillary pressure saturation measurements. Leverett (1941) was
the Þrst to propose that three-phase air–NAPL–water k–S–P functions could be
predicted from two-phase relationships (i.e., air–NAPL and NAPL–water functions)
S
SS
SS
ew
wwr
mwr
=
-
-
Sp
ew cow
n
m
=+
()
[]
-
1 a
L1667_book.fm Page 186 Tuesday, October 21, 2003 8:33 AM
©2004 CRC Press LLC
assuming ßuid wettability in the order of water > NAPL > air such that NAPL occurs
as Þlms between water and gas phases. Similar arguments supported by experimental
data suggest that water saturation may be regarded as a function of NAPL–water
capillary pressure only and air saturation may be regarded as a function of air–NAPL
capillary pressure. Furthermore, two-phase S–P functions for different ßuids should
be scalable by the respective ßuid–ßuid interfacial tensions. Parker et al. (1987)
presented a method for estimating three-phase relations from two-phase air–water
capillary pressure–saturation data using a scaling approach air–water and
NAPL–water interfacial tension data.
The Leverett (1941) scaling approach used by Parker et al. (1987) assumes
that the spreading coefÞcients for the systems are zero. The spreading coefÞcient,
S, is calculated from the interfacial tensions between the phases (Oren and Pinc-
zewski, 1995):
S =
s
aw
–
s
an
–
s
nw
(4.7)
where
s
aw
,
s
an
, and
s
nw
are the air–water, air–NAPL, and NAPL–water interfacial
tensions, respectively. Some NAPLs have positive spreading coefÞcients, whereas
others, including many chlorinated solvents, have negative spreading coefÞcients.
For those with positive spreading coefÞcients, the organic phase forms a Þlm
between the air and the water phases in a three-phase system, resulting in a system
that effectively has a spreading coefÞcient of zero (Oren and Pincewski, 1995).
The existence of this Þlm has important implications for residual NAPL saturations
in three-phase systems.
For NAPLs with negative spreading coefÞcients, discontinuities in the NAPL
phase may be more pronounced in three-phase systems, leading to higher residual
NAPL saturations in the vadose zone (Zhou and Blunt, 1997). Hofstee et al. (1997)
found that Leverett scaling could be applied only to a small portion of water–PCE–air
retention curves. Below a critical PCE saturation, the total liquid content appeared
to become a function of the capillary pressure across the air–water interface rather
than a function of capillary pressure across the air–PCE interface as implied by
Leverett scaling. Below the critical saturation, PCE breakup into microlenses was
observed. These microlenses constituted a signiÞcant fraction of the PCE saturation,
resulting in higher residual PCE saturations than would be expected for spreading
NAPLs (Hofstee et al., 1997).
When subjected to nonmonotonic saturation histories, relative permeability vs.
saturation and capillary pressure vs. saturation functions exhibit signiÞcant hysteresis.
This is especially signiÞcant for NAPL due in part to the occurrence of residual NAPL
that has been hydraulically immobilized as occluded blobs or disconnected Þlms
induced by incomplete NAPL displacement by water or air. Hysteresis in two-phase
systems has been studied extensively, and reasonably reliable models have been
developed to predict two-phase hysteric functions from primary drainage and imbi-
bition path measurements (e.g., Mualem, 1974; Gillham et al., 1976; Scott et al.,
1983; Kool and Parker, 1987). However, whereas only 2 directions of saturation
change are possible in two-phase systems (i.e., wetting-phase drainage or imbibition),
12 path directions are possible in three-phase systems (i.e., IID, IDI, IDD, DII, DID,
L1667_book.fm Page 187 Tuesday, October 21, 2003 8:33 AM
©2004 CRC Press LLC
DDI, CDI, CID, ICD, DCI, IDC, and DIC), where I, D, and C designate imbibition,
drainage, and constant saturation, respectively, of water, NAPL, and air (Saraf et al.,
1982). This complexity effectively precludes characterizing three-phase hysteretic
k–S–P functions based solely on direct experimental observations and requires pre-
dictive models to be quite complicated to handle all circumstances properly.
Mathematical models for hysteretic three-phase k–S–P relations have been pre-
sented for petroleum reservoir applications by Evrenos and Comer (1969) and
Killough (1976). Parker et al. (1987), Lenhard and Parker (1987), Lenhard et al.
(1989), and Guarnaccia et al. (1997) presented relationships of environmental interest
based on the van Genuchten model. These models involve Þve parameters to describe
the main air–water drainage and imbibition S–P functions (including maximum
residual water and air saturations), two ßuid-dependent scaling factors, and two
additional residual saturations. The Parker–Lenhard model considers the maximum
residual NAPL saturation for displacement by water and the maximum residual air
saturation for displacement by NAPL. Residual NAPL caused by displacement by
air is not considered. The Guarnaccia model considers residual NAPL saturations
caused by displacement by water or air. Air entrapment is assumed to be the same
for displacement by water or NAPL.
Hysteresis in k–S–P relations introduces a signiÞcant degree of complexity
and uncertainty to the characterization of three-phase ßow. Incorporating hysteresis
into multiphase ßow models increases programming complexity. The need to
change k–S–P curves with reversals between drainage and imbibition creates
instabilities in nonlinear iterations of these models, often requiring small time
steps to be resolved.
4.2.2 M
ULTICOMPONENT
M
ASS
T
RANSPORT
4.2.2.1 Mass Balance and Transport Flux Equations
The general macroscopic mass balance equation for species
a
within phase
b
(=
g
for gas,
w
for water,
n
for NAPL) may be written as follows:
(4.8)
where
f
is porosity,
S
b
is phase saturation,
r
b
is phase molar density,
X
ab
is the
mole fraction of species
a
in phase
b
,
q
b
is the Darcy velocity for phase
b
described by Equation 4.1
,
J
ab
is the diffusive–dispersive mass ßux for species
a
in phase
b,
r
ab
is the net mass transfer of species
a
to (positive) or from
(negative) phase
b
, and
G
ab
represents the net sources (or sinks if negative) for
species a representing internal reactions and external sources/sinks. A mass
balance for the adsorbed phase, assuming no transport in the adsorbed phase,
may be written as follows:
(4.9)
∂
∂
()
+—∑
()
+—∑
()
++ =
t
SX Xq SJ rfr r f
bb ab b abb bbab ab ab
G 0
∂
∂
-
()
++ =
t
Xr
ssss
rf
aaa
()10G
L1667_book.fm Page 188 Tuesday, October 21, 2003 8:33 AM
©2004 CRC Press LLC
where X
as
is the adsorbed mass per mass of solids, r
s
is the density of soil solids,
and r
as
and
G
as
are mass transfer rates and source/sink terms for the adsorbed phase.
Equations 4.8 and 4.9 are subject to the following physical constraints:
(4.10a)
(4.10b)
(4.10c)
where the summations are over the indicated phases or chemical species.
It is often assumed that the porous medium is incompressible and, hence, that
porosity is temporally invariant. However, in certain situations, it may be warranted
to regard porosity as a function of ßuid pressure and/or temperature (e.g., case
relevant compressibility or thermal expansion coefÞcients would be required). The
dispersive–diffusive ßux is described by the following:
(4.11)
where D
ab
is the diffusion–dispersion tensor with components commonly deÞned
by the following:
(4.12)
where a
L
and a
T
are the longitudinal and transverse dispersivities, respectively; q
bi
and q
bj
are components of the Darcy velocity; d
ij
is the Kronecker delta; is the
molecular diffusion coefÞcient; and t
b
is a tortuosity factor.
4.2.2.2 Interphase Mass Transfer
The interphase transfer of organic mass occurs by several processes (Figure 4.1),
including NAPL dissolution, NAPL volatilization, and partitioning between water
and adsorbed phases and water and gas phases. The simplest approach to phase
partitioning is to assume local equilibrium between phases. In this case, the concen-
tration in a given phase can be written as a function of the concentration in another
phase multiplied by a partitioning coefÞcient. Typically, for sparingly soluble organic
compounds such as the chlorinated organics, Henry’s law is used for equilibrium
partitioning between the water and the gas phases, and Raoult’s law is used for
S
gwn
b
b=
Â
=
,,
1
r
sgwn
ab
b=
Â
=
,, ,
0
X
ab
a
Â
= 1
JDX
ab b ab ab
r=- ∑ —
Dq
q
D
ij
Tij LT
ij
ij
o
ab b
bb
b
bab
adaa dt=+- +()
D
o
ab
L1667_book.fm Page 189 Tuesday, October 21, 2003 8:33 AM
©2004 CRC Press LLC
partitioning from the organic phase to the water and gas phases. In a three-phase
system, the mole fractions of an organic species a in the water, gas, and organic
phases at equilibrium would be governed by the following (Sleep and Sykes, 1993):
(4.13)
where H is the Henry’s law coefÞcient (Pa), P
g
is the gas phase pressure (Pa), and
P
a
0
is the pure component vapor pressure (Pa) of the organic species. From this
equation, it can be seen that the mole fraction of the organic in the water phase (and
therefore the effective solubility of the organic in the water phase) in equilibrium
with a multicomponent organic phase is proportional to the mole fraction of the
organic in the organic phase. Molar concentrations of each NAPL components are
often unknown. In such cases, the mass fraction or volume fraction of the component
of interest can be used as a surrogate for its mole fraction (Mackay et al., 1991).
More soluble components preferentially dissolve from NAPL mixtures over time,
resulting in an asymptotic reduction in their mole fraction and hence effective
solubility (Mackay et al., 1991). It has been argued that removal of more soluble
species from a NAPL mixture can lead to a stabilized source for which natural
attenuation processes can contain the dissolution of the remaining sparingly soluble
components (Adeel et al., 1997).
Raoult’s law and Henry’s law are based on ideal phase behavior. The activity
coefÞcient quantiÞes the degree of nonideality experienced by a component due to
intermolecular interactions in a NAPL or aqueous solution. For ground water with
typical contaminant concentrations, the activity coefÞcients are governed primarily
by water–solute interactions. For NAPL mixtures, the degree of nonideality can be
associated with the similarity of components (Mackay et al., 1991). For example, if
all the components in a NAPL mixture are alkanes, then the activity coefÞcient can
be assumed to be unity (i.e., the NAPL behaves as an ideal mixture and follows
Raoult’s law). The use of nonideal phase partitioning relationships becomes partic-
ularly necessary when dealing with surfactants and cosolvents. In most practical
situations, the activity coefÞcients of individual components in complex, aged liquid
mixtures cannot be accurately measured. Several methods are available in published
literature for estimating activity coefÞcients (e.g., Fredenslund et al., 1977; van Ness
and Abbot, 1982).
In addition to deviations from ideality due to chemical interactions, deviations
from equilibrium between phases are expected when ßuid ßow rates are high such
as during pump-and-treat or soil vapor extraction operations. Sleep and Sykes (1989)
showed that rate limitations on mass transfer between phases could have a signiÞcant
impact on the fate and transport of volatile organics in variably saturated porous
media. In particular, the rates of removal of organics from the subsurface by pump-
and-treat or soil vapor extraction are lower than predicted when using an equilibrium
partitioning model. As contact areas between the organic phase and the water and
gas phases are expected to decrease with mass removed, the rates of organic removal
are expected to decline with time, resulting in very long times required to achieve
cleanup goals.
HX X P X P
wggoaa aa
==
0
L1667_book.fm Page 190 Tuesday, October 21, 2003 8:33 AM
©2004 CRC Press LLC
The model of Sleep and Sykes (1989) assumed that kinetic interphase mass
transfer could be simulated as a Þrst-order process, governed by the following:
(4.14)
where r
aij
is the mass transfer rate of species a from phase i to phase j per porous
media volume (or from phase j to phase i if r
aij
< 0), g
ij
is the mass transfer coefÞcient
between phase i and phase j, r
j
is the density of phase j, f is porosity, S
j
is the
saturation of phase j, X
a
is the actual mass fraction of species a in phase j, and is
the mass fraction in phase j that would occur if equilibrium existed with phase i.
In recent years, several studies have been published that demonstrate the impor-
tance of rate-limited organic-phase dissolution and propose a variety of correlations
to predict Þrst-order mass transfer coefÞcients for NAPL dissolution from residual
saturations of organics. Mass transfer coefÞcients were calculated from Sherwood
numbers. The Sherwood number is a dimensionless mass transfer number deÞned
in terms of the Þrst-order mass transfer coefÞcient; the molecular diffusion coefÞ-
cient, D; and a length scale, l, of the porous medium (typically d
50
):
(4.15)
The Sherwood number in turn is related to ßuid velocities, diffusion coefÞcients,
and organic ßuid saturations. For example, Miller et al. (1990) found that Sher-
wood numbers describing NAPL dissolution in centimeter-scale sand columns
could be Þt by the following:
(4.16)
where f is porosity, q
n
is the nonwetting-phase volume fraction, Re
w
is the water-
phase Reynolds number, and Sc
w
is the water-phase Schmidt number (i.e., ratio of
water-phase velocity to water-phase diffusion coefÞcient of organic species). Miller
et al. (1998) summarized correlations found by others such as Powers et al. (1992,
1994). It is likely that the empirical coefÞcients and exponents of the mass transfer
correlations are sensitive to organic-phase emplacement techniques and soil pore
size distributions. It must also be stressed that these models were developed for
millimeter- or centimeter-scale experiments. Testing these models at the Þeld scale
has not been attempted, and it is certain that an upscaling procedure would be
required before applications in models discretized at the Þeld scale.
Investigations of mass transfer between the water and gas phases indicate that
this process is rapid compared with the partitioning between organic and water
phases. Miller et al. (1998) summarize correlations published for rate constants for
gas–water and gas–organic partitioning.
The partitioning of chlorinated organic compounds to the soil phase (adsorption)
can also have a very signiÞcant impact on fate and transport in the subsurface
rSXX
ij ij j j j
eq
jaaa
grf=-()
X
j
eq
a
Sh
l
D
=
g
2
Sh Sc
nwnw
=-12
075 05
()Re
fq q
L1667_book.fm Page 191 Tuesday, October 21, 2003 8:33 AM
©2004 CRC Press LLC
(Schwarzenbach et al., 1993). In recent years, sorption mechanisms have been the focus
of a numerous investigations. Brusseau and Rao (1989) and Weber et al. (1991) sum-
marize current concepts of adsorption in subsurface systems. In many systems (e.g.,
those involving nonionic hydrophobic solute sorbing from the water phase to natural
soils with signiÞcant organic content), linear sorption models may be appropriate (Miller
et al., 1998). When sorption behavior deviates from linearity, models such as the
Freundlich model or the Langmuir model are often used (Weber et al., 1991).
Recent investigations have found that sorption and desorption processes can take
from months to years to reach equilibrium. Cornelissen et al. (1997) examined the
temperature dependence of slow adsorption and desorption in batch experiments
with chlorobenzenes, PCBs, polycyclic aromatic hydrocarbons (PAHs), and labora-
tory- and Þeld-contaminated sediments. The laboratory-contaminated sediments
were maintained in contact with the chemicals of interest for 34 d. Cornelissen et
al. (1997) identiÞed three stages of desorption: a rapid stage corresponding to the
Þrst few hours of desorption, an intermediate stage corresponding to a few weeks,
and a slow stage corresponding to several months of desorption time.
Rate limitations of sorption and desorption are usually attributed to slow diffusion
within soil grains, or within soil aggregates (Brusseau and Rao, 1989). Some models
assume that this process can be described by a Þrst-order model, whereas others use
a diffusion-based model incorporating assumptions about soil grain or aggregate
geometry. Both Þrst-order models and diffusion-based models cannot reproduce the
rapid initial sorption rates observed experimentally. As a result, a number of two-site
models have been proposed that include both equilibrium and kinetic sorption sites
(e.g., Nkedi-Kizza et al., 1984; van Genuchten and Wagenet, 1989).
The Þndings of Cornelissen et al. (1997) that a range of sorption coefÞcients
were required to model kinetic sorption has been addressed by several other research-
ers. Connaughton et al. (1993); Pedit and Miller (1994); Chen and Wagenet (1995);
and Culver et al. (1997) presented models that employed distributions of Þrst-order
rate constants to characterize sorption kinetics. Culver et al. (1997) used both log-
normal and gamma distributions for sorption rate constants. Cunningham et al.
(1997) developed a model that attributed sorption to intergranular diffusion. Diffu-
sion was characterized by a gamma distribution of diffusion coefÞcients rather than
by a distribution of rate constants. The model was Þt to TCE sorption experiments
conducted at 15, 30, and 60°C with silica gel and natural sediments.
Considerable research has been performed on vapor sorption to low moisture
content soils and the effect of humidity on sorption. In the case of vapor sorption to
low moisture content soils, nonlinear sorption isotherms are required that incorporate
the effects of soil humidity on sorption (Chiou and Shoup, 1985; Unger et al., 1996a).
Comprehensive modeling of organic vapor transport in low moisture content soils thus
requires nonlinear sorption models as well as predictions of water vapor transport.
Research both at the laboratory and the Þeld scales indicates that sorption rates often
occur at rates slow enough to warrant the use of a kinetic model that accounts for at
least two sorption regimes. Methods for determining the appropriate effective Þeld-scale
parameters for these models has not been developed, and scaling issues have not yet
been adequately addressed (Miller et al., 1998). The multisite models also introduce
additional variables that must be solved, increasing the computational cost of modeling.
L1667_book.fm Page 192 Tuesday, October 21, 2003 8:33 AM
©2004 CRC Press LLC
4.2.3 MODELING BIOTIC AND ABIOTIC TRANSFORMATIONS
4.2.3.1 Review of Chlorinated Solvent
Transformation Mechanisms
4.2.3.1.1 Biodegradation Mechanisms
Once dissolved into ground water, CAHs may be subject to a variety of biotransfor-
mation mechanisms depending on the redox chemistry and availability of other carbon
sources (e.g., natural organic matter or petroleum cocontaminants). The three general
biodegradation mechanisms are reductive dehalogenation, oxidation, and aerobic
cometabolism. Of these three mechanisms, reductive dehalogenation is believed to
be the most effective and perhaps the most important mechanism contributing to the
natural destruction of CAHs in aquifers. The state-of-the-science regarding the poten-
tial for CAH biodegradation under various conditions is summarized in Table 4.1.
TABLE 4.1
Conditions for Biotic and Abiotic Transformations of Chlorinated Solvents
Compound
Anaerobic Biodegradation
Potential
Aerobic Biodegradation
Potential
Abiotic
Degradation
Potential
Primary
Substrate
Co-
metabolic
Primary
Substrate
Co-
metabolic
PCE XXX XXX 0 0 XX
TCE XXX XXX 0 XX XX
1,1-DCE Perhaps XX Perhaps X X
t-DCE Perhaps XX Perhaps XXX X
c-DCE XX XX XX XXX X
VC XX XX XXX XXXX
PCA XXX 0 XXX
1,1,2-TCA XXX 0 XXX
1,1,1-TCA XXXX 0 Perhaps XXXX
1,1-DCA XX X XX
1,2-DCA X XX X XXX
CA XX XX XXXX
CT Perhaps XXXX 0 0 XX
CF XX X
DCM Yes Yes XXX
CM
Notes: 0 = Very small (if any) potential; X = Some potential; XX = Fair potential; XXX = Good potential;
XXXX = Excellent potential; 1,1-DCE = 1,1-Dichlorethene; t-DCE = trans-1,2-Dichloroethene; c-DCE
= cis-1,2-Dichloroethene; VC = Vinyl chloride; PCA = Tetrachloroethane; 1,1,2-TCA = 1,1,2-Trichloro-
ethane; 1,1,1-TCA = 1,1,1-Trichloroethane; 1,1-DCA = 1,1-Dichloroethane; 1,2-DCA = 1,2-Dichloroet-
hane; CA = Chloroethane; CF = Chloroform; DCM = Dichloromethane; CM = Chloromethane.
Source: After McCarty and Semprini, 1994; McCarty, 1997; Butler and Hayes, 1999; Lorah and Olsen,
1999; Bradley and Chapelle, 2000; Maymo-Gatell et al., 2001.
L1667_book.fm Page 193 Tuesday, October 21, 2003 8:33 AM
©2004 CRC Press LLC
Names of speciÞc CAHs are abbreviated in the discussion below. Table 4.1 provides
an index of name abbreviations for each of the CAHs considered here.
4.2.3.1.2 Reductive Dehalogenation
Under certain anaerobic conditions, a variety of bacteria can use chlorinated solvents
for respiration, transforming them in a process known as halorespiration (McCarty,
1997). In this process, halogenated compounds such as PCE and TCE are biode-
graded by reductive dehalogenation. Reductive dehalogenation is a reaction in which
one or more chlorine atoms are replaced with hydrogen atoms, reducing the carbon
atom on the CAH molecule. Certain bacteria that mediate this reaction can gain
energy and grow through mediation of reductive dehalogenation (Maymo-Gatell et
al., 1997, 2001). Reducing equivalents for this process are supplied by hydrogen
produced by the biodegradation of naturally occurring or anthropogenic carbon
compounds. The biodegradation of the organic matter is thought to be carried out
by fermentative organisms, not by the dechlorinating organisms. Most microbial
dechlorinating consortia also contain methanogens that compete with dechlorinators
for hydrogen (Fennel and Gossett, 1998).
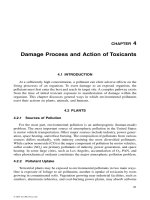
Figure 4.2 illustrates the common pathways for reductive dehalogenation of
chlorinated compounds. For PCE, reductive dehalogenation follows the order of
PCE Æ TCE Æ c-DCE Æ VC Æ ethene. The rate of reductive dehalogenation tends
to decrease as the number of chlorine substituents on the CAH molecule decreases
(Vogel, 1994). In addition, the rate and extent of dehalogenation depends on the
FIGURE 4.2 Natural degradation pathways for CAHs.
Notes:
Pathways shown are for anaerobic biological reductive dehalogenation unless noted.
Oxidation = both aerobic and anaerobic biooxidation.
2E = biologically mediated dichloroelimination.
Abiotic-E = abiotic elimination.
Abiotic-H = abiotic hydrolysis.
L1667_book.fm Page 194 Tuesday, October 21, 2003 8:33 AM
©2004 CRC Press LLC
redox conditions, with DCE and VC dehalogenation occurring more rapidly under
more reducing (i.e., sulfate-reducing or methanogenic) conditions.
Complete reductive dehalogenation is most commonly reported at those sites
where signiÞcant concentrations of codisposed petroleum contaminants or leachate
are also present (Semprini et al., 1995). Conversely, PCE, TCE, and DCE tend to
persist at sites where organic electron donors are absent and redox potentials are
relatively high (i.e., microaerobic or nitrate-reducing conditions) (Sturchio et al.,
1998). At some sites, intermediates such as DCE or CF can accumulate as evidence
of past reductive dehalogenation that occurred prior to exhaustion of the electron
donor supply. Accordingly, one important step in constructing chlorinated solvent
biodegradation models is to consider the amount of electron donor available to
sustain reductive dehalogenation (National Research Council [NRC], 2000), as well
as inhibition effects from transformation products such as CF.
DCE, CF, and VC can also persist due to an absence of halorespiring bacteria.
Halorespirers are not ubiquitous in nature, and not all subsurface bacteria are able
to mediate complete halogenation (e.g., PCE Æ ethene). In most laboratory studies
where complete dehalogenation of PCE and TCE has been observed, a microbial
consortium has mediated the CAH transformation sequence. To date, Dehalococ-
coides ethenogenes is the only microorganism known to be capable of completely
dechlorinating PCE (Magnuson et al., 2000).
In addition to occurring via halorespiration, reductive dehalogenation of CAHs
can also occur cometabolically. During cometabolic reductive dehalogenation, trans-
formation of a given CAH occurs fortuitously during microorganism growth on
another substrate. Many methanogenic and sulfate-reducing bacteria are able to
mediate cometabolic reductive dehalogenation, which effectively can result in the
dehalogenation of PCE and TCE but not DCE (Bagley and Gossett, 1990; Gantzer
and Wackett, 1991). In this process, dehalogenation of the CAH molecule occurs
due to reactions with bacterial cofactors (e.g., porphyrins containing redox-sensitive
metals), but the cell does not derive energy for growth. The relatively slow reductive
dehalogenation that results from this cometabolic reaction may be the cause of the
incomplete dehalogenation that is observed at many sites. Recently, evidence has
been presented that the degradation of VC by D. ethenogenes is cometabolic
(Maymo-Gatell et al., 2001).
4.2.3.1.3 Oxidation
Because chlorine atoms are electronegative by nature, the susceptibility of CAHs to
degradation via direct oxidation decreases as the number of chlorine substituents
increases (Figure 4.2). Consequently, polychlorinated ethenes such as hexachlo-
robenzene (HCB), PCE, TCE, CT, and CF are largely recalcitrant to direct oxidation.
However, it has been shown that lightly chlorinated ethenes such as VC and DCE
can be biodegraded oxidatively under aerobic, iron-reducing, and methanogenic
conditions (Hartmans and de Bont, 1992; Bradley and Chapelle, 1996, 1997, 1999;
Bradley et al., 1998). When used as the sole electron donor, VC can serve as a
growth substrate (Verce et al., 2000), and c-DCE can support cell metabolism
(Bradley and Chapelle, 2000). Consequently, the rate and extent of natural subsurface
CAH destruction does not depend on reductive dehalogenation alone. DCE and VC
L1667_book.fm Page 195 Tuesday, October 21, 2003 8:33 AM
©2004 CRC Press LLC
that are produced in reducing zones of an aquifer may be oxidized when the plume
enters zones where sulphate, nitrate, iron, or oxygen can act as electron acceptors.
4.2.3.1.4 Aerobic Cometabolism
During aerobic cometabolism, the destruction of TCE, DCE, and/or VC is coupled
to the biooxidation of a more easily degraded primary substrate such as methane or
ammonia. Of the three mechanisms for CAH biodegradation, aerobic cometabolism
is likely the least signiÞcant under natural subsurface conditions (NRC, 2000).
Aerobic cometabolism is most often characteristic of engineered bioremediation
systems, where oxygen and a primary substrate such as methane, toluene, phenol,
butane, or ammonia are introduced to promote chlorinated ethene biodegradation.
However, aerobic cometabolism can occur intrinsically where CAHs come into
contact with methane in slightly aerated zones of an aquifer, as has been suggested
by Bradley and Chapelle (1998) and Lorah and Olsen (1999).
4.2.3.1.5 Abiotic Transformations
In general, biodegradation is the most important natural process governing the
destruction of CAHs in the subsurface. For those CAHs that have been observed to
degrade abiotically under natural conditions, abiotic degradation rates are typically
much slower than biodegradation rates. However, these reactions can still be signif-
icant within the time scales commonly associated with ground water movement.
A variety of investigations have shown chloroethenes to be resistant to abiotic
degradation. A growing body of evidence suggests, however, that PCE; TCE; PCA;
1,1,1-TCA; and CT can be degraded abiotically in the presence of ferrous sulÞdes
that are common in reduced aquifers and wetlands (Kriegman-King and Reinhard,
1992; Curtis and Reinhard, 1994; Devlin and Muller, 1999; Butler and Hayes,
1999, 2000). CT can also be reduced abiotically in the presence of dissolved phase
Fe
2+
, HS
_
, and pyrite. Natural organic matter that coats aquifer material can
accelerate this process signiÞcantly by acting as an electron shuttle. The effect of
iron sulÞde and organic matter could play an important role in CT reduction for
plumes that intercept bogs or wetlands. In addition, green rust, a naturally occur-
ring iron hydroxide, can also promote the degradation of CT (Heron et al., 1994;
Erbs et al., 1999).
The chemical pathway(s) for the natural abiotic degradation of PCE and TCE
can differ from the biodegradation pathway in that acetylene (C
2
H
2
) is a major
abiotic transformation intermediate for both PCE and TCE. Therefore, detecting
C
2
H
2
in chlorinated solvent plumes can serve as evidence that abiotic degradation
is occurring.
Relative to chloroethenes, chloroethanes are more susceptible to abiotic deg-
radation. 1,1,1-TCA and 1,2-dichloroethane (1,1-DCA) are both susceptible to
degradation via hydrolysis. 1,1,1-TCA can also be degraded via an abiotic elim-
ination (alkane => alkene) reaction to form 1,1-DCE (Figure 4.2). This abiotic
degradation of 1,1,1-TCA likely is the primary source of 1,1-DCE in contaminated
aquifers. PCA degrades to TCE by the same type of abiotic reaction (Lorah and
Olsen, 1999). The CA that forms as a result of TCA biotransformation also can
be transformed abiotically.
L1667_book.fm Page 196 Tuesday, October 21, 2003 8:33 AM
©2004 CRC Press LLC
4.2.3.2 Petroleum Hydrocarbon Biodegradation Models
Early fate and transport models that described contaminant biodegradation were
primarily developed for simulating the aerobic biodegradation of petroleum hydro-
carbons (Sykes et al., 1982; Borden and Bedient, 1986; Molz et al., 1986). Subse-
quently, a variety of biodegradation models have been published in the literature,
including models for both aerobic and anaerobic biodegradation processes, as well
as saturated and unsaturated zone transport (Srinivasan and Mercer, 1988; Widdow-
son et al., 1988; MacQuarrie et al., 1990; Chen et al., 1992; McClure and Sleep,
1996; Rathfelder et al., 2000). In recent years, emphasis on anaerobic biodegradation
has grown, and models have been developed that simulate biodegradation under
multiple electron-accepting conditions including nitrate-reducing, iron-reducing,
sulfate-reducing, and methanogenic conditions (Lu et al., 1999; Waddill and Wid-
dowson, 2000).
Most of these models incorporate substrate-limited biodegradation by using
Monod kinetics. In addition, electron acceptor limitations are incorporated by adding
extra Monod terms based on electron acceptor concentrations and electron acceptor
half-saturation constants (dual Monod kinetics). For example, Borden and Bedient
(1986) modeled hydrocarbon biodegradation coupled to biomass growth and decay
using versions of the following two expressions:
(4.17)
(4.18)
where C
D
is the aqueous-phase concentration of hydrocarbon (or electron donor),
X
t
represents the total active biomass concentration, k is the maximum hydrocarbon
utilization rate, K
D
is the hydrocarbon half-saturation constant, A is the electron
acceptor (oxygen) concentration, K
A
is the electron acceptor half-saturation constant,
Y is the microbial yield coefÞcient (cell mass created per unit substrate consumed),
and b is the microbial decay and endogenous respiration coefÞcient. Widdowson et
al. (1988) incorporated additional Monod terms to include the impact of nutrient
limitation on hydrocarbon biodegradation. Complete mineralization of hydrocarbon
to carbon dioxide and water is usually assumed in hydrocarbon biodegradation
modeling, although Malone et al. (1993) included the formation of intermediate
products in the biodegradation of aromatic hydrocarbons.
Most of the hydrocarbon biodegradation models simulate only aqueous-phase
transport with the exception of the McClure and Sleep (1996) model, which includes
full three-phase ßow and transport with equilibrium interphase partitioning. Rath-
felder et al. (2000) modeled aqueous and gaseous-phase transport to allow bioventing
simulation. Malone et al. (1993) and Rathfelder et al. (2000) included kinetic NAPL
dissolution from residual NAPL sources. Recent laboratory experiments have shown
dC
dt
Xk
C
KC
A
KA
D
t
D
DD A
=-
+
È
Î
Í
ù
û
ú
+
È
Î
Í
ù
û
ú
dX
dt
XYk
C
KC
A
KA
bX
t
t
D
DD A
t
=
+
È
Î
Í
ù
û
ú
+
È
Î
Í
ù
û
ú
-
L1667_book.fm Page 197 Tuesday, October 21, 2003 8:33 AM
©2004 CRC Press LLC
that PCE biodegradation can occur in the presence of the organic phase and that
this can enhance the rate of PCE DNAPL dissolution (Yang and McCarty, 2000;
Cope and Hughes, 2001). These empirical Þndings conÞrm the predictions of Sea-
gren et al. (1994), who were among the Þrst to provide a quantitative description of
enhanced NAPL dissolution resulting from biodegradation. Mass transfer limitations
from both the NAPL and sorbed phases can also limit the biodegradation rate in the
aqueous phase (Ghoshal et al., 1996; Bosma et al., 1997). Because substrates are
typically hydrolyzed prior to biodegradation, nonaqueous and sorbed-phase hydro-
phobic organic contaminants generally are thought to be unavailable for biodegra-
dation (Zhang et al., 1998). Consequently, the impact of biodegradation on NAPL
and plume attenuation is often limited by the rate of NAPL dissolution and/or
desorption from aquifer solids.
Most hydrocarbon biodegradation models are based on the recognition that
biomass predominantly is present as a bioÞlm in a porous medium; however,
there is some variation in the representation of the bioÞlm and the substrate
uptake processes of the bioÞlm. Baveye and Valocchi (1989) reviewed the three
most common representations of bioÞlm processes in porous media. The Þrst
bioÞlm model (Rittmann et al., 1980; Bouwer and McCarty, 1984) describes the
bioÞlm as having uniform thickness, covering all solid surfaces. The transfer of
solutes into the bioÞlm occurs across a stagnant boundary layer into a thin
bioÞlm that is conceptualized to be fully penetrated so that mass transfer limi-
tations are all associated with the stagnant boundary layer. Therefore, this model
requires solution of algebraic equations to determine bioÞlm concentrations and
also requires assumptions about the stagnant boundary thickness and bioÞlm
surface area.
The second class of bioÞlm models (Molz et al., 1986; Widdowson et al., 1988;
Chen et al., 1992) assumes that biomass grows in microcolonies that are constant
in size but increase in number as substrate consumption occurs. A stagnant boundary
layer governing mass transfer to the microcolonies is hypothesized as with the Þrst
class, thereby requiring solution for microcolony substrate concentrations and
assumptions about boundary-layer thickness and microcolony geometry.
The third class of bioÞlm models (Sykes et al., 1982; Borden and Bedient, 1986;
Kindred and Celia, 1989; MacQuarrie et al., 1990; Wood et al., 1994; McClure and
Sleep, 1996) makes no assumption about bioÞlm conÞguration and assumes that
diffusion limitations in stagnant boundary layers and in the bioÞlm may be neglected
and that biodegradation kinetics are based directly on bulk water phase concentra-
tions. Although this is a simpliÞcation of the pore-scale processes, at present there
is no sufÞcient experimental evidence to discount the practical value of this simpliÞed
model (Baveye and Valocchi, 1989).
The models of Molz et al. (1986); Widdowson et al. (1988); and Chen et al.
(1992) assume a stationary biomass phase with no bacterial transport. In contrast,
the models of Borden and Bedient (1986), MacQuarrie et al. (1990), and McClure
and Sleep (1996) assume advective–dispersive transport of bacteria with attachment
of biomass to aquifer solids modeled as a linear sorption process. Sorption coefÞ-
cients are typically chosen so that 95% of the biomass is attached to the soil (Borden
and Bedient, 1986).
L1667_book.fm Page 198 Tuesday, October 21, 2003 8:33 AM
©2004 CRC Press LLC
It is recognized that the process of attached microbial growth, bacterial deposi-
tion in porous media, and bioÞlm shearing is much more complex than can be
simulated with a linear sorption model. Complex models incorporating biomass
attachment and detachment as a function of bioÞlm aqueous-phase concentration,
bioÞlm thickness, and shear forces related to ground water velocity have been
developed (Taylor and Jaffe, 1990; Cunningham et al., 1991). Most of these models
assume an idealized geometry of soil particles and of uniform bioÞlm growth. These
models incorporate changes in soil permeability, porosity, and dispersivity as a
function of bioÞlm thickness and have been applied to laboratory-scale experiments
(Taylor and Jaffe, 1990), but no Þeld-scale veriÞcation has been performed. Including
the effects of bioÞlm growth on permeability, porosity, and dispersivity in a biodeg-
radation model may be necessary in engineered remediation systems where biomass
stimulation through nutrient addition and high carbon loading produce high rates of
biological growth. Such models can also be used to optimize nutrient and substrate
addition to minimize formation plugging (Taylor and Jaffe, 1991).
4.2.3.3 Chlorinated Solvent Biodegradation Models
For the reasons discussed in Section 4.2.3.1, modeling chlorinated solvent biodeg-
radation can be substantially more complex than modeling petroleum hydrocarbon
biodegradation. Model selection depends on a variety of factors, including the type
of dechlorinating microorganisms present, the type and amount of electron donor
present, and the redox conditions in the aquifer. In general, the practice of modeling
chlorinated solvent biodegradation is less well established than that for modeling
petroleum hydrocarbon biodegradation. Nevertheless, the following three basic types
of chlorinated solvent biodegradation models have emerged:
• Monod models that simulate halorespiration
• Monod models that simulate cometabolic biodegradation
• Sequential transformation models that assume a Þrst-order kinetics for
each sequential transformation
Fennel and Gossett (1998) and Bagley (1998) presented some of the Þrst models
for simulating halorespiration. In the batch model of Bagley (1998), dual Monod
kinetics based on chlorinated ethene concentration and hydrogen concentration was
used to simulate each of the transformation steps from PCE to ethene. For example,
the biodegradation of PCE was represented by the following:
(4.19)
where X
PCE
is the biomass concentration of PCE degraders, c
PCE
and c
H2
are the
water-phase concentrations of PCE and hydrogen, respectively, and K
PCE
and K
H2
are the half-saturation constants for PCE and hydrogen, respectively. The production
of hydrogen from the fermentation of ethanol to acetic acid and propionic acid and
rkX
c
Kc
c
Kc
PCE PCE
PCE
PCE PCE
H
HH
=-
+
È
Î
Í
ù
û
ú
+
È
Î
Í
Í
ù
û
ú
ú
2
22
L1667_book.fm Page 199 Tuesday, October 21, 2003 8:33 AM
©2004 CRC Press LLC
from the fermentation of propionic acid was included, as was the use of acetic acid
and hydrogen by methanogens. In addition to the simulation of 10 chemical species,
the model includes the growth of 2 dechlorinating species (PCE to c-DCE and c-DCE
to ETH), ethanol and propionic acid fermenters, and aceticlastic and hydro-
genotrophic methanogens. Inhibition terms were also included in the Monod terms
to account for VC degradation inhibition by the other chlorinated ethenes and
thermodynamic limitations on fermentation reactions.
The batch model of Bagley (1998) has been incorporated into the compositional
model of McClure and Sleep (1996) as described in Aschwanden (2001). The
resulting model involves solution for concentrations of 10 chemical species and 5
microbial species and is therefore not readily applicable to multidimensional Þeld-
scale modeling of anaerobic PCE biodegradation. In addition to metabolic dehalo-
genation, many chlorinated organics can be biodegraded cometabolically. Because
the organisms do not derive any beneÞt from this cometabolic biodegradation but
grow on other substrates, modeling cometabolic biodegradation involves simulating
the chlorinated contaminant and growth substrate.
Many chlorinated compounds create intermediates that are toxic to microorgan-
isms. For example, the aerobic biodegradation of TCE and VC produces epoxides
that inactivate microorganisms (Wackett et al., 1989). Chang and Alvarez-Cohen
(1995), building on the work of Criddle (1993), developed a model that included
biodegradation of a growth substrate and a chlorinated organic by oxygenase-
expressing cultures. Cell growth, reducing energy limitation, product toxicity, com-
petition between growth substrate, and cometabolic substrate for oxygenase enzymes
were all included in the model. The resulting equations for degradation of growth
substrate and chlorinated contaminant are as follows:
(4.20a)
(4.20b)
where X is the biomass concentration, R is the reducing energy electron equivalent
concentration, K
R
is the half-saturation constant for reducing energy, S
g
is the con-
centration of growth substrate, S
c
is the concentration of chlorinated organic, K
Sg
is
the half-saturation constant for growth substrate, and K
Sc
is the half-saturation con-
stant for chlorinated organic. The terms S
c
/K
Sc
and S
g
/K
Sg
account for competitive
inhibition between growth substrate and chlorinated organic.
Growth is modeled by the following:
(4.21)
dS
dt
kX
R
KR
S
KSKS
g
g
R
g
Sg c Sc g
=-
+
Ê
Ë
Á
ˆ
¯
˜
++
Ê
Ë
Á
ˆ
¯
˜
(/)1
dS
dt
kX
R
KR
S
KSKS
c
c
R
c
Sc g Sg c
=-
+
Ê
Ë
Á
ˆ
¯
˜
++
Ê
Ë
Á
ˆ
¯
˜
(/)1
dX
dt
Y
dS
dt T
dS
dt
b
g
c
c
=- + -
1
L1667_book.fm Page 200 Tuesday, October 21, 2003 8:33 AM
©2004 CRC Press LLC