Fundamentals of Risk Analysis and Risk Management - Section 3 doc
Bạn đang xem bản rút gọn của tài liệu. Xem và tải ngay bản đầy đủ của tài liệu tại đây (1.75 MB, 92 trang )
© 1997 by CRC Press, Inc.
Section III
Risk Perception, Law, Politics,
and Risk Communication
L1130chIII.1.fm Page 231 Friday, September 3, 2004 4:41 PM
© 1997 by CRC Press, Inc.
CHAPTER III.1
Risk Perception and Trust
Paul Slovic
INTRODUCTION
Perceived risk can best be characterized as a battleground marked by strong and
conflicting views about the nature and seriousness of the risks of modern life. The
paradox for those who study risk perception is that, as people have become healthier
and safer on average, they have become more — rather than less — concerned about
risk, and they feel more and more vulnerable to the risks of modern life. Studies of
risk perception attempt to understand this paradox and to understand why it is that
our perceptions are so often at variance with what the experts say we should be
concerned about. We see, for example, that people have very great concerns about
nuclear power and chemical risks (which most experts consider acceptably safe) and
rather little concern about dams, alcohol, indoor radon, and motor vehicles (which
experts consider to be risky).
Perceptions of risk appear to exert a strong influence on the regulatory agenda
of government agencies. In 1987, a U.S. Environmental Protection Agency (EPA)
task force of 75 experts ranked the seriousness of risk for 31 environmental problems.
The results showed that (1) the EPA’s actual priorities differed in many ways from
this ranking and (2) their priorities were much closer to the public’s concerns than
to the experts’ risk assessments. In particular, hazardous waste disposal was the
highest priority item on EPA’s agenda and the area of greatest concern for the public
as well, yet this problem was judged only moderate in risk by the experts.
It is important to understand why the public is so greatly concerned today about
risks from technology and its waste products. This author does not have the answer,
but has several hypotheses about factors that might contribute to the perceptions that
such risks are high and increasing. One hypothesis is that we have greater ability
L1130chIII.1.fm Page 233 Friday, September 3, 2004 4:41 PM
© 1997 by CRC Press, Inc.
than ever before to detect minute levels of toxic substances. We can detect parts per
billion or trillion or even smaller amounts of chemicals in water and air and in our
own bodies. At the same time, we have considerable difficulty understanding the
health implications of this new knowledge. Second, we have an increasing reliance
on powerful new technologies that can have serious consequences if something goes
wrong. When we lack familiarity with a technology, it is natural to be suspicious of
it and cautious in accepting its risks. Third, in recent years, we have experienced a
number of spectacular and catastrophic mishaps, such as Three Mile Island, Cher
-
nobyl, Bhopal, the Challenger accident, and the chemical contamination at Love
Canal. These events receive extensive media coverage which highlights the failure
of supposedly “fail-safe” systems. Fourth, we have an immense amount of litigation
over risk problems, which brings these problems to public attention and pits expert
against expert, leading to loss of credibility on all sides. Fifth, the benefits from
technology are often taken for granted. When we fail to perceive significant benefit
from an activity, we are intolerant of any degree of risk. Sixth, we are now being
told that we have the ability to control many elements of risk, for example, by
wearing seatbelts, changing our diets, getting more exercise, and so on. Perhaps the
increased awareness that we have control over many risks makes us more frustrated
and angered by those risks that we are not to be able to control, such as when
exposures are imposed on us involuntarily (e.g., air and water pollution). Seventh,
psychological studies indicate that when people are wealthier and have more to lose,
they become more cautious in their decision making. Perhaps this holds true with
regard to health as well as wealth. Finally, there may be real changes in the nature
of today’s risks. For example, there may be greater potential for catastrophe than
there was in the past, due to the complexity, potency, and interconnectedness of
technological systems (Perrow 1984).
Key Words: perceived risk, trust, risk communication, risk assessment, risk
management
1. PSYCHOMETRIC STUDIES
Public opinion polls have been supplemented by more quantitative studies of
risk perception that examine the judgments people make when they are asked to
characterize and evaluate hazardous activities and technologies. One broad strategy
for studying perceived risk is to develop a taxonomy for hazards that can be used
to understand and predict responses to their risks. The most common approach to
this goal has employed the psychometric paradigm (Slovic 1986, 1987, Slovic et al.
1985) which produces quantitative representations or “cognitive maps” of risk atti
-
tudes and perceptions. Within the psychometric paradigm, people make quantitative
judgments about the current and desired riskiness of various hazards. These judg
-
ments are then related to judgments of other properties, such as the hazard’s status
on characteristics that have been hypothesized to account for risk perceptions (e.g.,
L1130chIII.1.fm Page 234 Friday, September 3, 2004 4:41 PM
© 1997 by CRC Press, Inc.
voluntariness, dread, catastrophic potential, controllability). These characteristics of
risk tend to be correlated highly with each other across the domain of hazards. For
example, hazards judged to be catastrophic also tend to be seen as uncontrollable
and involuntary. Investigation of these relationships by means of factor analysis has
shown that the broad domain of risk characteristics can be reduced to a small set of
higher-order characteristics or “factors.”
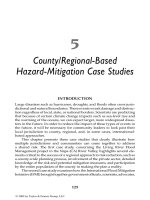
The factor space shown in Figure 1 has been replicated often. Factor 1, labeled
“Dread Risk,” is defined at its high (right-hand) end by perceived lack of control,
dread, catastrophic potential, and fatal consequences. Factor 2, labeled “Unknown
Risk,” is defined at its high end by hazards perceived as unknown, unobservable,
new, and delayed in their manifestation of harm. Nuclear power stands out in this
(and many other) study as uniquely unknown and dreaded, with great potential for
catastrophe. Nuclear waste tends to be perceived in a similar way. Chemical hazards
such as pesticides and polychlorinated biphenyls (PCBs) are not too distant from
nuclear hazards in the upper-right-hand quadrant of the space.
Research has shown that laypeople’s perceptions of risk are closely related to
these factor spaces. In particular, the further to the right that a hazard appears in the
space, the higher its perceived risk, the more people want to see its current risks
reduced, and the more people want to see strict regulation employed to achieve the
desired reduction in risk (Slovic et al. 1985). In contrast, experts’ perceptions of
risk are not closely related to any of the various risk characteristics or factors derived
from these characteristics. Instead, experts appear to see riskiness as synonymous
with expected annual mortality. As a result, conflicts over “risk” may result from
experts and laypeople having different definitions of the concept. Expert recitations
of risk probabilities and statistics will do little to change people’s attitudes and
perceptions if these perceptions are based on nonprobabilistic and nonstatistical
qualities.
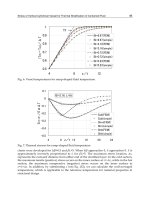
Another important finding from risk perception research is that men and women
have systematically different risk perceptions (see Figure 2). Some have attributed
this to men’s greater knowledge of technology and risk (i.e., science literacy). But
a study by Barke et al. (1995) found that risk judgements of women scientists differed
from the judgements of male scientists in much the same way as men and women
nonscientists differed. Women scientists perceived higher risk than men scientists
for nuclear power and nuclear waste.
Recently, Flynn et al. (1994) examined risk perception as a function of both race
and gender. Surprisingly, nonwhite men and women differed rather little in their
perceptions and differed little from white women. It was white males who stood
apart from the rest in seeing risks as less serious than others (see Figure 3). Subse
-
quent analysis showed that this “white male effect” was due to the response of 30%
of the white male subgroup of relatively high education and income.
Why do a substantial percentage of white males see the world as much less risky
than everyone else sees it? Perhaps white males see less risk in the world because
they create, manage, control, and benefit from so much of it. Perhaps women and
nonwhite men see the world as more dangerous because in many ways they are
L1130chIII.1.fm Page 235 Friday, September 3, 2004 4:41 PM
© 1997 by CRC Press, Inc.
more vulnerable, because they benefit less from many of its technologies and insti-
tutions, and because they have less power and control.
Inasmuch as these sociopolitical factors shape public perception of risks, we can
see yet another reason why traditional attempts to make people see the world as
white males do, by showing them statistics and risk assessments, are unlikely to
succeed. The problem of risk conflict and controversy clearly goes beyond science.
It is deeply rooted in the social and political fabric of our society. This analysis
points to the need for a fairer and more equitable society, as well as for fairer
processes for managing risk.
Figure 1 Location of 81 hazards on Factors 1 (Dread Risk) and 2 (Unknown Risk) derived
from the interrelationships among 15 risk characterisitics. Each factor is made up
of a combination of characteristics, as indicated by the lower diagram. (From Slovic,
P. (1987). Science, 236, 280. Copyright American Association for the Advancement
of Science. With permission.)
L1130chIII.1.fm Page 236 Friday, September 3, 2004 4:41 PM
© 1997 by CRC Press, Inc.
2. RISK COMMUNICATION AND TRUST
2.1 The Importance of Trust
The research described previously has painted a portrait of risk perception
influenced by the interplay of psychological, social, and political factors. Members
of the public and experts can disagree about risk because they define risk differently,
have different worldviews, or different social status. Another reason why the public
often rejects scientists’ risk assessments is lack of trust.
Figure 2 Mean risk perception ratings by white males and white females. (From a survey
conducted by P. Slovic and co-workers.)
L1130chIII.1.fm Page 237 Friday, September 3, 2004 4:41 PM
© 1997 by CRC Press, Inc.
Social relationships of all types, including risk management, rely heavily on
trust. Indeed, much of the contentiousness that has been observed in the risk man
-
agement arena has been attributed to a climate of distrust that exists between the
public, industry, and risk management professionals (e.g., Slovic 1993, Slovic et al.
1991). To appreciate the importance of trust, it is instructive to compare those risks
that we fear and avoid with those we accept casually. Starr (1985) has pointed to
the public’s lack of concern about the risks from tigers in urban zoos as evidence
that acceptance of risks is strongly dependent on confidence in risk management.
Risk perception research (Slovic 1990) documents that people view medical
technologies based on use of radiation and chemicals (i.e., X-rays and prescription
drugs) as high in benefit, low in risk, and clearly acceptable. However, people view
Figure 3 Mean risk perception ratings by race and gender. (From Flynn, J., Slovic, P., and
Mertz, C. K. (1994). Risk Analysis, 14(6), 1104. With permission.)
L1130chIII.1.fm Page 238 Friday, September 3, 2004 4:41 PM
© 1997 by CRC Press, Inc.
industrial technologies involving radiation and chemicals (i.e., nuclear power, pes-
ticides, industrial chemicals) as high in risk, low in benefit, and unacceptable.
Although X-rays and medicines pose significant risks, our relatively high degree of
trust in the physicians who manage these devices makes them acceptable. Numerous
polls have shown that the government and industry officials who oversee the man
-
agement of nuclear power and nonmedical chemicals are not highly trusted (Flynn
et al. 1992, McCallum et al. 1990, Pijawka and Mushkatel 1992, Slovic et al. 1991).
Because it is impossible to exclude the public in a highly participatory democ-
racy, the response of industry and government to this crisis of confidence has been
to turn to the young and still primitive field of risk communication in search of
methods to bring experts and laypeople into alignment and make conflicts over
technological decisions easier to resolve. Although attention to communication can
prevent blunders that exacerbate conflict, there is rather little evidence that risk
communication has made any significant contribution to reducing the gap between
technical risk assessments and public perceptions or to facilitating decisions about
nuclear waste or other major sources of risk conflict. The limited effectiveness of
risk communication efforts can be attributed to the lack of trust. If you trust the risk
manager, communication is relatively easy. If trust is lacking, no form or process
of communication will be satisfactory (Fessenden-Raden et al. 1987). Thus, trust is
more fundamental to conflict resolution than is risk communication.
2.2 How Trust Is Created and Destroyed
One of the most fundamental qualities of trust has been known for ages. Trust
is fragile. It is typically created rather slowly, but it can be destroyed in an instant,
by a single mishap or mistake. Thus, once trust is lost, it may take a long time to
rebuild it to its former state. In some instances, lost trust may never be regained.
Abraham Lincoln understood this quality. In a letter to Alexander McClure he
observed: “If you once forfeit the confidence of your fellow citizens, you can never
regain their respect and esteem” (italics added).
2.3 The Impact of Events on Trust
The fact that trust is easier to destroy than to create reflects certain fundamental
mechanisms of human psychology called here “the asymmetry principle.” When it
comes to winning trust, the playing field is not level. It is tilted toward distrust for
each of the following reasons:
1. Negative (trust-destroying) events are more visible or noticeable than positive
(trust-building) events. Negative events often take the form of specific, well-defined
incidents such as accidents, lies, discoveries of errors, or other mismanagement.
Positive events, while sometimes visible, more often are fuzzy or indistinct. For
example, how many positive events are represented by the safe operation of a
nuclear power plant for 1 day? Is this one event, dozens of events, hundreds? There
is no precise answer. When events are invisible or poorly defined, they carry little
or no weight in shaping our attitudes and opinions.
L1130chIII.1.fm Page 239 Friday, September 3, 2004 4:41 PM
© 1997 by CRC Press, Inc.
2. When events do come to our attention, negative (trust-destroying) events carry
much greater weight than positive events. This important psychological tendency
is illustrated by a study in which 103 college students rated the impact on trust of
45 hypothetical news events pertaining to the management of a large nuclear power
plant in their community (Slovic et al. 1993). The following events were designed
to be trust increasing:
• There have been no reported safety problems at the plant during the past year.
• There is careful selection and training of employees at the plant.
• Plant managers live nearby the plant.
• The county medical examiner reports that the health of people living near the
plant is better than the average for the region.
Other events were designed to be trust decreasing:
• A potential safety problem was found to have been covered up by plant officials.
• Plant safety inspections are delayed in order to meet the electricity production
quota for the month.
• A nuclear power plant in another state has a serious accident.
• The county medical examiner reports that the health of people living near the
plant is worse than the average for the region.
The respondents were asked to indicate, for each event, whether their trust in
the management of the plant would be increased or decreased upon learning of
that event. After doing this, they rated how strongly their trust would be affected
by the event on a scale ranging from 1 (very small impact on trust) to 7 (very
powerful impact on trust).
The percentages of Category 7 ratings, shown in Figure 4, dramatically dem-
onstrate that negative events are seen as far more likely to have a powerful effect
on trust than are positive events. The data shown in Table 1 are typical. The negative
event, reporting plant neighbors’ health as worse than average, was rated 6 or 7 on
the impact scale by 50% of the respondents. A matched event, reporting neighbors’
health to be better than average, was rated 6 or 7 by only 18.3% of the respondents.
There was only one event perceived to have any substantial impact on increasing
trust. This event stated that: “An advisory board of local citizens and environmen
-
talists is established to monitor the plant and is given legal authority to shut the
plant down if they believe it to be unsafe.”
This strong delegation of authority to the local public was rated 6 or 7 on the
impact scale by 38.4% of the respondents. Although this was a far stronger showing
than for any other positive event, it would have been a rather average performance
in the distribution of impacts for negative events.
The importance of an event is related, at least in part, to its frequency (or rarity).
An accident in a nuclear plant is more informative with regard to risk than is a
day (or even a large number of days) without an accident. Thus, in systems where
we are concerned about low-probability/high-consequence events, problematic
events will increase our perceptions of risk to a much greater degree than favorable
events will decrease them.
3. Adding fuel to the fire of asymmetry is yet another idiosyncracy of human psy-
chology; sources of bad (trust-destroying) news tend to be seen as more credible
than sources of good news. For example, in several studies of what we call “intuitive
toxicology” (Kraus et al. 1992), we have examined people’s confidence in the
ability of animal studies to predict human health effects from chemicals. In general,
confidence in the validity of animal studies is not particularly high. However, when
told that a study has found that a chemical is carcinogenic in animals, people
L1130chIII.1.fm Page 240 Friday, September 3, 2004 4:41 PM
© 1997 by CRC Press, Inc.
express considerable confidence in the validity of this study for predicting health
effects in humans. Regulators respond like the public. Positive (bad news) evidence
from animal bioassays is presumptive evidence of risk to humans; negative evidence
(e.g., the chemical was not found to be harmful) carries little weight (Efron 1984).
Figure 4 Differential impact of trust-increasing and trust-decreasing events. Note: Only per-
centages of Category 7 ratings (very powerful impact) are shown here. (From Slovic,
P. (1993). Risk Analysis, 13, 675. With permission.)
L1130chIII.1.fm Page 241 Friday, September 3, 2004 4:41 PM
© 1997 by CRC Press, Inc.
4. Another important psychological tendency is that distrust, once initiated, tends to
reinforce and perpetuate distrust. This occurs in two ways. First, distrust tends to
inhibit the kinds of personal contacts and experiences that are necessary to over-
come distrust. By avoiding others whose motives or actions we distrust, we never
come to see that these people are competent, well meaning, and trustworthy.
Second, initial trust or distrust colors our interpretation of events, thus reinforcing
our prior beliefs. Persons who trusted the nuclear power industry saw the events
at Three Mile Island as demonstrating the soundness of the defense-in-depth
principle, noting that the multiple safety systems shut the plant down and contained
most of its radiation. Persons who distrusted nuclear power prior to the accident
took an entirely different message from the same events, perceiving that those in
charge did not understand what was wrong or how to fix it and that catastrophe
was averted only by sheer luck.
3. THE SYSTEM DESTROYS TRUST
Thus far, the psychological tendencies that create and reinforce distrust in situ-
ations of risk have been discussed. Appreciation of those psychological principles
leads us toward a new perspective on risk perception, trust, and conflict. Conflicts
and controversies surrounding risk management are not due to public irrationality
or ignorance, but, instead, can be seen as expected side effects of these psychological
tendencies, interacting with a highly participatory democratic system of government,
and amplified by certain powerful technological and social changes in society. Tech
-
nological change has given the electronic and print media the capability (effectively
utilized) of informing us of news from all over the world, often right as it happens.
Moreover, just as individuals give greater weight and attention to negative events,
so do the news media. Much of what the media reports is bad (trust-destroying) news
(Lichtenberg and MacLean 1992). This is convincingly demonstrated by Koren and
Table 1 Judged Impact of a Trust-Increasing Event and a Similar Trust-Decreasing
Event
Impact on trust
Very Very
small powerful
1 2 3 4 5 6 7
Trust-increasing event
The county medical examiner
reports that the health of
people living near the plant
is better than average.
21.5 14.0 10.8 18.3 17.2 16.1 2.2
Trust-decreasing event
The county medical examiner
reports that the health of
people living near the plant
is worse than average.
3.0 8.0 2.0 16.0 21.0 26.0 24.0
Note: Cell entries indicate the percentage of respondents in each impact rating category.
From Slovic, P. (1993). Risk Analysis, 13, 675. With permission.
L1130chIII.1.fm Page 242 Friday, September 3, 2004 4:41 PM
© 1997 by CRC Press, Inc.
Klein (1991), who compared the rates of newspaper reporting of two studies, one
providing bad news and one good news, published back to back in the March 20,
1991 issue of the Journal of the American Medical Association. Both studies exam
-
ined the link between radiation exposure and cancer. The bad news study showed
an increased risk to leukemia in white men working at the Oak Ridge National
Laboratory in Oak Ridge, TN. The good news study failed to show an increased risk
of cancer in people residing near nuclear facilities. Koren and Klein found that
subsequent newspaper coverage was far greater for the study showing increased risk.
The second important change, a social phenomenon, is the rise of powerful
special interest groups, well funded (by a fearful public) and sophisticated in
using their own experts and the media to communicate their concerns and their
distrust to the public in order to influence risk policy debates and decisions (Wall
Street Journal 1989). The social problem is compounded by the fact that we
tend to manage our risks within an adversarial legal system that pits expert vs.
expert, contradicting each other’s risk assessments and further destroying public
trust.
The young science of risk assessment is too fragile, too indirect, to prevail in
such a hostile atmosphere. Scientific analysis of risks cannot allay our fears of low-
probability catastrophes or delayed cancers unless we trust the system. In the absence
of trust, science (and risk assessment) can only feed distrust by uncovering more
bad news. A single study demonstrating an association between exposure to chem
-
icals or radiation and some adverse health effect cannot easily be offset by numerous
studies failing to find such an association. Thus, for example, the more studies that
are conducted looking for effects of electric and magnetic fields or other difficult-
to-evaluate hazards, the more likely it is that these studies will increase public
concerns, even if the majority of these studies fail to find any association with ill
health (MacGregor et al. 1994, Morgan et al. 1985). In short, risk assessment studies
tend to increase perceived risk.
In sum, the failures of risk management point strongly to the erosion of trust,
both in government and in many of our social institutions, as an important causal
factor in the conflicts that exist between the community of risk experts and the
public. Proposed solutions to the distrust of risk management tend to follow two
directions. One path that has been advocated by a number of researchers is to work
toward increasing public trust in risk management. This chapter has discussed
research that has been conducted in this spirit. While it is much too soon to express
either optimism or pessimism about the likely success of this strategy, it is a
significantly challenging problem that at the moment appears to have no easy
answers.
A second path leads in the direction of developing risk management processes
that do not rely on trust or rely on it only minimally. Though it is seldom acknowl
-
edged explicitly, many of the steps currently being taken by government and
industry to involve the public through community advisory panels and the like
are, in effect, establishing layers of oversight such that the checks-and-balances
principles inherent in democratic governments are instituted within technological
risk management. This may be a fruitful avenue to pursue, and research along
these lines is certainly needed.
L1130chIII.1.fm Page 243 Friday, September 3, 2004 4:41 PM
© 1997 by CRC Press, Inc.
ACKNOWLEDGMENT
Preparation of this paper was supported by the Electric Power Research Institute
and the National Science Foundation under Grant No. SES-91-10592.
REFERENCES
Barke, R., Jenkins-Smith, H., and Slovic, P. (1995). Risk Perceptions of Men and Women
Scientists, Report No. 95-6. Eugene, OR: Decision Research.
Efron, E. (1984). The Apocalyptics. New York: Simon & Schuster.
Fessendon-Raden, J., Fitchen, J. M., and Heath, J. S. (1987). Providing risk information in
communities: Factors influencing what is heard and accepted. Science Technology and
Human Values, 12, 94–101.
Flynn, J., Burns, W., Mertz, C. K., and Slovic, P. (1992). Trust as a determinant of opposition
to a high-level radioactive waste repository: Analysis of a structural model. Risk Analysis,
12, 417–430.
Flynn, J., Slovic, P., and Mertz, C. K. (1995). Gender, race, and perception of environmental
health risks. Risk Analysis, 14(6), 1101–1108.
Koren, G., and Klein, N. (1991). Bias against negative studies in newspaper reports of medical
research. Journal of the American Medical Association, 266, 1824–1826.
Kraus, N., Malmfors, T., and Slovic, P. (1992). Intuitive toxicology: Expert and lay judgments
of chemical risks. Risk Analysis, 12, 215–232.
Lichtenberg, J., and MacLean, D. (1992). Is good news no news? The Geneva Papers on Risk
and Insurance, 17, 362–365.
MacGregor, D., Slovic, P., and Morgan, M. G. (1994). Perception of risks from electromag-
netic fields: A psychometric evaluation of a risk-communication approach. Risk Analysis,
14 (5), 815–828.
McCallum, D. B., Hammond, S. L., Morris, L. A., and Covello, V. T. (1990). Public knowledge
and perceptions of chemical risks in six communities (Report No. 230-01-90-074).
Washington, D.C.: U. S. Environmental Protection Agency.
Morgan, M. G., Slovic, P., Nair, I., Geisler, D., MacGregor, D., Fischhoff, B., Lincoln, D.,
and Florig, K. (1985). Powerline frequency electric and magnetic fields: A pilot study
of risk perception. Risk Analysis, 5, 139–149.
Perrow, C. (1984). Normal Accidents: Living with High-Risk Technologies. New York: Basic
Books.
Pijawka, D., and Mushkatel, A. (1992). Public opposition to the siting of the high-level nuclear
waste repository: The importance of trust. Policy Studies Review, 10(4), 180–194.
Slovic, P. (1986). Informing and educating the public about risk. Risk Analysis, 4, 403–415.
Slovic, P. (1987). Perception of risk. Science, 236, 280–285.
Slovic, P. (1990). Perception of risk from radiation. In W. K. Sinclair (Ed.), Proceedings of
the Twenty-Fifth Annual Meeting of the National Council on Radiation Protection and
Measurements. Vol 11: Radiation protection today: The NCRP at sixty years (pp. 73–97).
Bethesda, MD: NCRP.
Slovic, P. (1993). Perceived risk, trust, and democracy: A systems perspective. Risk Analysis,
13, 675–682.
Slovic, P., Fischhoff, B., and Lichtenstein, S. (1985). Characterizing perceived risk. In Perilous
Progress: Technology as Hazard. R. W. Kates, C. Hohenemser, and J. X. Kasperson
(Eds.), (pp. 91–123). Boulder, CO: Westview.
L1130chIII.1.fm Page 244 Friday, September 3, 2004 4:41 PM
© 1997 by CRC Press, Inc.
Slovic, P., Flynn, J., Johnson, S., and Mertz, C. K. (1993). The dynamics of trust in situations
of risk (Report No. 93-2). Eugene, OR: Decision Research.
Slovic, P., Flynn, J., and Layman, M. (1991). Perceived risk, trust, and the politics of nuclear
waste. Science, 254, 1603–1607.
Starr, C. (1985). Risk management, assessment, and acceptability. Risk Analysis, 5, 97–102.
Wall Street Journal. (1989, October 3). How a PR firm executed the Alar scare, pp. A1–A3.
QUESTIONS
1. Name three factors that may be causing perceptions of risk to increase in recent
years.
2. According to psychometric studies, how do experts and laypersons tend to differ
in their perceptions of risk?
3. What data suggest the influence of sociopolitical factors on perceptions of risk?
4. Why is it unlikely that an agency such as DOE could restore the public’s trust in
its ability to manage the nation’s radioactive waste?
L1130chIII.1.fm Page 245 Friday, September 3, 2004 4:41 PM
L1130chIII.1.fm Page 246 Friday, September 3, 2004 4:41 PM
© 1997 by CRC Press, Inc.
CHAPTER III.2
The Insurability of Risks*
Howard Kunreuther and Paul K. Freeman
SUMMARY
This chapter examines two broad conditions for a risk to be insurable. Condition
1 requires the insurer to set a pure premium by quantifying the frequency and
magnitude of loss associated with specific events associated with the risk. Condition
2 specifies a set of factors, such as adverse selection, moral hazard, and degree of
correlated risk, that need to be taken into account when the insurer determines what
premium and type of coverage (maximum limits, nature of deductible) it wants to
offer. Finally, a risk is not insurable unless there is sufficient demand for the product
at some price to cover the upfront costs of developing the product and the expenses
associated with marketing policies.
Key Words: insurance, environmental risk, insurability conditions
1. INTRODUCTION
What does it mean to say that a particular risk is insurable? We must address
this question from the vantage point of the potential supplier of insurance. We will
be focusing on a standard contract between buyer and seller; the insurer offers
coverage against a specific risk at some premium R and the insured is protected
against a prespecified set of losses defined in the contract.
* The material on which this chapter is based draws heavily on Chapter 4 of a larger study by Paul
Freeman and Howard Kunreuther on “Insuring Environmental Risks,” to be published. Support from NSF
Grant #5-24603 to the Wharton Risk Management and Decision Processes Center, University of Penn
-
sylvania, Philadelphia, PA, is gratefully acknowledged.
© 1997 by CRC Press, Inc.
2. TWO INSURABILITY CONDITIONS
Two conditions must be met before insurance providers are willing to provide
coverage against an uncertain event. Condition 1 is the ability to identify and,
possibly, quantify the risk. The insurer must know that it is possible to estimate what
losses they are likely to incur when providing different levels of coverage. Condition
2 is the ability to set premiums for each potential customer or class of customers.
This requires some knowledge of the customer’s risk in relation to others in the
population of potentially insureds.
If Conditions 1 and 2 are both satisfied, a risk is considered to be insurable. But,
it still may not be profitable. In other words, it may not be possible to specify a rate
where there is sufficient demand to yield a positive profit from offering coverage.
In such cases, there will be no market for insurance.
2.1 Condition 1: Identifying the Risk
To satisfy this condition, estimates must be made of the frequency of specific
events occurring and the magnitude of the loss should the event occur. Three exam
-
ples illustrate the type of data that could be used to identify the risk. In some cases,
this may enable the insurer to specify a set of estimates on which to base an insurance
premium. In other cases, the data may be much less specific.
2.1.1 Fire
Rating agencies typically collect data on all the losses incurred over a period of
time for a particular risk and an exposure unit. Suppose the hazard is fire and the
exposure unit is a well-defined entity, such as $300,000 wood-frame homes of similar
design, to be insured for 1 year in California. The typical measurement is the pure
premium (PP), which is given by
PP = Total Losses/Exposure Unit* (1)
Assume that the rating agency has collected data on 100,000 wood-frame homes
in that state and has determined that the total annual losses from fires to these
structures over the past year is $20 million. If these data are representative of the
expected loss to this class of wood-frame homes in California next year, then, using
Equation 1, PP is given by
PP = $20,000,000 / 100,000 = $200
This figure is simply an average. It does not differentiate between locations of
wood-frame homes in the state, the distance of each home from a fire hydrant, or
* The pure premium (PP) normally considers loss adjustment expenses for settling a claim. We will
assume that this component is part of total losses. For more details on calculating PPs see Launie et al.
(1986).
© 1997 by CRC Press, Inc.
the quality of the fire department serving different communities. All of these factors
are often taken into consideration by underwriters who set final rates by calculating
a premium that reflects the risk to particular structures.
2.1.2 Earthquakes
If there were considerable data available on annual damage to wood-frame homes
in California from earthquakes of different magnitudes, then a similar method to the
one described for fire could be used to determine the probability and magnitude of
loss.
Due to the infrequency of earthquakes and the relatively few number of homes
that have been insured against the earthquake peril, this type of analysis is not
feasible at this time. Insurance providers have to turn to scientific studies by seis
-
mologists, geologists, and structural engineers to estimate the frequency of earth-
quakes of different magnitudes, as well as the damage that is likely to occur to
different structures from such earthquakes.
Table 1 is a template indicating the type of information that would have to be
collected to determine the PP for a wood-frame house subject to earthquake damage
in California. The first column (Event) reflects one way of calculating the severity
of an earthquake occurring, i.e., the modified Mercalli intensity scale. The second
column (Probability) specifies the annual probability (p
i
) of a wood-frame home in
California being damaged in an earthquake. The third column (Loss) is the amount
of damage an earthquake might cause to a wood-frame home.
If all these data are available from scientific studies, the PP in this case would
be equivalent to the expected loss (E(L)) which is given by
E(L) = p
i
× L
i
(2)
Over the past 20 years, seismologists have determined certain factors that will
influence the probability of an earthquake in a specific area, but they are still
uncertain as to how they interact with each other and their relative importance.
* At
Table 1 Calculating Annual Pure Premium from
Scientific Data for Earthquake Damage
to Wood-Frame Homes in California
Probability Loss
Event
a
(p
i
) (L
i
)
IV
V
VI
VII
VIII
IX
X
a
Based on the modified Mercalli Intensity Scale.
© 1997 by CRC Press, Inc.
the same time, there has been considerable damage data collected by engineers since
the Alaskan earthquake of 1964, which has increased our understanding of the
performance of various types of buildings and structures in earthquakes of different
magnitudes.
*
While seismologists and geologists cannot predict with certainty the probability
of earthquakes of different magnitudes occurring in specific regions of California,
they can provide conservative estimates of the risk. For example, it is possible to
develop worst-case scenarios for determining E(L) using Equation 2 by computing
E(L*) = p*
i
× L*
i
(3)
The factor p*
i
is the maximum credible probability assigned by seismologists to
an earthquake of intensity i. The factor L*
i
represents engineers best estimates of
the maximum likely damage to a wood-frame house in such an earthquake. Using
the estimate from Equation 3 as a basis for calculating a PP, the damage to wood-
frame homes from earthquakes becomes a quantifiable risk.
2.1.3 Underground Storage Tanks (USTs)
Suppose that an insurer was attempting to estimate the PP for a new technological
advance, such as an improved design for USTs. Since there are no historical data
associated with the risk, the insurer would have to rely on scientific studies to
estimate the probabilities (p
i
) and cleanup costs (L
i
) associated with a particular type
of defect i in the tank that causes a leak.
To the extent that the insurer has confidence in these scientific estimates of the
performance of the tank and the costs of the cleanup from leaks of different mag
-
nitudes, it should be able to quantify the risk and calculate a PP. If, on the other
hand, the insurer is uncertain about the frequency or loss estimates, it may conclude
that the risk cannot be quantified and hence is uninsurable.
2.2 Condition 2: Setting Premiums for Specific Risks
Once a PP is determined using one of the methods specified, the insurer can
determine what rate it needs to charge in order to make a profit by providing coverage
against specific risks. There are a number of factors that come into play in deter
-
mining this dollar figure.
2.2.1 Ambiguity of Risk
Not surprisingly, the higher the uncertainty regarding the probability of a specific
loss and its magnitude, the higher the premium will be. As shown by a series of
empirical studies, actuaries and underwriters are so ambiguity averse and risk averse
* Some of these factors are the time elapsed since the last earthquake, tilting of the land surface,
fluctuations in the magnetic field, and changes in the electrical resistance of the ground.
* An Office of Technology Assessment (1995) report provides a detailed discussion on the state of the
art of earthquake risk assessment and a comprehensive set of references.
© 1997 by CRC Press, Inc.
that they tend to charge much higher premiums than if the risk were well specified.*
A questionnaire was mailed to 896 underwriters in 190 randomly chosen insurance
companies to determine what PPs
** they would set for either an earthquake or
leaking UST risk. The earthquake scenario involved insuring a factory against
property damage from a severe earthquake. The UST scenario involved liability
coverage for owners of a tank containing toxic chemicals against damages if the
tank leaks. A neutral risk scenario acted as a reference point for the two context-
based scenarios. It simply provided probability and loss estimates for an unnamed
peril.
For each scenario, four cases were presented, reflecting the degree of ambiguity
and uncertainty surrounding the probability and loss as shown in Table 2. A well-
specified probability (p) refers to a situation in which there are considerable past
data on a particular event that enable “all experts to agree that the probability of a
loss is p.” An ambiguous probability (Ap) refers to the case where “there is wide
disagreement about the estimate of p and a high degree of uncertainty among the
experts.” A known loss (L) indicates that all experts agree that if a specific event
occurs, the loss will equal L. An uncertain loss (UL) refers to a situation where the
experts’ best estimate of a loss is L, but estimates range from L
min
to L
max
.
Case 1 reflects well-known risks for which large, actuarial databases exist, e.g.,
life, automobile, and fire insurance. Satellite accidents are an example of a Case 2
risk, since there is normally considerable uncertainty regarding the chances of their
occurrence. If they do happen, the satellite is destroyed and the loss is well specified.
Playground accidents illustrate Case 3 since there are good data on the chances of
an accident occurring, but considerable uncertainty as to the magnitude of the
liability award should a person be injured or killed. Finally, there is considerable
ambiguity and uncertainty related to earthquakes and UST risks, so they are illus
-
trative of Case 4.
In the questionnaire to the underwriters, Case 1 was represented by providing a
well-specified probability (e.g., p = .01) and a well-specified loss (e.g.,
L
= $1 million). The other three cases introduced ambiguity and uncertainty into the
* For more details on the survey and the analysis of findings, see Kunreuther et al. 1995.
** The questionnaire instructions stated that PPs should exclude “loss adjustment expenses, claims
expenses, commissions, premium taxes, defense costs, profits, investment return and the time valuation
of money.”
Table 2 Classification of Risks by Degree of Ambiguity
and Uncertainty
Loss
Probability Known Unknown
Case 1 Case 3
Well specified p, L p, UL
Life, auto, fire Playground accidents
Case 2 Case 4
Ambiguous Ap, L Ap, UL
Satellite, new products Earthquake, USTs
© 1997 by CRC Press, Inc.
picture. For the case where L = $1 million, the uncertain estimates ranged from L
= $0 to L = $2 million.
One hundred and seventy-one completed questionnaires (19.1% of the total
mailed) were received from 43 insurance companies (22.6% of those solicited).
Table
3 shows the ratio of the average PP that underwriters would want to charge
for each of the three cases where there is uncertainty and ambiguity in either p
and/or L in relation to the average PP they specified for a risk that is well specified
(Case 1). The data reveal that underwriters will want to charge a much higher
premium when there is ambiguity and uncertainty regarding probabilities and/or
losses. For example, as shown in Table 3, the premium for the Case 4 earthquake
scenario was 1.5 times higher than for the well-specified Case 1 scenario.
Why do actuaries and underwriters price uncertain and ambiguous risks higher
than well-specified risks? In two very insightful papers, Stone (1973a,b) indicates
that, in setting premiums for any particular risk, insurers are motivated by the impact
that their actions will have on the stability and solvency of their firm. Stability is
measured by the loss ratio (LR), i.e., paid losses/written premiums, for a particular
risk. Stability requires a probability less than some specified level p′ (e.g., p′ =
.05) that the loss ratio exceeds a certain target level LR* (e.g., LR* = 1).
Solvency is measured by the survival constraint that relates aggregate losses for
the risk in question to the current surplus plus premiums written. It requires that the
probability of insolvency be less than p′′ (e.g., p′′ = 1 in 100,000). Berger and
Kunreuther (1995) have shown that, if underwriters and actuaries are mindful of the
two constraints of stability and solvency, they will set higher premiums as specific
risks become more ambiguous and uncertain.
2.2.2 Adverse Selection
If the insurer cannot distinguish between the probability of a loss for good and
bad risk categories, it faces the problem of adverse selection. What this means is that,
if the insurer sets a premium based on the average probability of a loss using the
Table 3 Ratio of Average Pure Premiums Specified by
Underwriters Relative to a Well-Specified Case
(Case 1) (p = .01, L = $1 million)
p, L Ap, L p, UL Ap, UL
Scenario Case 1 Case 2 Case 3 Case 4
Neutral 1 1.5 1.1 1.7
(N = 24)
a
Earthquake 1 1.2 1.3 1.5
(N = 23)
UST 1 1.5 1.4 1.8
(N = 32)
a
N = Number of respondents.
Data from Kunreuther et al. (1995).
© 1997 by CRC Press, Inc.
entire population as a basis for this estimate, only the bad risks will want to purchase
coverage. As a result, the insurer will expect to lose money on each policy that is sold.
The assumption underlying adverse selection is that purchasers of insurance have
an informational advantage by knowing their risk type. Insurers, on the other hand,
must invest considerable expense to collect information to distinguish between risks.
A simple example illustrates the problem of adverse selection for a risk where the
probabilities of a loss are p
G
= .1 (good risks) and p
B
= .3 (bad risks). For simplicity,
assume that the loss is L = $100 for both groups and that there are an equal number
of potentially insurable individuals (N = 50) in each risk class. Table 4 summarizes
these data.
In the example in Table 4, the expected loss for a random individual in the
population is 20.
* If the insurer charged an actuarially fair premium across the entire
population, only the bad risk class would normally purchase coverage, since their
expected loss is 30 [.3(100)] and they would be pleased to pay only 20 for insurance.
The good risks have an expected loss of 10 [.1(100)], so they would have to be
extremely risk averse to be interested in paying 20 for coverage. When only the
poor risks purchase coverage, the insurer would suffer an expected loss of –10 (20
– 30) on every policy it sold.
There are two principal ways that insurers can deal with this problem. If the
company knows the probabilities associated with good and bad risks, but does not
know the characteristics of the individuals, it can raise the premium to at least 30
so that it will not lose money on any individual purchasing coverage. In reality,
where there is a spectrum of risks, the insurer may only be able to offer coverage
to the worst risk class in order to make a profit. Hence, raising premiums is likely
to produce a market failure in that very few of the individuals who are interested in
purchasing coverage to cover their risk will actually do so at the going rate.
A second way for the insurer to deal with adverse selection is to offer two
different price-coverage contracts. Poor risks will want to purchase contract 1 and
good risks will purchase contract 2.
** For example, contract 1 could be offered at
price = 30 and coverage = 100, while contract 2 could be price = 10 and coverage
= 40. If the good risks preferred contract 1 over contract 2 and the poor risks preferred
contract 2 over contract 1, this would be one way for the insurers to market coverage
to both groups while still breaking even.
Finally, the insurer could require some type of audit or examination to determine
the nature of the risk more precisely. In the case of property, the audit could take
the form of an inspection of the structure and its contents. For individuals, it could
be some type of an examination, e.g., a medical exam if health insurance were being
Table 4 Data for Adverse Selection Example
Good risks p
G
= .1 L = 100 N = 50
Bad risks p
B
= .3
L = 100 N = 50
* The expected loss for a random individual in the population is calculated as follows: [50(.1)(100) +
50(.3)(100)] / 100 = 20.
** This solution has been proposed by Rothschild and Stiglitz (1976).
© 1997 by CRC Press, Inc.
offered. Certain types of coverage may not lend themselves to an exam, however,
due to the nature of the risk. It is difficult to test a person for driving ability, for
example, although past records and experience may be useful indicators as to whether
a person is a good or bad risk.
Finally, it is important to remember that the problem of adverse selection only
emerges if the persons considering the purchase of insurance have more accurate
information on the probability of a loss than the firms selling coverage. If the
customers have no better data than the underwriters, both groups are on an equal
footing. Coverage will be offered at a single premium based on the average risk,
and both good and poor risks will want to purchase policies.
2.2.3 Moral Hazard
Providing insurance protection to an individual may serve as an incentive for
that person to behave more carelessly than before he/she had coverage. If the insurer
cannot predict this behavior and relies on past loss data from uninsured individuals
to estimate rates, the resulting premium is likely to be too low to cover losses.
The moral hazard problem is directly related to the difficulty in monitoring and
controlling behavior once a person is insured. How do you monitor carelessness?
Can you determine when a person decides to collect more on a policy than he/she
deserves, e.g., making false claims or moving old furniture to the basement just
before a flood hits the house?
The numerical example used previously to illustrate adverse selection can also
demonstrate moral hazard. With adverse selection, the insurer cannot distinguish
between good and bad risks. Moral hazard is created because the insurer must
estimate the premium based on the probability of a loss before insurance is pur
-
chased, but the actual probability of a loss is much higher after a policy is sold.
Table 5 depicts these data for the case in which there are 100 individuals, each of
whom face the same loss of 100. The probability of a loss, however, increases from
p = .1 before insurance to p = .3 after coverage has been purchased.
If the insurance company does not know that moral hazard exists, it will sell
policies at a price of 10 to reflect the estimated actuarial loss (.1 × 100). The expected
loss will be 30, since p increases to .3. Therefore, the firm will lose 20 (10 – 30)
on each policy it sells.
One way to avoid the problem of moral hazard is to raise the premium to 30 to
reflect the increase in the probability (p) that occurs once a policy has been pur
-
chased. In this case, there will not be a decrease in coverage as there was in the
adverse selection example. Those individuals willing to buy coverage at a price of
10 will still want to buy a policy at 30 since they know that their probability of a
loss with insurance is .3.
Table 5 Data for Moral Hazard Example
Before insurance p = .1 L = 100 N = 100
After insurance p = .3 L = 100 N = 100
© 1997 by CRC Press, Inc.
Another way to avoid moral hazard is to introduce deductibles and coinsurance
as part of the insurance contract. A deductible of D dollars means that the insured
party must pay the first D dollars of any loss. If D is sufficiently large, there will
be little incentive for the insureds to behave more carelessly than prior to purchasing
coverage because they will be forced to cover a significant portion of the loss
themselves.
A related approach is to use coinsurance — the insurer and the firm share the
loss together. An 80% coinsurance clause in an insurance policy means that the
insurer pays 80% of the loss (above a deductible) and the insured pays the other
20%. As with a deductible, this type of risk sharing encourages safer behavior
because the insureds want to avoid having to pay for some of the losses.
*
A fourth way of encouraging safer behavior is to place upper limits on the amount
of coverage an individual or enterprise can purchase. If the insurer will only provide
$500,000 worth of coverage on a structure and contents worth $1 million, then the
insured knows he/she will have to incur any residual costs of losses above
$500,000.
**
Even with these clauses in an insurance contract, the insureds may still behave
more carelessly than if they did not have coverage, simply because they are protected
against a large portion of the loss. For example, they may decide not to take
precautionary measures that would otherwise have been adopted had they not pur
-
chased insurance. The cost of these measures may now be viewed as too high relative
to the dollar benefits that the insured would receive from this investment.
If the insurer knows in advance that an individual will be less interested in loss
reduction activity after purchasing a policy, then it can charge a higher insurance
premium to reflect this increased risk or require specific protective measure(s) as a
condition of insurance. In either case, this aspect of the moral hazard problem will
have been overcome.
2.2.4 Correlated Risk
By correlated risks we mean the simultaneous occurrence of many losses from
a single event. Natural disasters, such as earthquakes, floods, and hurricanes, illus
-
trate cases where the losses in a community are highly correlated: many homes in
the affected area are damaged and destroyed by a single event.
If a risk-averse insurer faces high correlated risks from one event, it may want
to charge a higher premium to protect itself against the possibility of experiencing
catastrophic losses. An insurer will face this problem if it has too many eggs in one
basket, such as mainly providing earthquake coverage to homes in Los Angeles
county rather than diversifying across the entire state of California.
To illustrate the impact of correlated risks on the distribution of losses, assume
that there are two policies sold against a risk where p = .1 and L = 100. The actuarial
* More details on the role of deductibles and coinsurance to reduce the chances of moral hazard can be
found in Pauly (1968).
** We are assuming that the firm will not be able to purchase a second insurance policy for $500,000
to supplement the first one and, hence, be fully protected against a loss of $1 million (except for
deductibles and coinsurance clauses).
© 1997 by CRC Press, Inc.
loss for each policy is 10. Table 6 depicts the probability distribution of losses for
the two policies when the losses are independent of each other and when they are
perfectly correlated.
The expected loss for both the correlated and uncorrelated risks is 20. However,
the variance will always be higher for correlated than uncorrelated risks which have
the same expected loss. Risk-averse insurers will always want to charge a higher
premium for the correlated risk.
Empirical data on the impact of correlated risks on premium-setting behavior
comes from a mail survey of professional actuaries who were members of the
Casualty Actuarial Society. Of the 1165 individuals who were sent questionnaires,
463 (or 40%) returned valid responses. Each of the actuaries evaluated several
scenarios involving hypothetical risks, where the probability of a loss was either
known or ambiguous.
One of these scenarios involved a manufacturing company that wants to deter-
mine the price of a warranty to cover the $100 cost of repairing a component of a
personal computer. Each actuary was asked to specify premiums for both nonam
-
biguous and ambiguous probabilities when losses were either independent or per-
fectly correlated and p = .001, .01, and .10. Table 7 presents the ratios of premiums
for correlated risks to independent risks for well-specified and ambiguous probabil
-
ities using median estimates of the actuaries’ recommended premiums. If the actu-
aries perceived no differences between the independent and correlated risks, the
ratios would all be 1.
The data reveals a very different story. The median premiums were always higher
for the correlated risks except for the case where p = .001 and the probability is
well specified. The ratios were noticeably higher when the probabilities were ambig
-
uous. In fact, when p = .01, the ratio of median premiums was more than 5.5 times
larger for a correlated risk than for an independent risk.
Table 6 Data for Correlated Risk Example
Risks L = 0 L = 100 L = 200
Independent p = .81 p = .18 p = .01
Perfectly correlated p = .9 p = .1
Table 7 Ratio of Premiums for Correlated Risks
to Independent Risks for Scenarios with
Nonambiguous (p) and Ambiguous
Probabilities (Ap)
a
Probability level
Nature of probability .001 .010 .100
Well specified (p) .910 1.160 1.250
Ambiguous (Ap) 2.000 5.560 2.000
a
100,000 units insured; L = $100.
Data from Hogarth and Kunreuther (1992).