INTERFACIAL APPLICATIONS IN ENVIRONMENTAL ENGINEERING - CHAPTER 10 pptx
Bạn đang xem bản rút gọn của tài liệu. Xem và tải ngay bản đầy đủ của tài liệu tại đây (585.85 KB, 28 trang )
10
Effectiveness of Carbon Nanofibers
in the Removal of Phenol-Based
Organics from Aqueous Media
COLIN PARK Synetix, Billingham, United Kingdom
MARK A. KEANE University of Kentucky, Lexington, Kentucky, U.S.A.
I. BACKGROUND: THE ENVIRONMENTAL
DIMENSION
A significant increase in public awareness and concern over global and local
pollution has been prompted, at least in part, by the ever-growing evidence of
environmental degradation. Air and water pollution constitute the two most prev-
alent forms, and volatile organic compounds (VOCs) have been identified as
major contributors to the decline in air and water quality [1,2]. Volatile organic
compounds enter the environment as a result of vehicle exhaust and industrial
process emissions (oil refining, solvent usage in painting and printing, etc.) [3].
Phenol and chlorophenol(s) epitomize a class of particularly hazardous chemicals
that are commonly found in industrial wastewater, notably from herbicide and
biocide plants [3]. The proliferation of phenolic waste has meant that the respon-
sible handling/treatment of such toxic material is now of high priority. Chemical
spills may be much smaller than oil spills, but they can still be devastating in
their impact. Such was the case in June 2001 with a phenol spill in Singapore’s
Jahor Strait, both one of the busiest seaways in the world and home to many
commercial fish farms. An Indonesian-registered ship, the Endah Lestari, cap-
sized in the strait between Malaysia and Singapore, releasing its cargo of 630
tons of phenol. While salvage activities took effect immediately to pump phenol
from the damaged vessel, the phenol that had been leaked killed most marine
life within 2 km of the ship. Phenol, a corrosive and severe skin irritant on land,
also attacks gill tissues of fish when dispersed in water.
There are numerous methodologies in operation at this time to combat the
problem of VOC pollution. The most frequently applied techniques are centered
TM
Copyright n 2003 by Marcel Dekker, Inc. All Rights Reserved.
166 Park and Keane
on incineration, absorption/adsorption, condensation, and biological treatment
[1–7]. Incineration, which is the most widespread strategy for waste disposal (as
opposed to treatment) has been heavily criticized in terms of cost and dioxin/
furan formation downstream of the oxidation zone. Combustion, as a destructive
methodology, does not demonstrate an efficient management of resources and,
even if fully effective, releases unwanted carbon dioxide into the environment.
Although biological oxidation can be effective when dealing with biodegradable
organics, chloroarenes are used in the production of herbicides and pesticides
and, as such, are very resistant to biodegradation. Conversion of halogenated
feedstock, where feasible, is in any case very slow, necessitating the construction
of oversized and expensive bioreactors.
II. POLLUTANT ABATEMENT USING CARBON
ADSORBENTS
Adsorption is perhaps the most widely employed nondestructive strategy, offer-
ing the possibility of VOC recovery. The adsorption of phenol, and chlorophe-
nol(s) to a lesser extent, from aqueous media on various forms of amorphous
carbon has been the focus of a number of studies published in the open literature
[8–13]. Regeneration of the adsorbent, i.e., desorption of the organic pollutant,
is usually carried out either by heating the adsorbent or by stripping with steam
[6,14–17]. The uptake of VOCs, in general, from gas or liquid streams can, how-
ever, call on a variety of solid adsorbents, ranging from macroporous polymeric
resins [18–22], mesoporous silica–based MCM-41 materials [23–25], and micro-
porous zeolites [20,26,27] to carbons [28–35]. Currently, carbon is by far the
preferred adsorbent, and it is generally derived from either a selection of natural
products, e.g., coal, wood, peanut shells, and fruit stones or can be generated
from a catalytic decomposition of a range of organics [10,36–41]. Carbon adsor-
bents find widespread use because they can be readily and precisely function-
alized, often by simple yet effective chemical treatments, to meet various de-
mands, e.g., surface oxidation by a gentle thermal oxygen treatment to aid mixing
in aqueous media [42–45]. The importance of parameters such as solute concen-
tration, solution pH, and adsorbent porosity/surface area in governing ultimate
VOC uptake has been established [9,10,28,32,33,35,46]. The standard activated
(amorphous) carbons do not perform well under “wet” conditions or when treat-
ing aqueous streams, and they exhibit indiscriminate adsorption. The uptake of
both the contaminant and water molecules decreases the available volume for
adsorption, limiting uptake effectiveness [47–57]. The adsorption of water on
the surface is driven mainly by hydrogen binding interactions, e.g., the presence
of certain surface functionalities: O, OH, and Cl can act as nucleation sites and/
or adsorption sites, resulting in the formation of adsorbed water clusters. Phillips
TM
Copyright n 2003 by Marcel Dekker, Inc. All Rights Reserved.
Carbon Nanofibers and Removal of Toxic Phenolics 167
and co-workers, in a series of studies [47,58–60], highlighted the complex rela-
tionship between the nature of the adsorbent surface and the uptake capacity and
mechanism of adsorption. These authors, using a combination of microcalorime-
try and adsorption techniques, demonstrated that hydrophobic carbon surfaces
adsorb very small amounts of water, primarily by physisorption. In contrast, oxy-
genated carbon surfaces exhibit a significant capacity for water uptake [52–
54,58–60]. The adsorption of methanol/water mixtures in activated carbon pores
was studied using Monte Carlo simulations by Shevade and co-workers at ambi-
ent temperature [51]. The findings of this work suggest that water is preferentially
adsorbed over methanol in the pores of a carbon surface functionalized by car-
boxyl groups. The hydrophilic nature of the carbon results in a complexation of
both the water and methanol and a nonselective uptake [47–55]. Nevskaia and
co-workers, using a commercially available activated carbon, found that an indis-
criminate adsorption capacity could be inhibited somewhat by a HNO
3
treatment
[61].
Moreover, recovery of the “loaded” carbon from the treated water can be
problematic. Activated carbon is typically supplied in the form of a powder, and
loss of fine particulates is often unavoidable but can be circumvented by addi-
tional (membrane) filtration. The major advantage of the activated/amorphous
carbon that overrides such drawbacks is the high overall uptake that is synony-
mous with this material [62]. Indeed, a fibrous form of activated carbon has
been manufactured that exhibits a greater adsorption capacity than the granu-
lated form for the removal of liquid pollutants [39,63,64]. It has been claimed
that the fibrous material is particularly selective for the adsorption of low-
molecular-weight compounds, a feature that is linked to the molecular size of
the organic adsorbate [32]. Graphite, on the other hand, the highly uniform and
ordered form of carbon possesses delocalised π-electrons on the basal planes.
This property imparts a weakly basic character that, in consort with its hy-
drophobic nature, allows selective VOC adsorption, but the characteristic low
surface area/mass ratios (Ͻ20 m
2
g
Ϫ1
) results in lower overall uptake values
[47,65–68]. One significant disadvantage of using activated carbon (or graphite)
is the difficulty associated with separation from the solute; the fine carbon parti-
cles require a prolonged settling period to facilitate phase separation. Con-
versely, operation of a continuous-flow separation process, employing a fixed
bed of activated carbon, although highly effective, is hampered by the associ-
ated high back-pressures. Maintenance of a constant flow is energy demanding,
and flow disruptions/plugging can impair an effective processing of contami-
nant streams. A significant improvement in existing activated carbon–based
VOC treatments would result from the development of an adsorbent that: (1) is
readily separated from the solute, (2) exhibits high mechanical strength, (3) is
resistant to crushing/attrition, and (4) delivers uptake values comparable with
those of activated carbon.
TM
Copyright n 2003 by Marcel Dekker, Inc. All Rights Reserved.
168 Park and Keane
III. APPLICATION OF CARBON NANOFIBERS
An ideal carbon adsorbent is one that encompasses the favorable aspects of both
graphite (selective adsorption) and amorphous carbon (high uptake) combined
with a facile separation from the treated phase. One possible material that may
fall into this category is the catalytically generated carbon nanofiber. Carbon is
unique in that it can bond in different ways to create structures with quite dissimi-
lar properties. Carbon fibers are generally classified as graphitic structures, char-
acterized by a series of ordered parallel graphene layers arranged in specific con-
formations with an interlayer distance of ca. 0.34 nm [69]. The direct synthesis
of graphitic carbon fibers/filaments is possible by arc discharge and plasma de-
composition, but such methodologies also yield polyhedron carbon nanoparticles
(low aspect ratio) and an appreciable amorphous carbon component [70,71]. The
latter necessitates an additional involved, cumbersome, and costly purification
stage in order to extract the desired structured carbon. The generation of ordered
carbon structures with different mechanical/chemical/electrical properties under
milder conditions by catalytic means is now emerging as a viable lower-cost
route [72]. The carbon product can be tailor-made to desired specifications by
the judicious choice of both catalyst and reaction conditions. The pioneering stud-
ies by Baker, Rodriguez and co-workers [73–80] and Geus et al. [81–86] have
established conditions and catalysts by which structured carbon with specific lat-
tice orientations and properties can be prepared with a high degree of control.
Much of the pertinent literature on the catalytic growth of carbon nanofibers,
from its beginnings to the present day, has been the subject of five detailed review
articles [73,77,87–89] that summarize the various aspects associated with the
growth phenomena.
The applicability of these novel carbon materials as VOC adsorbents has yet
to be established. In this chapter, we present the results of an evaluation of the
performance of highly ordered carbon nanofibers to remove phenol and chloro-
phenol(s), as established VOC pollutants, from water. We adopted the decompo-
sition of ethylene over supported and unsupported nickel catalysts as the synthesis
route to generate carbon nanofibers of varying overall dimension and lattice orien-
tations. The uptake measurements on commercially available activated carbon
and graphite serve as a basis against which to assess the adequacy of the various
forms of catalytically generated carbon nanofibers.
IV. EXPERIMENTAL PROCEDURES
A. Catalytic Production of Carbon Nanofibers
The catalytic growth of fibrous carbon adsorbents was carried out using both
unsupported and supported Ni and Cu/Ni catalysts. The unsupported Ni and Cu/
TM
Copyright n 2003 by Marcel Dekker, Inc. All Rights Reserved.
Carbon Nanofibers and Removal of Toxic Phenolics 169
Ni catalysts were prepared by standard precipitation/deposition [90], where the
precipitate was thoroughly washed with deionized water and oven-dried at 383
K overnight. The precursor was calcined in air at 673 K for 4 h, reduced at 723
K in 20% v/v H
2
/He for 20 h, cooled to ambient temperature, and passivated in a
2% v/v O
2
/He mixture for 1 h. The supported Ni catalysts were prepared by
impregnating a range of supports to incipient wetness with a 2-butanolic solution
of Ni(NO
3
)
2
to realize a 10% w/w Ni loading; the catalyst precursor was dried,
activated and passivated as described previously. The substrates employed in this
study include commercially available SiO
2
,Ta
2
O
5
, and activated carbon. The
range of metal carriers used provides a range of Ni/support interaction(s) that
generate a variety of uniquely structured carbon materials. The Ni content was
determined to within Ϯ2% by atomic absorption spectrophotometry (VarianSpec-
tra AA-10), where the samples were digested in HF (37% conc.) overnight at
ambient temperature prior to analysis.
The procedure for the catalytic growth of carbon fibers has been discussed in
some detail elsewhere [38,91], but specific features that are pertinent to this study
are given here. Samples of the passivated catalysts were reduced in flowing 20%
v/v H
2
/He (100 cm
3
min
Ϫ1
) in a fixed-bed vertically mounted silica reactor to
the reaction temperature (798–873 K) and flushed in dry He before introducing
the C
2
H
4
/H
2
mixture (1/4 to 4/1 v/v mixtures). The production of fibers with the
desired dimensions/morphology and a particular predominant lattice orientation
is strongly dependent on the nature of the catalyst and reaction conditions, as
identified in Table 1. The catalyst/carbon was cooled to ambient temperature and
passivated in 2% v/v O
2
/He, and the gravimetric carbon yield was determined.
Graphite (Sigma-Aldrich, synthetic powder) and activated carbon (Darco G-60,
100 mesh) were used as benchmarks with which to assess the performance of
the catalytically generated carbon nanofibers. The carbonaceous adsorbents were
subjected to acid washing (HCl and HNO
3
) in order to remove the residual Ni
TABLE 1 Compilation of Catalysts and Reaction Conditions Used to Generate
Carbon Nanofibers of Varying Conformation and Average Diameter
Reaction Carbon Nanofiber
Nanofiber C
2
H
4
/H
2
temperature yield diameter
Catalyst conformation v/v (K) (g
c
g
cat
Ϫ1
) (nm)
Ni/SiO
2
Ribbon 1/4 848 1.8 15.8
Cu-Ni/SiO
2
Fishbone 1/4 798 2.8 13.2
Ni/Ta
2
O
5
Spiral 4/1 823 5.1 23.4
Ni/activated carbon Branched 1/1 823 3.7 38.3
Unsupported Ni Platelet/ribbon 1/1 873 7.3 114
Unsupported Cu/Ni Fishbone 1/1 823 9.8 121
TM
Copyright n 2003 by Marcel Dekker, Inc. All Rights Reserved.
170 Park and Keane
content. This acid treatment also served to introduce functional groups to the
carbon surface. Oda and Yokokawa reported that the adsorption capacity of an
activated carbon was intimately linked to the surface acidity of the adsorbent [92].
Carbon materials in their pristine form are hydrophobic in nature but, following
oxidative treatment, can develop some hydrophilic character [92–94]. The car-
bonaceous materials (treated with HNO
3
) were also subjected to a gentle oxida-
tive treatment by heating in 5% v/v O
2
/He (5 K min
Ϫ1
to 723–973 K); up to 5%
w/w carbon was oxidized/gasified in this step. In the case of the carbon nano-
fibers, an amorphous layer deposited during the cool-down stage of the reaction,
and this was removed in the secondary oxidation step. The latter should allow
greater access of the phenolic solutes to the ordered carbon layers/edge sites.
B. Characterization of Adsorbent Materials
The pertinent characteristics of the carbon adsorbents used in this study (fibrous,
graphite and activated carbon) were established using a variety of complementary
techniques. Tap bulk densities of the carbonaceous materials (as supplied/grown)
were calculated by weighing a known volume of gently compacted samples. Ni-
trogen BET surface area measurements (Omnisorb 100) were carried out at 77
K. Temperature-programmed oxidation (TPO) profiles were obtained from thor-
oughly washed, demineralized samples to avoid any possible catalyzed gasifica-
tion of carbon by residual metals. A known quantity (ca. 100 mg) of a demineral-
ized sample was ramped (25 K min
Ϫ1
) from room temperature to 1233 K in a
5% v/v O
2
/He mixture with on-line TCD analysis of the exhaust gas; the sample
temperature was independently monitored using a TC-08 data logger. The associ-
ated T
max
values corresponding to the major oxidation peaks are given in Table
2. High-resolution transmission electron microscopy (HRTEM) analysis was car-
ried out using a Philips CM200 FEGTEM microscope operated at an accelerating
voltage of 200 keV. The specimens were prepared by ultrasonic dispersion in
butan-2-ol, evaporating a drop of the resultant suspension onto a holey carbon
support grid. All gases [He (99.99%), C
2
H
4
(99.95%), H
2
(99.99%), and 5% v/v
O
2
/He (99.9%)] were dried by passage through activated molecular sieves before
use.
C. Uptake of Volatile Organic Compounds
1. Batch Adsorption Studies
Phenol and chlorophenol adsorption studies were conducted batchwise (298 K Ϯ
3 K) in 100-cm
3
-capacity polyethylene bottles, kept under constant agitation (Gal-
lenkamp gyratory shaker) at 100 rpm. The solutes were of high purity (Sigma-
Aldrich, 99ϩ%), and stock solutions were used to prepare the test samples by
TM
Copyright n 2003 by Marcel Dekker, Inc. All Rights Reserved.
Carbon Nanofibers and Removal of Toxic Phenolics 171
TABLE 2 Tap Densities, N
2
BET Surface Areas, and Characteristic TPO T
max
Values
Associated With “As-Grown”/Supplied (Catalytically Generated/Commercial) Carbon
Adsorbents
N
2
BET
Adsorbent Density Surface area TPO T
max
(catalyst) (g cm
Ϫ3
)(m
2
g
Ϫ1
)(K)
Activated carbon 0.35 625 848
Graphite 0.42 10 1233
Fishbone fibers 0.09 160 889, 1048
(Cu-Ni/SiO
2
)
Fishbone fibers 0.17 140 916
(unsupported Cu/Ni)
Platelet/ribbon 0.25 95 982, 1025
(unsupported Ni)
Ribbon fibers 0.38 110 1040, 1233
(Ni/SiO
2
)
Spiral fibers 0.39 80 838, 1064, 1126,
(Ni/Ta
2
O
5
) 1233
Branched carbon 0.49 230 872, 920, 1078,
(Ni/activated carbon) 1233
dilution in triply distilled deionized water. Uptake data were obtained at a con-
stant adsorbate-to-adsorbent ratio of 100 cm
3
g
Ϫ1
, in the absence of any buffered
pH control; maximum uptake was generally realized within 3–4 days. The solute
was routinely sampled (30 µL) and analyzed by HPLC (Jones chromatography)
using a mobile phase (1/1 v/v acetonitrile/water, HPLC grade, Sigma-Aldrich)
delivered at a constant rate (1 cm
3
min
Ϫ1
). Sample injection via a 20-µL-sample
loop onto a Genesis CII8 (7.5 ϫ 300 mm) column ensured that the presence
of any impurities in the feed was detected. Solute detection was by UV (Hitachi
Model L-4700 UV detector), with the optimum wavelength set at 280 nm. Data
acquisition and analysis were performed using the JCL 6000 (for Windows)
chromatography data package. Peak area was converted to concentration using
detailed calibration plots, with standards spanning the concentration range em-
ployed in this investigation. To ensure that adsorption on the polyethylene bottle
walls or adsorbate volatilization did not contribute to the overall uptake, solutions
of phenol and chlorophenol (in the absence of any adsorbent) were employed
as blanks under the same adsorption conditions. Solutions pH was monitored
continually for selected adsorbate/adsorbent systems by means of a data-logging
pH probe (Hanna Instrument programmable pH meter). The pH probe was cali-
TM
Copyright n 2003 by Marcel Dekker, Inc. All Rights Reserved.
172 Park and Keane
brated in the pH range 4–11 before the adsorption run and checked for reproduc-
ibility after the analysis period. A blank run was employed that involved pH
monitoring of the carbon in deionized water.
2. Semibatch Operation
Phenol removal as a function of time was investigated using a differential column
reactor. A stainless steel tube (
1
/4 inch o.d.) was packed with adsorbent, and the
phenol solution (1.2 mmol dm
Ϫ3
) was fed from a reservoir (1 L) using a Hitachi
Model L-7100 pump operating in the constant-flow mode; the pump delivered a
flow of 10 cm
3
min
Ϫ1
, regardless of the back-pressure. The adsorbent bed was
initially packed using compressed air to minimize the voidage and to facilitate
packing: adsorbent bed length ϭ 80 mm, bed volume ϭ 1.83 cm
3
, adsorbent
weight ϭ 0.2–0.9 g. Deionized water was first passed through the system and
the packed adsorbent bed to wet the adsorbent before the aqueous solution of
phenol was introduced. The exit stream was regularly sampled, using an on-line
sampling valve, to monitor phenol concentration as a function of time; analysis
was by HPLC, as described earlier.
V. RESULTS AND DISCUSSION
A. Characteristic Features of the Carbon Adsorbents
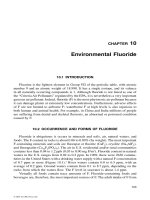
Representative transmission electron microscopy (TEM) images that illustrate
the structural characteristics of the catalytically generated carbon nanofibers are
shown in Figures 1 (unsupported catalyst) and 2 (supported catalysts). A simple
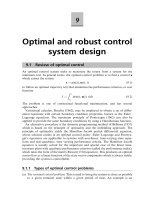
schematic representation of the “ribbon” and “fishbone” fiber structure is shown
in Figure 3 as a visual aide. In the fishbone (also termed “herringbone”) configu-
ration, the carbon platelets are parallel and oriented at an angle to the fiber axis
[75,83,86]. This particular arrangement can lead to deviations in the interlayer
spacing toward the outer edges of the graphitic platelets, making this particular
structure a strong candidate as an effective adsorbent. The fishbone fiber can
possess a narrow hollow channel that runs between the series of angled carbon
platelets [86]. The so-called “ribbon” form is quite distinct, in that the carbon
platelets are oriented solely in an arrangement that is parallel to the fiber axis
[95]. The observed variations in carbon morphology and lattice structure are due
to the differences in the nature of the catalytic metal site. The choice of both
catalyst and reactant is critical when generating carbon nanofibers, because the
metal particles can adopt well-defined geometries during the hydrocarbon de-
composition step, thereby influencing the nature of the carbon precipitated and
deposited at the rear face of the particle. For example, platelet nanofibers are
generated from metal particles that are typically “rectangular” in shape, while
rhombohedral/diamond-shaped particles produce nanofibers with a fishbone type
TM
Copyright n 2003 by Marcel Dekker, Inc. All Rights Reserved.
Carbon Nanofibers and Removal of Toxic Phenolics 173
FIG. 1 Representative TEM images of (a) a fishbone and (b) ribbon nanofibers grown
from unsupported (a) Ni/Cu and (b) Ni catalysts.
TM
Copyright n 2003 by Marcel Dekker, Inc. All Rights Reserved.
174 Park and Keane
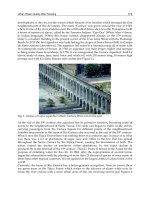
FIG. 2 Representative TEM images of fibrous carbon grown from supported Ni catalysts
(details given in Table 1): (a) fishbone structures with platelets arrayed at an angle to the
filament axis; (b) ribbon structures with platelets aligned parallel to the filament axis;
(c) spiral structures with platelets oriented parallel to the filament axis; (d) “branched”
fibers generated from Ni/activated carbon.
TM
Copyright n 2003 by Marcel Dekker, Inc. All Rights Reserved.
Carbon Nanofibers and Removal of Toxic Phenolics 175
(a) (b)
FIG. 3 Simplified schematic representations of two forms of catalytically generated
nanofibers employed as adsorbents in the current studies: (a) ribbon form, (b) fishbone
form.
of configuration. As a means of aiding a visualization of this phenomenon, TEM
images of an assortment of carbon nanofiber structures are given in Figure 4,
where the relationship between the metal particle shape and the nanofilament
structural characteristics can be seen. Three distinct growths are represented in
Figures 4a–4d. The first (Fig. 4a) is monodirectional in nature, where the carbon
is precipitated at the rear edge of the metal particle in a whiskerlike mode. The
second is a bidirectional growth (Figs. 4b and 4c), where the carbon is precipi-
tated at two opposite faces of the particle; the metal component remains entrapped
within the body of the nanofiber during the growth process. The entrapped parti-
cle depicted in Figure 4b has assumed a diamond-like morphology, and the bidi-
rectional growth of carbon platelets are arrayed around what appears to be a
TM
Copyright n 2003 by Marcel Dekker, Inc. All Rights Reserved.
FIG. 4 TEM images illustrating the relationship between Ni particle shape and the nature
of the associated carbon nanofiber growth: (a) pentagonal-shaped particle, monodirectional
fiber growth; (b) diamond-shaped particle, bidirectional fiber growth; (c) rectangular-
shaped particle, bidirectional spiral fiber growth; (d) rectangular-shaped particle, multidi-
rectional spiral fiber growth.
TM
Copyright n 2003 by Marcel Dekker, Inc. All Rights Reserved.
Carbon Nanofibers and Removal of Toxic Phenolics 177
hollow central core. On closer examination by HRTEM, distinct parallel platelets
were found in this central core and aligned parallel to the fiber axis. Diffusion/
precipitation in this core region differs from that associated with the adjacent
faces of the restructured Ni particle. Finally, a relatively uncommon type, a multi-
directional growth, can be seen in Figure 4d, where two fibers are associated
with two distinct sets of metal faces: The metal particle is locked at the hub of
the four filamentous arms. From a consideration of these TEM images it becomes
clear that the characteristics of the nanofiber are largely determined by the struc-
ture adopted by the metal particle. The dimensions of the metal face at which
the carbon is precipitated govern the fiber width. This effect is particularly evident
in Figure 4d, where two distinct fiber diameters are generated that match the
dimensions of the two sets of metal faces from which these fibers have been
grown. By use of controlled-atmosphere electron microscopy, Baker and co-
workers (96) demonstrated that the growth of each fibrous arm was identical and
that the fiber grew in a symmetrical manner.
The commonly accepted fibrous carbon growth mechanism [73] involves re-
actant (carbon source) decomposition on the top surface of a metal particle, fol-
lowed by a diffusion of carbon atoms into the metal, with precipitation at other
facets of the particle to yield the fiber, which continues to grow until the metal
particle becomes poisoned or completely encapsulated by carbon. The growth of
carbon nanofibers with a spiral (sometimes denoted helical) structure occurs due
to an unequal diffusion of carbon through the metal particle, leading to the aniso-
tropic growth; see Figures 4c and 4d. Zaikovskii and co-workers [97], using an
MgO-supported bimetallic Ni-Cu catalyst, generated symmetrical spiral nanofi-
bers. These authors proposed that a carbide mechanism was in operation, where
Ni
3
C, metastable at 723 K, exists during the hydrocarbon transformation before
decomposing to metal and carbon. It was proposed that the different diffusional
pathways taken by the carbon atoms through the carbide phase led to different
rates of carbon growth, resulting in a “twisted,” or spiral, growth. The generation
of fibrous carbon with a spiral structure was also noted by Park and Keane [38,98]
using alkali bromide–doped Ni/SiO
2
catalysts to generate substantial quantities
of carbon with relatively small diameters. It was observed that the choice of alkali
metal (from Li to Cs) had a direct impact on the degree of fiber curvature. The
spiral growth was again assigned to an anisotropic diffusion of carbon atoms
through the metal, generating a helical fiber. Moreover, doping the catalyst with
alkali bromide enhanced both the carbon yield and overall structural order [99–
102].
The diameters of the individual carbon nanofibers generated from unsupported
catalysts are appreciably greater than those grown from supported systems; see
Table 1 for the details. This is a direct consequence of the much smaller metal
particle size that can be stabilized on the support [74–76,80,86,91,95]. The degree
of crystalline order of the carbon product is controlled by various factors, includ-
TM
Copyright n 2003 by Marcel Dekker, Inc. All Rights Reserved.
178 Park and Keane
ing the wetting properties of the metal with graphite and the crystallographic
orientation of the metal faces that are in contact with the carbon deposit, features
that are ultimately reliant upon the choice of catalyst [75,86]. The arrangement
of the metal atoms at the face where the carbon is deposited ultimately regulates
the nature of the precipitated carbon. If the atoms are arranged in such a manner
that they are consistent with those of the basal plane structure of graphite, then
the carbon that dissolves in and diffuses through the particle will be precipitated
as an ordered structure. Conversely, if there is little or no match between the
atomic arrangements of the depositing face and graphite, a more disordered car-
bon will be generated. The bulk densities of the carbon materials used as adsor-
bents are given in Table 2. There is a significant variation (fourfold) in the densi-
ties of the catalytically generated carbon. Those fibers that display a fishbone
structure exhibit the lowest densities but possess the highest surface areas due
to the large number of accessible edge sites in this more open structure. By com-
parison, the fibers that display a predominant ribbon or spiral shape are signifi-
cantly denser, with a lower BET surface area. The nature of the carbon nanofibers
grown from Ni supported on activated carbon (which also serves in this study
as a model adsorbent) is shown in the micrograph given in Figure 2d. There is
no discernible structural order, and the nanofibers exhibit a roughened (or
“branched”) exterior. The latter feature can be of benefit in terms of enhanced
sites for solute attachment. Indeed, it is to be expected that carbon nanofibers
grown from an activated carbon substrate should exhibit uptake characteristics
that draw on the action of both carbonaceous species, i.e., original amorphous
Ni support and catalytically grown fibers. Indeed, the associated surface area
measurement (Table 2) is intermediate between the highly oriented nanofibers
and the amorphous carbon.
High-resolution TEM (HRTEM) proved to be an invaluable aid in screening
carbon nanofibers as potential adsorbents and linking uptake data with structural
characteristics. The presence of an amorphous carbon layer on the filament edges
(Fig. 2) is an artifact of the cooling stage, upon completion of the catalytic step.
This layer may hinder uptake by blocking filament edge sites as potential points
of solute attachment. A careful oxidation treatment was employed to remove this
amorphous carbon overlayer, allowing access to the underlying adsorption sites,
without disrupting the overall lattice structural order; a weight loss of ca. 5%
was typically associated with this mild oxidative step. Similar oxidative treat-
ments have been used by Baker and co-workers [78] to enhance the surface area
of nanofibers, but it should be noted that a gasification of a significant filamentous
component accompanied any substantial increase in area. Surface areas of up to
700 m
2
g
Ϫ1
have, however, been quoted (with a 40% w/w burn-off ), with no
apparent damage to the overall structural integrity of the remaining carbon spe-
cies [78].
TM
Copyright n 2003 by Marcel Dekker, Inc. All Rights Reserved.
Carbon Nanofibers and Removal of Toxic Phenolics 179
Temperature-programmed oxidation (TPO) is a technique that has been put
to good use in probing the degree of order in carbon structures where a move
from an amorphous to a graphitic structure is accompanied by an elevation of
the temperature at which gasification is induced [103]. The TPO profiles associ-
ated with selected demineralized carbon samples are shown in Figure 5, and the
T
max
values are recorded in Table 2. The oxidation of the model amorphous acti-
vated carbon takes place at a significantly lower temperature than that of the
highly ordered model graphite (Figs. 5a and 5e). It can be readily seen that the
oxidation characteristics of the carbon nanofibers fall somewhere between these
two boundary cases. The ordered structure associated with the fibers elevates the
onset of gasification relative to activated carbon, but the greater presence of edge
sites means that fibers gasify at a lower temperature than the model graphite.
Carbon generated from the Ni/activated-carbon catalyst exhibits a TPO peak (872
K) that roughly corresponds to the parent substrate (Figs. 5a and 5d) in addition
to a higher-temperature response that can be linked to the structured fibers. The
peak profile is very broad, indicative of the presence of a range of different carbon
species. The TPO profile of the carbon generated with a spiral conformation is
FIG. 5 TPO profiles of demineralized samples of (a) activated carbon, (b) fishbone fibers
grown from unsupported Cu/Ni, (c) spiral fibers grown from Ni/Ta
2
O
5
, (d) fibers generated
from Ni/activated carbon, and (e) graphite.
TM
Copyright n 2003 by Marcel Dekker, Inc. All Rights Reserved.
180 Park and Keane
also broad, diagnostic of a diverse structure; a number of T
max
values characterize
this sample, as shown in Table 2. The spiral fibers, although highly ordered, do
not exhibit quite the same regularity as the platelet or ribbon form. The fishbone
nanofibers realize a sharper oxidation profile with one predominant characteristic
T
max
. The TPO characteristics of carbon grown from supported catalysts suggests
a marginally greater degree of order than that associated with unsupported metal
counterparts. The support material can alter the characteristics of the deposited
metal and so impose changes to the carbon deposit.
B. Phenol Adsorption
The equilibrium phenol uptake values for a representative solute concentration
are given in Table 3. The highest uptake was achieved using the model activated
carbon, the lowest (by a factor of almost 4) with the model graphite, while the
catalytically generated nanofibers delivered a range of values that fall within these
two extremes. It should be noted that the carbon grown from unsupported metallic
Ni took a predominantly platelet form (graphene layers are oriented perpendicular
to the growing fiber axis), with a minor component of ribbon nanofibers. The
extent of phenol adsorption matches, to a greater degree, the surface area associ-
TABLE 3 Effect of Acid Treatment and Partial Oxidation on Phenol Uptake Values
for Model (As-Supplied) and Catalytically Generated (As-Grown) Carbon Adsorbents
Phenol uptake (mmol g
Ϫ1
)
As grown/ Demineralized Demineralized Partially
Adsorbent as supplied with HCl with HNO
3
oxidized
Activated carbon 1.63 1.98 1.84 2.13
Graphite 0.45 0.60 0.78 0.82
Fishbone fibers 0.78 1.29 1.34 2.03
(Cu-Ni/SiO
2
)
Fishbone fibers 0.66 0.75 0.95 1.45
(unsupported Cu/Ni)
Platelet/ribbon fibers (un- 0.63 0.91 0.78 1.07
supported Ni)
Ribbon fibers 0.61 0.95 1.08 1.46
(Ni/SiO
2
)
Spiral fibers 0.75 1.22 1.36 1.67
(Ni/Ta
2
O
5
)
Branched carbon 1.28 1.48 1.51 1.59
(Ni/activated carbon)
Initial phenol concentration ϭ 30 mmol dm
Ϫ3
.
TM
Copyright n 2003 by Marcel Dekker, Inc. All Rights Reserved.
Carbon Nanofibers and Removal of Toxic Phenolics 181
ated with these carbon materials; i.e., uptake is dependent on the surface available
for attachment. Within the range of nanofiber structures under investigation, the
greatest phenol adsorption was achieved on the fishbone and spiral configurations
generated from the supported catalysts. Treatment with the carbon fibers grown
from an activated-carbon substrate resulted in a phenol removal that reflects a
combined contribution from both carbon components. The commercial activated
carbon and graphite as well as the catalytically generated nanofibers contain a
residual metal component that is left over from the synthetic step(s). This metal
can be removed by an acid washing; two mineral acids (HCl and HNO
3
) were
employed in this study. The demineralization agent can also influence the ad-
sorption characteristics of the carbon by functionalizing the surface. Park and
co-workers [39], studying the removal of low-molecular-weight alcohols from
aqueous solution, demonstrated that nanofiber treatment with HCl resulted in
enhanced adsorption. Demineralization with both acids raised the uptake of phe-
nol by each carbon considered in this study (Table 3). The enhancement of uptake
was greater in the case of the nanofibers; the fishbone and spiral structures contin-
ued to provide the highest uptakes among the catalytically generated carbons. In
contrast, Pradhan and Sandle [21] reported that a treatment of activated carbons
(granular and charcoal cloth) with HNO
3
and H
2
O
2
under much harsher conditions
than employed in this study resulted in a substantial decrease in adsorption capac-
ity. This was ascribed to an increase in the concentration of oxygenated functional
groups on the carbon surface (in particular at the entrance to the micropores), as
was supported by the studies of Nevskaia and co-workers [61]. However, it has
been established [104–106] that the adsorption of phenolic compounds on carbon
involves the formation of electron donor–acceptor complexes, where basic sur-
face oxygen– and/or surface electron–rich regions act as donors and the aromatic
ring of the adsorbate serves as the acceptor. A surface functionalization by acid
treatment is accordingly beneficial for phenol uptake, as was uniformly the case.
A surface oxidation can be achieved by heat treatment in an oxidizing gas stream
that also serves to remove any amorphous carbon overlayer from the nanofibers.
The effect of this additional treatment on phenol adsorption characteristics can
be assessed from the data presented in Table 3. The removal of the amorphous
cover facilitates a more meaningful assessment of the influence of the carbon
platelet orientation on phenol uptake where the treated fibers present an essen-
tially clean surface. Once again, the most significant increases in uptake were
recorded for the nanofibers grown from the supported catalyst. The extent of
adsorption on the demineralized/oxidized fishbone nanofibers is equivalent to that
achieved with the treated activated carbon. The variation in solution pH (as an
important measure of water quality) during phenol uptake is shown in Figure 6
for the model activated carbon and two representative nanofibers. Agitating the
carbon samples in water, as a blank, resulted in a slight shift in pH to more acidic
conditions. The latter can be ascribed to a release of residual SO
x
or NO
x
spe-
TM
Copyright n 2003 by Marcel Dekker, Inc. All Rights Reserved.
182 Park and Keane
TM
Copyright n 2003 by Marcel Dekker, Inc. All Rights Reserved.
Carbon Nanofibers and Removal of Toxic Phenolics 183
cies arising from the demineralization step. The initial phenol solution was acidic
(pH Ͻ 5), but upon contact with each carbon, the pH was significantly raised as
a result of the removal of the organic from solution. Phenol acts as a weak acid
that dissociates to a small extent in aqueous solutions to give H
3
O
ϩ
and a phenox-
ide anion. The increase in pH may also be ascribed to an attachment of hydronium
ions to the carbon surface, as proposed by Daifullah and Girgis [10].
One important aspect of separation processes involving carbon-based adsor-
bents is the ease of separation of the solid from the treated solution. The recovery
of the carbon nanofibers from aqueous media was observed to be far more fa-
cile than phase separation involving the granular activated carbon powder. The
nanofibers are extremely robust in nature and do not disintegrate or exhibit any
appreciable damage during vigorous agitation, unlike the activated carbon, which
shows signs of attrition with prolonged use. Indeed, the time taken for the separa-
tion of roughly the same weight of activated carbon from the treated solution
was greater by a factor of up to 10. The intrinsic hydrophobicity of the carbon
nanofibers may also serve to aid filtration by repelling water molecules. More-
over, unlike the activated carbon, separation of the fibers from solution was not
accompanied by any significant loss of fine carbon particulates, and adsorbent
reuse is greatly facilitated. Indeed, carbon fibers are known to exhibit high struc-
tural strength that is maintained over many cycles of adsorption/desorption and
enhanced transport effects when compared with either graphite or activated car-
bon [75]. A TPO analysis of the carbon nanofibers before and after use demon-
strated little change in the oxidation characteristics, a feature reinforced by
HRTEM studies. This is a good indication that the highly ordered graphitic struc-
ture remains essentially unchanged. By comparison, the TPO profiles of the acti-
vated carbon revealed a small but significant shift in T
max
to lower values, sug-
gesting a loss of structural integrity. De Jong and Geus [86] have noted an
improved mechanical strength due to filament interweaving associated with fibers
wider than ca. 12 nm, dimensions that match the majority of carbon structures
generated in this study. The latter feature would certainly be of importance in a
fixed-bed adsorption configuration, where a high crushing resistance is required.
Given the equivalency of solute uptake observed for both the oxidized activated
carbon and the fishbone fibers, the greater ease of sorbent recovery associated
with the latter warrants further study as part of an overall (financial and technical)
assessment, perhaps in a pilot-plant phenol adsorption/recovery unit.
FIG. 6 Time dependence of solution pH values for the blank run (adsorbent in water)
and uptake of phenol (initial concentration ϭ 30 mmol dm
Ϫ3
) and 2-chlorophenol (initial
concentration ϭ 53 mmol dm
Ϫ3
) on demineralized adsorbents: (a) activated carbon;
(b) fishbone fibers (Cu-Ni/SiO
2
); (c) spiral fibers (Ni/Ta
2
O
5
).
TM
Copyright n 2003 by Marcel Dekker, Inc. All Rights Reserved.
184 Park and Keane
C. Chlorophenol Adsorption
The results of the uptake of 2-chlorophenol (as a representative isomer) on the
same carbonaceous materials are given in Table 4. As in the case of phenol, the
performance of the as-grown nanofibers falls between that of the model activated
carbon and graphite. One significant observation is the appearance of phenol in
the solution treated with the fishbone nanofibers grown from the unsupported
catalyst. Phenol in solution must arise from a dechlorination on the carbon surface
with a subsequent release of the aromatic. The effects of a demineralization and
gas-phase oxidation on 2-chlorophenol uptake are also presented in Table 4. Both
pretreatments raised the level of adsorption, which is to be expected, since the
presence of a strongly electron-withdrawing group (Cl) on the aromatic ring will
favor the formation of sorbate/sorbent electron donor–acceptor complexes. The
adsorption of phenol and the three chlorophenol isomers under the same condi-
tions is compared in Table 5, taking the “as-received” activated carbon as a repre-
sentative adsorbent. The adsorption capacity of a given activated carbon for a
range of phenolic compounds has been related to the solute solubility in water,
where the lower the solubility, the greater should be the uptake [28,37,104]. Com-
paring the solute solubilities in Table 5 with the uptake values, there is no obvious
link between these two parameters. Uptake of the meta- and para-chloro-isomers
TABLE 4 Effect of Acid Treatment and Partial Oxidation on 2-Chlorophenol Uptake
Values for Model (As-Supplied) and Catalytically Generated (As-Grown) Carbon
Adsorbents
2-Chlorophenol uptake (mmol g
Ϫ1
)
As grown/ Demineralized Partially
Adsorbent as supplied with HNO
3
oxidized
Activated carbon 2.47 3.29 4.17
Graphite 1.27 1.52 1.43
Fishbone fibers 1.83 2.76 4.09
(Cu-Ni/SiO
2
)(ϩ0.12 phenol)
a
(ϩ0.47 phenol)
a
Fishbone fibers 1.41 19.8 3.37
(unsupported Cu/Ni) (ϩ0.15 phenol)
a
(ϩ0.55 phenol)
a
(ϩ0.64 phenol)
a
Platelet/ribbon fibers 1.74 2.32 3.15
(unsupported Ni)
Ribbon fibers 1.92 2.45 3.87
(Ni/SiO
2
)(ϩ0.18 phenol)
a
a
Phenol concentration in solution (mmol g
Ϫ1
).
Initial 2-chlorophenol concentration ϭ 53 mmol dm
Ϫ3
.
TM
Copyright n 2003 by Marcel Dekker, Inc. All Rights Reserved.
Carbon Nanofibers and Removal of Toxic Phenolics 185
TABLE 5 Solubility and Uptake Data for Phenol and Three
Chlorophenol Isomers on “As-Supplied” Activated Carbon at the
Same Initial Solute Concentration (48 mmol dm
Ϫ3
)
Solubility in water
at 303 K Uptake
Adsorbate (mmol dm
Ϫ3
) (mmol g
Ϫ1
)
Phenol 871 2.4
2-Chlorophenol 222 2.5
3-Chlorophenol 202 3.0
4-Chlorophenol 211 3.1
was significantly greater than that recorded for phenol, which was, in turn,
roughly equivalent to the ortho-substituted chlorophenol. The latter suggests the
involvement of steric hindrance, in that the further the Cl atom is from the –OH
group, the greater the ultimate uptake, and this points to a direct interaction of
Cl with the carbon adsorbent. Yonge and co-workers [36] likewise concluded
that substituent positioning influenced adsorption, whereas Singer and Yen [107]
obtained equivalent uptakes for each isomer.
The occurrence of phenol in solution was even more significant over the
treated samples, where the acid treatment induced dechlorination over the fish-
bone structure from the supported catalyst. Carbon oxidation further elevated
dechlorination over both fishbone fibers and was responsible for the onset of
dechlorination over the ribbon structure. The removal of the amorphous carbon
overlayer combined with the oxidation/functionalization of the underlying sur-
face enhanced chlorophenol interactions to such an extent that C E Cl bond scis-
sion results. The dehalogenation of arene derivatives mediated by activated car-
bon alone has been noted elsewhere in gas-phase [108–110] and liquid-phase
[111] operation. In each case, dechlorination was promoted in the presence of
hydrogen (hydrodehalogenation to aromatic and HCl) at temperatures in excess
of 473 K. The observed dechlorination of 2-chlorophenol over the treated carbon
fibers in the liquid phase at room temperature is indicative of a remarkably strong
interaction/chemisorption that leads to CE Cl bond dissociation. The variation in
solution pH (increasingly less acidic) shown in Figure 6, reflects 2-chlorophenol
uptake, and there is no evidence of HCl release into solution. The highly reactive
uptake sites on the treated filament surfaces must promote a dissociative adsorp-
tion of chlorophenol with both the aryl moiety and Cl attached to the surface.
The resultant Cl–filament (sp
2
) bonding is sufficiently strong that the extracted
Cl remains on the surface while the dechlorinated phenol can re-enter the liquid
phase. The presence of delocalized π-electrons situated between adjacent graphite
TM
Copyright n 2003 by Marcel Dekker, Inc. All Rights Reserved.
186 Park and Keane
layers is known to impart weakly basic character to the material in its pristine
state and, in conjunction with the uniformly ordered, small-diameter carbon
nanofibers, contributes to the high directional conductivity [75,112]. The high
conductivity and greater availability of delocalized π-electrons, relative to con-
ventional graphite, must be the source of the stronger sorbate/fiber interaction(s)
that lead(s) to the observed apparent dechlorination activity. Indeed, it has been
proposed that individual nanotubes exhibit unique conductivity properties, both
metallic and nonmetallic, due to the variations in geometries and degree of graph-
itization [112]. One feature of the fishbone nanofibers that can have some bearing
on the interactions is the variability of the d-spacings, especially at the edge
regions. This feature may allow a stronger interaction with the delocalized elec-
trons between adjacent layers that contributes to the dechlorination. The predomi-
nantly platelet form of nanofibers grown from unsupported Ni did not exhibit any
significant dechlorination behavior. Platelet nanofibers are structurally similar to
graphite, in that they possess two edges of similar dimension, are highly ordered
structures, but possess an appreciably higher aspect ratio. This high degree of
crystalline perfection does not appear to promote the same degree of chlorophenol
interaction as that observed with the fishbone nanofibers, where variations in the
interlayer spacing must be critical in promoting dechlorination.
The treated fishbone fibers grown from the supported catalysts again delivered
equivalent solute uptake to the model activated carbon. It should be stressed that
there was no detectable phenol in the solutions treated by both model carbons.
It is instructive to note that uptake on the treated ribbon structures (grown from
Ni/SiO
2
) approached that of the treated activated carbon but that the same fibrous
material acted as an indifferent adsorbent for phenol (Table 3). These structures
are arranged in such a manner that only the edge regions are exposed; these
nanofibers are characterized by a relatively large basal plane, bounded by two
long and two short edges, perpendicular to each other. The carbon atoms at the
edge sites can be arranged into two distinct conformations, “armchair” and “zig-
zag,” and these can have quite different adsorption capacities. A preponderance
of one particular face may have a significant influence on adsorption characteris-
tics when compared with a nanofiber that has an equivalent number of exposed
faces, e.g., the fishbone structure [113,114]. Park and Baker [114] illustrated that
the nanofiber structure impacted strongly on the catalytic behavior of supported
metal particles. This variation in behavior was attributed to the ability of the
supported metal to adopt specific orientations, following deposition and nucle-
ation on either the “zigzag” or the “armchair” faces of the fiber. From the results
generated in this investigation, it is tentatively suggested that chlorophenol exhib-
its a higher affinity than phenol for adsorption at the longer edge sites. The bene-
fits of the catalytically generated carbon in 2-chlorophenol treatment are twofold:
(1) ease of recovery/enhanced mechanical strength and (2) dechlorination capa-
bility. Indeed, the treated fibers are obvious candidates as transition metal catalyst
TM
Copyright n 2003 by Marcel Dekker, Inc. All Rights Reserved.
Carbon Nanofibers and Removal of Toxic Phenolics 187
supports to promote chloroarene hydrodechlorination, which is now accepted as
a viable means of chemical transformation/recycle [115–117].
D. Semibatch Phenol Uptake
The results generated for phenol uptake in a closed loop system using three repre-
sentative carbon adsorbents are shown in Figure 7. In the earlier batch adsorption
experiments, the fishbone nanofibers grown from the supported catalyst generated
the highest uptakes of all the catalytically generated carbons. This form of struc-
tured carbon was accordingly chosen to test against standard and amorphous and
graphitic samples. In semibatch operation, the activated carbon removed all traces
of phenol from solution after 62 hours on-stream. At this point the reservoir
concentration of phenol treated with graphite or nanofiber had been lowered by
no more than 65%. The ultimate phenol uptakes agreed well with those deter-
mined in a solely batch operation. Phenol adsorption per gram of adsorbent was
FIG. 7 Variation in phenol reservoir concentration with time in the semibatch-operated
removal of phenol by activated carbon (᭜), graphite (ᮀ), and fishbone filaments grown
from Cu-Ni/SiO
2
(᭝). Inset: Time-dependent phenol uptake, symbols as previously: adsor-
bent bed volume ϭ 1.83 cm
3
; initial phenol reservoir concentration ϭ 1.2 mmol dm
Ϫ3
.
TM
Copyright n 2003 by Marcel Dekker, Inc. All Rights Reserved.
188 Park and Keane
TABLE 6 Phenol Uptakes from a
Semibatch Operation
Phenol uptake
Adsorbent (mmol g
Ϫ1
)
Activated carbon 1.6
Graphite 0.9
Fishbone fiber 2.5
(Cu-Ni/SiO
2
)
Adsorbent bed volume ϭ 1.83 cm
3
; initial
phenol concentration ϭ 1.2 mmol dm
Ϫ3
.
nonetheless appreciably higher for the carbon nanofiber bed; see inset to Figure
7 and Table 6. The latter is a direct result of the differences in the density of
the carbonaceous materials, where the maintenance of a fixed bed volume/space
velocity required the use of quite different adsorbent weights. Nevertheless, these
preliminary screening tests are positive in terms of flagging the potential of cata-
lytically generated carbon nanofibers for application in continuous-flow water
treatment. The pressure required to maintain a constant flow (10 cm
3
min
Ϫ1
)of
phenol solution through the bed of activated carbon and graphite (3800–3900
psig) was substantially higher than that recorded for the same nanofiber bed vol-
ume (2400–2700 psig). This pressure difference has significant ramifications in
terms of energy usage/costs, in that operation of an activated carbon bed (to
deliver equivalent levels of cleanup) would necessitate the design and operation
of equipment rated for higher pressures.
VI. CONCLUSIONS
The removal of toxic phenolic pollutants from wastewater is an area of growing
concerns as governmental legislation focuses on a substantial reduction in the
emission of a broad range of compounds. Adsorption represents the most widely
applied nondestructive control technology, offering the possibility of recovery/
recycle. Activated carbons, while effective under “dry” conditions, generally un-
derachieve in aqueous media due to an indiscriminate adsorption of both pollutant
and water. Adsorption on hydrophobic graphite is more selective, but the inherent
low surface area/mass ratio mitigates against high specific uptakes. The use of
catalytically generated highly ordered carbon nanofibers is a viable option for
the uptake of phenolic compounds. A judicious choice of catalyst/synthesis con-
ditions allows for a high degree of control in terms of the morphology and lattice
structure of the carbon fibers that are produced. Phenolic adsorption on the “as-
TM
Copyright n 2003 by Marcel Dekker, Inc. All Rights Reserved.
Carbon Nanofibers and Removal of Toxic Phenolics 189
grown” nanofibers was less than that associated with model activated carbon and
greater than that recorded for model graphite. Demineralization in acid and partial
oxidation realized higher uptakes on all the carbon adsorbents, with comparable
values recorded for the activated carbon and fibers bearing a fishbone lattice
arrangement. The ordered fibers have the decided advantage of exhibiting a
greater ease of separation from solution/operation in semibatch mode when com-
pared with amorphous carbon, allied to higher mechanical strength and retention
of structural integrity. Nanofibers with a ribbon structure exhibit an appreciably
higher affinity for chlorophenol when compared with phenol. Moreover, the
treated (fishbone/ribbon) nanofibers not only act to adsorb chlorophenol from
water but promote a dechlorination, the degree of which is enhanced with acid
treatment and partial oxidation. The emergence of a novel carbon that both ad-
sorbs and dechlorinated chlorphenols at room temperature is a significant finding
that has far-reaching implications in water treatment technologies based on sepa-
ration and catalytic transformation processes.
REFERENCES
1. RE Hester, RM Harrison. Volatile Organic Compounds in the Atmosphere: Issues
in Environmental Science and Technology. Cambridge, UK: Royal Society of
Chemistry, 1995.
2. RM Harrison. Pollution Causes, Effects and Control. Cambridge, UK: Royal Soci-
ety of Chemistry, 1990.
3. AJ Buonicore, W Davis, eds. Air Pollution Engineering Manual. New York: Van
Nostrand Reinhold, 1992.
4. YJ Li, JN Armor. Appl Catal B: Environmental 1:L21–L29, 1992.
5. GJ Wilson, AP Khodadoust, MT Suidan, RC Brenner. Water Sci Technol 36:107–
115, 1997.
6. B Hunger, S Matysik, M Heuchel, W-D Einicke. Langmuir 23:6249–6254, 1997.
7. S Pallerla, RP Chambers. Catal Today 40:103–111, 1998.
8. M Streat, JW Patrick, MJ Camporro Perez. Water Res 29:467–472, 1995.
9. AR Khan, A Al-Bahri, A Al-Haddad. Water Res 31:2102–2112, 1997.
10. AAM Daifullah, BS Girgis. Water Res 32(4):1169–1177, 1998.
11. W Fritz, W Merk, E Schluender. Chem Eng Sci 36:731–741, 1981.
12. F Caturla, JM Martin-Martinez, M Molina-Sobio, F Rodriguez-Reinoso, R Torre-
grosa. J Colloid Interface Sci 124:528–534, 1988.
13. W Fritz, W Merk, E Schluender. Chem Eng Sci 36:743–757, 1981.
14. S Susarla, GV Bhaskar, SMR Bhamidimarri. Environ Technol 14:159–166, 1993.
15. RL Gutafson, RL Albright, J Heisler, JA Lirio, OT Reid. Ind Eng Chem Fund 7:
107–115, 1968.
16. PC Chiang, EE Chang, JS Wu. Wat Sci Technol 35:279–285, 1997.
17. MA Ferro-Garcia, J Rivera-Utrilla, I Bautista-Toledo, C Moreno-Castilla. J Chem
Tech Biotechnol 67:183–189, 1996.
18. T Kawai, K Tsutsumi. Colloid Polymer Sci 273:787–792, 1995.
TM
Copyright n 2003 by Marcel Dekker, Inc. All Rights Reserved.