Soil and Environmental Analysis: Modern Instrumental Techniques - Chapter 12 (end) pps
Bạn đang xem bản rút gọn của tài liệu. Xem và tải ngay bản đầy đủ của tài liệu tại đây (374.61 KB, 28 trang )
12
Analysis of Organic Pollutants
in Environmental Samples
Julian J. C. Dawson, Helena Maciel, and Graeme I. Paton
The University of Aberdeen, Aberdeen, Scotland
Kirk T. Semple
Lancaster University, Lancaster, England
I. INTRODUCTION
The identification and quantification of organic pollutants in environmental
matrices have improved significantly over the past two decades. Fundamen-
tally, the determination of organic contaminants requires selective solvent
extraction of the determinant(s) from the matrix followed by quantifiable
analysis using specialized instrumentation. Often the researcher needs to
identify a target compound and/or its metabolites, thus focusing the choice
of technique to suit the particular matrix and determinant(s). Significant
advances in instrument automation and reliability, precision of flow control,
detector development, and competitive instrument pricing have greatly
increased the number and range of laboratories capable of fulfilling reliable
and routine organic pollutant analysis.
This chapter describes the main steps required in analysis of key
organic pollutants in environmental samples, concentrating on soil analysis
to provide illustrative examples, as soil is one of the more challenging
matrices. Citations are made to references that provide specific information
about instrumentation and the underpinning principles and scientific
rationale. Several widely used methods are described and discussed in
detail to exemplify the considerations needed for techniques.
TM
Copyright n 2004 by Marcel Dekker, Inc. All Rights Reserved.
A. Why Quantify and Identify Organic Contaminants?
The presence of organic pollutants in the environment is ubiquitous. From
the high arctic to the tropics (Jones and de Voogt, 1999), recalcitrant and
volatile pollutants are detectable in all environmental spheres. Soils and
sediments are major sinks for organic pollutants and can retain the highest
concentrations of released pollutants (Northcott and Jones, 2000). Drinking
water contaminated with biocides from runoff into surface waters or by the
leaching of agrochemicals through soil to aquifers is widely acknowledged
(Stackelberg et al., 2001). Researchers and regulators need sensitive and
routine techniques to identify and quantify these contaminants. Scientists
also need to be able to study samples for signs of degradation and the
occurrence of metabolites and cocontaminants that may indicate the relative
damage or indeed remediation in soil or sediment systems.
II. OVERVIEW OF ORGANIC ANALYSIS
Once a representative sample has been obtained, there are three further
stages that underpin organic analysis: (1) the preparatory (drying) and
extraction stage, (2) the cleanup stage(s) and (3) the determination stage.
Some determinations may only be performed after derivatization, when the
determinant needs to be chemically altered to improve analytical resolution.
Organotin determination, for example, requires extensive derivatization
because the determinants are not sufficiently volatile for direct gas
chromatographic analysis (Abalos et al., 1997). Each of these stages will
be dealt with separately, and using illustrative examples, the selection
criteria for certain approaches will be justified.
A. Sample Preparation and Analysis
The type of drying technique carried out is determined by the nature of the
determinant(s) and the matrices. It is usually inappropriate to dry a soil or
sediment in an oven as may be done for inorganic analysis, as this may cause
a substantial loss of the determinants. Instead, a sulfate salt is often used to
remove the water (Hess et al., 1995; Guerin, 1999). After drying, the organic
determinant present must be brought into an appropriate organic solvent
prior to quantification by gas chromatography (GC) or high-pressure liquid
chromatography (HPLC). Determinants in water samples can be extracted
using sequential volumes of organic solvent, which are then passed through
the sulfate salt to remove residual water (Meharg et al., 1999). The
extraction techni que also enables the sensitivity of the analysis to be
516 Dawson et al.
TM
Copyright n 2004 by Marcel Dekker, Inc. All Rights Reserved.
manipulated through sample concentration. Depending upon the nature of
the sample and the target determinant, an appropriate technique can be
selected.
1. Liquid/Liquid Phase Extraction
When a solvent is immiscible with water and the target determinant is more
soluble in the solvent than in water, then this is an ideal technique. The
partitioning coefficient of the determinant material is equal to the ratio of its
concentration in the solvent divided by that in water. The partitioning
coefficient is independent of the volume ratio of solvent : water but constant
at any given temperature; thus increasing the amount of solvent increases
the amount of determinant extracted. Repeated extractions with the same
solvent will also increase the efficiency of determinant extraction. Extraction
efficiency can be further improved by heating of the sample-extraction
mixture (Dean and Xiong, 2000).
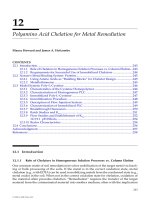
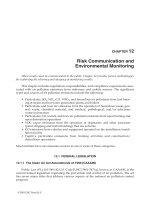
2. Soxhlet Extraction
This is a commonly used technique for quantifying total concentrations of
semivolatile and nonvolatile hydrophobic contaminants. A diagram of the
main components of the Soxhlet apparatus is shown in Fig. 1. The soil or
Figure 1 Soxhlet apparatus for solvent extraction of organic pollutants from soils
and sediments.
Analysis of Organic Pollutants 517
TM
Copyright n 2004 by Marcel Dekker, Inc. All Rights Reserved.
sediment sample is placed in a porous extraction thimble. Below this thimble
is a cup containing the solvent, which is heated and passed through
distillation and condensation stages, ensuring that there is a rigorous mixing
of the solvent with the sample. Although the procedure is slow, it is a harsh
but effective technique. This method continuously re-extracts the sample
with the same quantity of solvent: the solvent is refluxed in a Soxhlet
apparatus, condenses, and trickles down through the sample back to the
bottom of the apparatus, where the determinant collects. This method is
used for nonvolatile and semivolatile organics, and it will not collect any
compounds with a boiling point lower than, or close to, that of the solvent
used. The solvent is typically a mixture of a nonpolar compound such as
dichloromethane (DCM) with about 10% of a water-miscible polar solvent
such as methanol or acetone added.
3. Supercritical Fluid Extraction (SFE)
A supercritical fluid (SCF) is a substance held above its critical temperature
and pressure. SCFs have many advantages over liquid solvents for use in
extraction of environmental samples (Camel, 2001). Their physical proper-
ties include low viscosity, high diffusion coefficients, low toxicity, low
flammability, and negligible surface tension. These allow SCFs to penetrate
an environmental matrix very quickly, allowing rapid extractions compared
to those with conventional solvents. A further advantage is that SFE
systems can be interfaced directly with a chromatography column, thus
minimizing sample preparation. Supercritical carbon dioxide, possibly
modified by the addition of methanol or acetone, is the most common
solvent used in environmental analysis; however, a SCF with a dipole
moment may be more effective (Alonso et al., 1998). Hawthorne et al. (1992)
found that supercritical CHClF
2
(Freon-22) was more effective than CO
2
for
the extraction of PAHs and PCBs from soils, consistently extracting 2–10
times more determinant. SFE with CHClF
2
was also fast: 30–45 minutes
were required to extract comparable amounts to that obtained by 18 hours
ultrasonication in DCM, or 32 hours Soxhlet extraction in hexane/methanol
and hexane/acetone mixtures. SCF techniques are not routinely used in soil
analysis because they are quite expensive to set up and to run routinely.
However, they may be more widely used in future, particularly if they are
shown to be applicable to a range of determinants that are not routinely
tested for at present.
4. Thermal Desorption
This method is used in conjunction with a gas chromatograph (GC) and is
suitable for volatile and semivolatile hydrocarbons. The solid sample is
518 Dawson et al.
TM
Copyright n 2004 by Marcel Dekker, Inc. All Rights Reserved.
warmed to approximately 85
C in an enclosed system to desorb and vola-
tilize the hydrocarbons, which are then purged, trapped, and subsequently
transferred onto the column. Volatile organic compounds, such as benzene,
toluene, ethylbenzene, xylene (BTEX), methyl tertiary butyl ether (MtBE),
and naphthalene from liquid environmental samples, e.g., fresh and marine
waters, soil extracts, and wastewater, can also be extracted by purging of the
sample using an inert gas and trapping the extracted determinants. The
contents of the trap are then injected directly onto the column of the GC.
Although slow and costly to set up, the method is the most reliable one for
quantifying relatively water-soluble determinants.
5. Solid/Liquid Phase Extraction
This technique is also known as solid phase extraction (SPE). The process is
simple and fast and may prove cost-effective for some users. A measured
volume of the sample is passed through a cartridge tube with a suitable solid
material, which sorbs the target determinant. The determinant is then eluted
from the cartridge using an appropriate solvent. Semiautomated SPE
systems use vacuum pumps to speed up the solvent flow, enabling elution to
take place much more quickly. SPE is also extensively used as a cleanup
technique to remove material that may damage a chromatography column
or slow down the chromatographic procedure. Most of the large
chromatographic suppliers sell SPE systems. The selection of the packing
material is based upon the polarity of the contaminants to be determined.
Nonpolar hydrophobic adsorbents retain the nonpolar determinants and
allow polar substances to pass through the column, whereas hydrophilic
adsorbents adsorb the polar components, allowing the nonpolar materials
to pass through.
6. Other Methods
Ultrasonication. An ultrasonic probe may be used to agitate soil or
sediment samples in a solvent such as DCM. It is used for non- and
semivolatile organics at various concentrations (Guerin, 1999).
Accelerated Solvent Extraction (ASE). This uses traditional solvent
mixtures as for Soxhlet extraction, but the sample is held at increased
temperature and pressure, thus reducing extraction time and solvent volume
required (Fisher et al., 1997; Hubert et al., 2001).
Microwave-Assisted Solvent Extraction (MSE). This method is
similar in function to ASE in that it enables reduced extraction times and
solvent volumes compared to traditional techniques. The equipment is quite
Analysis of Organic Pollutants 519
TM
Copyright n 2004 by Marcel Dekker, Inc. All Rights Reserved.
costly to purchase, and the technique is not widely reviewed in publications;
hence comparative evaluation may prove to be problematic.
B. Cleanup Techniques
Sample cleanup of organic extracts is used to prolong the life of the
instrument column, injector, and detector. A purified sample will also
produce clearer peaks with improved resolution that will prove easier to
quantify. Sample purification tends to be based on one of the following
principles: (1) partitioning between immiscible solvents; (2) adsorption
chromatography; (3) gel permeation chromatography; (4) chemical destruc-
tion of interfering substances; or (5) distillation.
The simplest of the above is the acid/base partitioning, in which a
solvent extract is shaken with dilute alkali that enables acidic organics to
partition into the aqueous layer while the basic and neutral fractions remain
in the organic solvent. The aqueous layer can then be acidified and extracted
using DCM so that the organic layer will now contain the acid fraction. This
technique is widely used in cleanup procedures for determining phenols and
associated herbicides from soils and sediments (Patnaik, 1997).
Cleanup columns, either as premanufactured SPE systems or as
laboratory-produced columns, are the most common routine technique for
cleanup. For example, highly porous and granular aluminum oxide
(alumina) can be used and is readily available in acidic, neutral, or basic
forms (Polese et al., 1996). Target determinants can be differentiated by
chemical polarity. After the column is packed with the granular material it is
covered in anhydrous sodium sulfate and the sample is placed on the
column. By using the appropriate solvent, this enables the determinants to
be separated from impurities that are present. Basic alumina is used in
purification of steroids, alcohols, and pigments (Cho et al., 1997); the
neutral form is used for esters and ketones (Polese and Ribeiro, 1998), while
the acidic form separates strong acids and acidic pigments. Alumina is also
ideal for the cleanup of hydrocarbons (Cho et al., 1997; Shen and Jaffe,
2000).
Amorphous silica gel is suitable for the removal of interfering
compounds of differing polarities (Shamsipur et al., 2000). Activated silica
gel is heated for several hours at 150
C prior to use and is also well suited
for the cleanup of hydrocarbons (Miege et al., 1999). Deactivated silica gel
has significantly more water present and is used to separate plasticizers,
lipids, esters, and some organometallic compounds (Shamsipur et al., 2000).
If used appropriately, high specificity for target herbicides can be achieved.
In addition, the selection of different solvents (Supelco, 2001) can be used to
manipulate adsorbent activity of the SPE system.
520 Dawson et al.
TM
Copyright n 2004 by Marcel Dekker, Inc. All Rights Reserved.
Florisil is a form of magnesium silicate with acidic properties. A
packed column of Florisil is used the same way as silica and alumina
columns. The material is ideal for the separation of aliphatic compounds
from aromatics (Abdallah, 1994) and is used for a wide range of pesticides
(Smeds and Saukko, 2001) and halogenated hydrocarbons (Schenck and
Donoghue, 2000).
Gel permeation is able to differentiate material on the basis of pore
size using hydrophobic gels (Knothe, 2001). As with SPE, this system is
capable of performing to a high level of specificity, though equipment and
consumable costs will reflect this.
In some solid environmental samples, the presence of specific materials
may impose analytical problems. For example, sulfur may reduce the
resolution of chromatograms. Sulfur has a solubility that is similar to a
range of organochlorine and organophosphate pesticides and cannot be
resolved using Florisil (Patnaik, 1997). Commonly, copper turnings are
shaken with the sample to remove sulfur from the solvent extract (Schulz
et al., 1989). Mercury or tetrabutyl ammonium sulfite (Duinker et al., 1991)
are also used. Table 1 describes the materials typically chosen for cleanup
procedures of selected contaminants extracted from soils and sediments.
C. Methods of Determination
Chromatography is a simple concept in that analyte components become
separated as they either move in the mobile phase or become sorbed in
another phase. The characteristics of the sorption phases determine the
extent to which analyte components become separated. The resolution can
be manipulated by using appropriate columns in consideration of the
determinants sought. The major factors to ensure high quality chromatog-
raphy are (1) purity of the mobile phase, (2) a reliable flow rate, (3) an
Table 1 Suggested Cleanup Techniques for a Number of
Common Contaminant Groups
Determinant Cleanup technique
Nitrosamines Gel permeation, alumina, Florisil
Organochlorines Gel permeation, Florisil
Organophosphates Gel permeation, Florisil
Petroleum Alumina, acid–base
Phenols Gel permeation, acid–base, silica gel
PAHs Gel permeation, alumina, silica gel
Source: Patnaik, 1997.
Analysis of Organic Pollutants 521
TM
Copyright n 2004 by Marcel Dekker, Inc. All Rights Reserved.
appropriate column, and (4) a suitably sensitive detector. Regardless of the
type of chromatography, these rules must be adhered to. The most
commonly used chromatographic techniques in environmental analysis are
GC and HPLC, and these methods will be described briefly and then consi-
dered in more detail, using representative case studies, later in this chapter.
For routine analysis it is important to consider the value of an
autosampler. Current microrobotic technology provides high precision and
reproducibility. In many instruments, sample vials can undergo heatin g and
mixing (with slight modifications to the sampler), thus enabling some
automated derivatization. Automated dilution systems where available, are
also very useful, as the system is capable of operating with small volumes.
The automated injection system resolves problems associated with manual
techniques, which may cause excessive and variable peak broadening on the
column. Most significantly, the autosampler allows hundreds of samples to
be systematically analyzed. This is ideal, because of the long retention times
associated with some determinations.
1. Gas Chromatography
Traditionally this has been called gas–liquid chromatography because
samples being carried through a column undergo partition between a gas
phase (mobile) and a sorbed liquid phase (stationary). For the purpose of
this chapter, only capillary GC will be considered, but further details on
packed columns can be found in Bruno (2000), and in Chap. 10.
The main components of a GC are
The Injector. After sample preparation and cleanup, the sample is
ready for injection. Most GC analysis will be carried out using split or
splitless injection. This means that the sample is injected into a chamber
where, under heating, it expands and then moves in the gas flow onto the
column. The selection of the solvent used for injection is therefore very
important, as different solvents have different expansion characteristics. In
the case of split injection, a proportion of the sample is discarded, as it may
overload the column and detector and cause a reduction in resolution.
Common split ratios are betw een 15 : 1 and 40 : 1, and thus a large
proportion of the sample is discarded. Splitless analysis, on the other hand,
enables expansion of the solvent vapor within a glass liner, but the entire
sample is presented to the column. On-column injection is required for trace
analysis and has no pre-expansion stage for the sample. The injector systems
are usually tailor-made to suit the style of analysis.
Gas Flow Selection and Rate. Many laboratories using gas chroma-
tography do not have access to high-purity gases and thus have to use
522 Dawson et al.
TM
Copyright n 2004 by Marcel Dekker, Inc. All Rights Reserved.
supplies containing small amounts of impurities, e.g., oxygen, moisture, and
carbon compounds. In such circumstances, filters should be used to remove
these impurities, to avoid damaging the column and affecting the response
of the detector. A carrier gas ensures steady flow of sample through the
column while often an additional ‘‘make-up’’ gas is required for the
detector. Any new GC will have highly sensitive electronic or manual gas
controls, which can be altered according to column-specific requirements.
The Capillary Column. The nature of the column will determine the
success or failure of the separation. Users should be aware of the range of
columns on the market and the relative merits of inexpensive and expensive
purchases. The selection of a column is governed by what is referred to as
the ‘‘theoretical plates per meter’’ concept. This parameter describes the
chromatographic performance of a column. There is a wide range of texts
that consider the principles that underpin this parameter, and for more
information, Marr and Cresser (1983) is a good source. All the major
capillary column suppliers have catalogs either available in paper format or
from the internet. These should be consulted prior to purchase, as they will
enable the most appropriate column to be selected. The columns are
composed of fused silica, and a narrow-bore inside diameter (i.d.) (usually
0.20, 0.25, or 0.32 mm) will provide the best separation for closely eluting
components and isomers. In general, the smaller the i.d., the greater is the
level of resolution that can be achieved. Conversely, to avoid sample
overload for analytes in high concentrations, a larger i.d. may be more
appropriate. The characteristics of some typical columns are shown in
Table 2.
The Oven Control. The column will have been selec ted to favor the
particular determinant(s) and analytes. However, it is possible to alter the
analysis most effectively by the manipulation of temperature. For
determinants to be separated, they are differentially partitioned between
the mobile and stationary phases: the proportion in the gas phase depends
Table 2 Examples of Some Available Columns and Their Characteristics
Column type Temperature Polarity
Dimethyl silicone oil 0–350
C Very low
Phenyl methyl silicone oil 0–350
C Low
Phenyl cyanopropyl
methyl silicone
0–275
C Medium
Carbowax 1540 0–200
C High
Analysis of Organic Pollutants 523
TM
Copyright n 2004 by Marcel Dekker, Inc. All Rights Reserved.
on temperature. When analyzing a broad suite of hydrocarbons, for
example, it is not possible to select a column that is capable of
discriminating between all determinants. The most volatile fraction will
move rapidly along the column, while the larger molecules will trail
significantly behind. To speed up this process, the oven can be adjusted to
produce a temperature ‘‘ramp’’ during which the column temperature
changes across a predetermined regime. This simply means that as the
analysis is progressing, the oven temperature is progressively raised, which
means that the sample begins to reach ‘‘vapor pressure’’ and elutes more
readily through the column. Without the use of this ramp, retention time
would rise significantly if the temperature were set too low, whereas if the
temperature were initially set too high, all the determinants would elute
together.
The Detector. Thermal conductivity detectors (TCDs) and flame
ionization detectors (FIDs) are the most commonly used types. Because of
its lack of specificity, the TCD is more appropriate for gas analysis (see
Chap. 10), and it will not be considered in more detail here. The FID,
however, is an excellent detector for a wide range of determinants because it
responds to the presence of organic carbon compounds (but not to CO,
CO
2
,orCS
2
). In the FID, the passage of the organic compounds through a
hydrogen-rich flame results in the creation of ions and a corresponding
electrical response. The FID is sensitive at the mgL
À1
level to a plethora of
compounds (Marr and Cresser, 1983). It is also a very forgiving detector, as
it has a linear response to concentration over seven orders of magnitude and
is resistant to overload and damage. Flame photometric detectors (FPDs)
can be used to measure determinants containing specific groups, including
organic S, P, and Sn compounds (Singh et al., 1996). The FPD has a range
of filters to suit the optical emission characteristics of the target
determinants. The halogen-specific detector or the electron capture detector
(ECD) is an essential detector for the measurement of trace levels of
organochlorine compounds (Schulz et al., 1989).
The most significant detector used for routine analysis now is the mass
spectrometer. This is an excellent tool for identifying a range of unknown
determinants in the target matrix. Over the last decade the application of
this detector in water, soil, and sediment analysis has grown enormously,
and as a consequence the cost has dropped. After separation of components
in an appropriate column, the eluted fractions are subjected to electron
impact or chemical ionization. The fragmented and molecular ions are
resolved from characteristic mass spectra and determinants identified from
their distinctive primary and secondary ions. Quantification is achieved by
peak height, representing the total ion count, at each specific mass : charge
524 Dawson et al.
TM
Copyright n 2004 by Marcel Dekker, Inc. All Rights Reserved.
ratio. Although widely used, there is no specific example in this chapter, but
examples can be found in the literature (De la Guardia and Garrigues, 1998;
Eriksson et al., 1998; Ragunathan et al., 1999; Choudhary et al., 2000). The
mass spectrometer detector requires a high vacuum, while the gas
chromatograph requires a gas flow. Hence GC-MS coupling is achieved
by combining a low flow rate with the use of a fast pumping low-density
carrier gas, usually helium. The capillary GC can produce sharp peaks,
which enables a rapid scan with the mass spectrometer, and it is generally
acknowledged that a mass spectrometer detector is as sensitive as a
flame ionization detector. With the application of a mass spectrometer
detector, a library of stored spectra makes it possible to identify unknown
determinants.
Chromatographic Analysis and Quantification. Modern GCs are
computer-controlled, and the resultant chromatograms are generally
managed and analyzed by an appropriate software system. An older GC
is usually managed manually and the results calculated from an integrator
output. As with all other methods, calibration curves for the target
determinant(s) must be prepared from at least four standards. Calibration
can be performed with external or internal standards, though it is most
common to use an internal standard method. This involves the addition of
equal volumes of an internal standard to each of the calibration standards
and the sample extracts, to ensure reproducibility of detector response.
Further details about standardization and quantification can be found in
Harvey (2000).
Routine GC analysis for soil and/or sediment samples involves
carrying out confirmatory calibration checks prior to sample analysis to
verify consistency of response. Variations in the gas flow, in the presence of
impurities, in the consistency of injection, and in oven temperatures may
cause substantial variations in the response. It is also worth noting that the
length and ‘‘plumbing’’ of the column will have an impact on the retention
characteristics, so analytical setup time can be substantial for complex
determinants.
2. High Performance Liquid Chromatography
In this instrument, liquid/sorbed-phase chromatography is the principle of
separation. The analyte is carried in a liquid that is supported (adsorbed) on
an inert solid. The separation efficiency of a column can be expressed in
terms of the theoretical plates in the column, which are defined by the
physical structure of the column and the type of packing (Harvey, 2000). A
sample is placed at the start of the column, and sample constituents are
Analysis of Organic Pollutants 525
TM
Copyright n 2004 by Marcel Dekker, Inc. All Rights Reserved.
flushed through the column by the carrier solvent(s). The component parts
of the instrument are
The pump, which may be binary or quaternary. In the case of a binary
pump, two-solvent mixtures can be regulated. A real-time pressure feedback
and control system automatically provides solvent compressibility compen-
sation for accurate and precise flow, regardless of solvent composition.
Consistent gradients and precise retention times are provided by proven
control algorithms and high-speed proportioning valves.
The solvent vacuum degaser is commonly next in line to the pump on
a modern instrument. This component ensures optimal performance of the
HPLC pump system. The removal of the gases from the solvents allows more
stable baselines, improved gradient shape, and high temporal reproducibility.
Dissolved gases account for most of the common problems encountered
in routine analyses, such as bubble formation, pump cavitation, detector
noise, baseline drift, and loss of gradient precision. This solvent degaser
ensures the optimum performance of the HPLC system by thoroughly
removing these dissolved gases from the mobile phase. All wetted materials in
the degaser are chemically and biologically inert. This ensures maximum
corrosion resistance and compatibility with sensitive biomolecules.
The column is ideally maintained in a temperature-controlled
incubator. The column is selected according to the specific application. A
useful ‘‘general column’’ is a C18 reverse phase column, which is composed
of bonded silica. The applications for this include a wide range of nonionic
polar compounds and aromatics.
The detector that is most commonly used is a multiwavelength UV/
visible type. The detector has a flowcell into which column-partitioned
fractions of the determinant are passed. Time-programmable functions
enable optimization of separations or exchange. The detector must be able
to respond to particularly small volumes of determinants separated by the
column. Accordingly, rapid response is required. Photometric detectors
provide the necessary sensitivity, and often the limitation may prove to be
the subsequent integrator. The main photometric detector is usually
composed of a dual-lamp design, ensuring sensi tivity across the entire
UV/visible spectrum. A modern system will have high-speed scan
mechanisms capable of achieving a slewing speed of 30,000 nm s
À1
and
positional precision accuracy of less than 0.01 nm (Agilent, 2001). This
scanning ability means that detection can be achieved at the peak of the
absorption spectrum, offering a combination of selectivity and sensitivity.
The cell volume should not be greater than one tenth of the volume
containing the determinant yielding the smallest peak likely to be
encountered, and it should be designed so that any bubbles can be rapidly
cleared; this is often achieved by using a restriction block downstream
526 Dawson et al.
TM
Copyright n 2004 by Marcel Dekker, Inc. All Rights Reserved.
(Agilent, 2001). Refractive index detectors are also available but have fewer
applications for environmental samples, as they have notoriously unstable
baselines. The most significant developments at the moment are taking place
in LC- mass spectrometric detectors. This type of detector is commercially
available from a range of manufacturers and has been widely used in the
pharmaceutical and biochemical industries. Over the next decade it is likely
to have a significant effect on soil and sediment analysis, as GC-MS has had
over the past decade. Applications to soil analysis that have been published
include, for example, the determination of organometal speciation and
recalcitrant compounds (Dass, 1999; Mondello et al., 1999).
Integration. Automation of chromatographic operation is comple-
mented by automation of peak integration. Original ly, when chromatograms
were recorded on chart paper, researchers would cut out the peaks and
weigh them to quantify the determinants. Now the PC achieves high-
resolution determination of peak areas with user-friendly software. It can
calculate the retention times and recognise peaks as required. It also enables
computerization of all of the data collation, which can be extrensive.
Chromatographic analysis features include use of wavelength ratios,
baseline subtractions, and mathematical manipulations, including first and
second derivatives.
III. APPLICATIONS: CASE STUDIES
A. Determination of Total Petroleum Hydrocarbons (TPHs)
in Soil Using FID-GC
1. Method of Extraction and Analysis
Typically, this technique is used for comparative evaluation either in a
spatial or a temporal context. There is a need therefore to be able to put
through a large number of samples and to have a relatively rapid extraction
technique that has been developed and optimized specifically for TPHs.
Approximately 10 g soil (wet weight) is weighed accurately (Æ0.01 g) and
ground over anhydrous Na
2
SO
4
using a mortar and pestle, until the soil/
Na
2
SO
4
mixture is fluid. The sample is transferred to a 250mL conical flask
equipped with a PTFE-lined screw cap, and 1 mL of internal standard
solution (see below) added. This mixture is then extracted by sonication in
50 mL of dichloromethane (DCM) (glass-distilled grade) for 10 minutes and
filtered through Whatman No. 4 paper. The extraction is repeated with
25 mL of DCM, filtered through the same paper, and the two extracts
combined. An aliquot of the extract (5 mL) can then be stored at À20
Cina
foil-capped vial for future use; the remainder, for analysis, can be
Analysis of Organic Pollutants 527
TM
Copyright n 2004 by Marcel Dekker, Inc. All Rights Reserved.
evaporated under nitrogen at 40
C to a volume of 1 mL. The extract is then
cleaned by liquid chromatography using 2 g of octadecyl-bonded silica
(60 A
˚
, < 200 mm) conditioned with 10 mL of DCM. The sample is then
loaded onto the column and eluted with 2 Â10 mL of DCM. The eluate can
then be concentrated further as necessary by evaporation under a stream of
nitrogen at 40
C.
TPHs are measured by FID-GC. Extract (1 mL) is injected using an
autosampler onto a GC equipped with a Phenomenex ZB-1 (100%
polydimethylsiloxane) capillary column (30 m Â0.32 mm i.d. Â0.5 mm),
split injector, and flame ionization detector. GC conditions are as follows:
column gas flow (N
2
): 1 mL min
À1
; split flow: 20 mL min
À1
. Injector
temperature is varied to suit the associated hydrocarbon composition:
200
C (kerosene); 250
C (diesel and motor oil). The detector temperature is
held at 250
C for kerosene, 320
C for diesel and 350
C for motor oil. As
previously discussed, to cope with analyzing this complex matrix, a
temperature ramp is used: the temperature is held initially at 80
C for
2 minutes, then increased at 10
Cmin
À1
to 250
C (for kerosene), 320
C
(for diesel), and 350
C (for motor oil), after which it is held for a further
10 minutes at the final temperature.
The internal standard (IS) is a chemically related compound of known
concentration, but not present in the environmental samples, used to test
extraction and chromatographic performance as well as the reproducibility
of the techniques. Ideally, an IS should be added at both the extraction and
analysis stages. Squalene is used as the IS for diesel, while pristane is used as
an IS for kerosene and motor oil (pristane elutes after the kerosene envelope
[the mixture of components constituting kerosene] and before the motor oil
envelope). The IS can be dissolved in DCM and stored in a UV-proof bottle
with a PTFE-lined screw cap. Routinely R
F
(response factor) values are
calculated over a range of 5 concentrations, and nonlinear regressions are
fitted of R
F
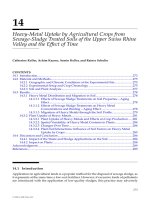
against concentration. Quantification includes some unresolved
complex mixtures (UCMs) as well as resolved peaks. A typical resulting
chromatogram is shown in Fig. 2.
2. Critical Evaluation of the Technique
Estimation of TPHs is the most commonly performed quantification for
petroleum contamination and typically is used to set regulatory levels and
cleanup targets. There are tw o techniques for measuring TPHs. First,
infrared spectroscopy can be used to measure the absorption at 2930 cm
À1
(corresponding to the methylene C-H stretching frequency (Lambert et al.,
2001). This has the disadvantage of poor sensitivity to aromatic compounds.
It is also necessary to use a solvent with no C-H bonds, e.g., a
528 Dawson et al.
TM
Copyright n 2004 by Marcel Dekker, Inc. All Rights Reserved.
perhalogenated freon compound, which is very expensive. Alternatively,
FID-GC can be used. The entire signal is integrated to provide a measure of
TPH, or TPH can be measured for specific classes of compounds after
preliminary liquid chromatography (LC) fractionation (e.g., alkanes,
aromatics). As described, TPH determination by IR is insensitive to
aromatics, making it unsuitable for heavy oils, or for oils that have
undergone extensive weathering. Measuring TPHs by FID-GC also has
drawbacks, as it is necessary to calibrate the analysis on a standard
sample of oil. Often it is difficult to obtain a pristine oil sample to enable
a standard calibration curve to be made. Instrumental limitation also plays
a part: FID-GC can produce overrecoveries caused by memory effects in
the column; of significantly greater concern is the fact that after several
weeks of weathering (degeneration and decay of the oil sample) in the
environment, GC traces may collapse to UCMs. Finally, TPH determina-
tion is an inherently limited technique, as it produces only a single numerical
measurement of contamination. However, this makes it a popular choice for
regulators, who prefer a straightforward and easily measured standard
(Schreier et al., 1999).
Whittaker et al. (1995, 1996) discussed the possible use of compound-
specific isotope ratio-MS for assessing oil contamination and concluded that
a major drawback is that the detailed effects of degradation on isotope
Figure 2 A typical chromatogram of diesel oil extracted from sandy soil. TPH can
be calculated by adding each of the component fractions identified. PRIS: pristane;
PHY: phytane; SQUA: squalene.
Analysis of Organic Pollutants 529
TM
Copyright n 2004 by Marcel Dekker, Inc. All Rights Reserved.
ratios of individual compounds are not well characterized. It is thought that
d
13
C increases for saturates, decreases for asphaltenes, and remains largely
unchanged for aromatics, once the hydrocarbons are in soils. Physical
effects, such as migration through soil, could also alter isotope ratios.
B. Determination of Readily Extractable Chlorophenols and
Total Chlorophenols in Soil Using HPLC
1. Readily Extractable Chlorophenols
In this study, 2,4-dichlorophenol (2,4-DCP), 2,4,6-trichlorophenol (2,4,6-
TCP), pentachlorophenol (PCP), and 2,4-dibromophenol (2,4-DBP) are the
target determinants, and 2,4-dibromophenol is used as an internal standard.
Soil samples are sieved through a 2 mm sieve and stored at 4
C. A 5 g soil
subsample (based on dry soil) is weighed and extracted with water or a
mixture of methanol and water with a ratio of 1 : 1. The soil extract is
cleaned up by SPE in order to cleanup the sample and preconcentrate the
chlorophenols. 100 mg Bond Elut C18 (1 mL capacity) is used as absorbent
material for trapping chlorophenols. The SPE column is conditioned with
1 mL of methanol, and the sample preparation is performed on the SPE
manifold (suction pump and sample manifold). The aqueous soil extract
sample is passed through the column at 1 mL min
À1
or less. Sample volume
affects the breakthrough volume, and this is determined both by column
capacity and the efficiency of extraction. After this the column is washed
using 1 mL of doubly deionized water. The chlorophenols are then eluted
from the column using 1mL methanol and collected into HPLC-compatible
vials for determination. Darkened (amber) vials are routinely used to avoid
photodegradation of samples.
2. Total Chlorophenols in Soil
Soil (10 g) is sieved to 2 mm and placed in a cellulose Soxhlet extraction
thimble. A portion of 10 g of anhydrous sodium sulfate is added to the
thimble. The water content of the soil determines the actual amount of
sodium sulfate required. The thimble is placed in a Soxhlet unit with a few
boiling chips and refluxed as required, usually overnight, with 500 mL of
hexane. The use of a Bu
¨
chi extraction system has streamlined the whole
extraction procedure, and it is now possible to carry out a rigorous Soxhlet
extraction in about 4 hours instead of overnight (Ehlers et al., 1999). After
extraction, the sample is transferred to a rotary evaporator flask, and the
solvent is evaporated until 5 mL of the sample remains. Using a long-necked
Pasteur pipette, the sample is transferred to a 10 mL volumetric flask. The
sample is then passed through a PTFE filter to remove particulate matter.
530 Dawson et al.
TM
Copyright n 2004 by Marcel Dekker, Inc. All Rights Reserved.
3. Determination of Chlorophenols
The extracts can be analyzed by liquid chromatography. The analytical
column, supplied by Thomson Scientific, Aberdeen, Scotland, is an ODS-
IK5-2509 (15 cm Â4.6 mm i.d.), packed with ODS2-Inertpak, with a particle
diameter of 5 mm. The mobile phase is 70% acetonitrile and 30% 0.1%
acetic acid in HPLC-grade water at 1 mL min
À1
. The detector is set at
230 nm. The optimization of the HPLC system is carried out as follows:
1. Pass the mobile phase through the column at 1 mL min
À1
for
at least 30 minutes to equilibrate it.
2. Inject pure methanol (at least 5 injections) to check the
background level or noise of signal.
3. Inject individual standards in triplicate to check retention times.
4. Create a calibration graph.
5. Run the calibration first and then run samples, using sample
queuing.
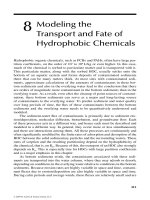
4. Critical Evaluation of Technique
The efficiency of SPE using Bond Elut C18 (1 mL) can be described in terms
of percentage recovery. The results for the readily extracted chlorophenols
can be summarized as 2,4-DCP 95.5%, 2,4-DBP 86.8%, 2,4,6-TCP 83.7%,
and PCP 85.8% recovery. As can be seen from Fig. 3, the SPE is most
effective when there is methanol (up to 20% for DCP and TCP) present in
Figure 3 Effect of percentage of methanol in aqueous phase on the recovery of
chlorophenols extracted by SPE.
Analysis of Organic Pollutants 531
TM
Copyright n 2004 by Marcel Dekker, Inc. All Rights Reserved.
the extraction phase. The SPE enables the LC to produce a clean well-
distinguished peak.
The extractions are highly dependent upon the amount of water
present in the soil sample. In the case of hexane, as it is nonpolar and
immiscible in water, it is ineffective at high water contents. Conversely, in a
very dry soil, the highly halogenated compounds become irreversibly bound.
McGrath and Singleton (1997) reported that for PCP, optimal extraction
could be achieved at 10–30% moisture content for an arable soil at pH 7.5,
but for an organic soil at pH 4, moisture contents of between 40 and 70%
were more favorable.
The reason that hexane can be used for a total extractable
chlorophenol determination is that the solvent extracts far less interfering
soil carbon, thus reducing the cleanup requirements. However, this does
mean that it is not applicable to all soils, and users may have to use a more
polar, water-miscible extractant, such as acetone, methanol, or an
appropriate mixed extractant. When the sample is dissolved in hexane, the
mobile phase may be enhanced if methanol replaces acetonitrile.
One of the major problems of using soil extracts in HPLC is the
chance of column damage as a consequence of particulate and other organic
extractable material being deposited on the column. A guard column or a
filtration unit can prevent this damage and improve peak resolution and
consistency. It is important either way to allow the column to settle for a
considerable period of time before analysis, as the presence of a complex soil
organic matter fraction can disrupt each of the component parts of the
HPLC. To verify the performance, it is also wise to run standard samples
regularly during analysis.
C. Analysis of Polychlorinated Biphenyls in Soils and
Sediments, Using Soxhlet Extraction and ECD-GC
Polychlorinated biphenyls (PCBs) and organochlorines are present in all
environment samples. Unlike chlorophenols, PCB concentrations tend to be
low and a trace analysis technique is required. The most suitable and
sensitive method is gas chromatography with an electron capture detector
(ECD).
1. Method
Soil samples that have been collected should be stored cold or frozen.
Samples are then air dried in a fume hood before analysis. It is advisable
first to determine the approximate concentration of PCBs present. For this a
1 g aliquot of soil is shaken with 10 mL of acetone and then shaken twice in
532 Dawson et al.
TM
Copyright n 2004 by Marcel Dekker, Inc. All Rights Reserved.
succession with mixtures of 1 mL acetone and 9 mL hexane. The samples are
then cleaned and analyzed by ECD-GC. By determining the approximate
amount in this way, the weight of soil that should be used for Soxhlet
extraction for the main determination can be assessed.
For the Soxhlet extraction, an appropriate amount of soil is weighed
into a cellulose extraction thimble and spiked with 2,4,6-trichlorobenzene.
The extraction is carried out for 24 hours wi th 100 mL of a 1 : 1 acetone :
hexane mixture. The volume of the extractant is reduced by rotary
evaporation and the remainder shaken with acid-rinsed copper powder to
remove sulfur. The sample is then placed in a separating funnel and back
extracted with saline water to remove the acetone. The remaining hexane is
then mixed with 4 mL of concentrated sulfuric acid. The acid is then
removed and the sample rinsed with saline water. Anhydrous sodium sulfate
is then used to remove any remaining water from the sample, which is then
passed through a column composed of Florosil and acid-rinsed copper
powder. At this stage, an internal standard such as p-chlorobiphenyl or
tetrachloro-m-xylene can be added to the sample.
2. Analysis
The instrument used is a GC equipped with an ECD and a selective column.
The columns used are either a CP-Sil5 CB fused silica WCOT or a Pheno-
menex ZB-5 (5% phenyl polysiloxane) capillary column (60 m Â0.32 mm
i.d. Â0.25 mm). Helium is used as the carrier gas and nitrogen as the
makeup gas. A 2 mL sample is introduced using split injection (10 : 1) at
220
C. The oven programme is held at 130
C for 1 min, ramped at
3
Cmin
À1
to 300
C and held at this temperature for 5 minutes. Quantifica-
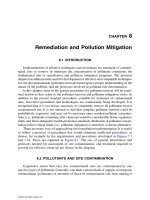
tion of the PCB congeners (209 theoretical PCB molecules that differ in the 1
to 10 position of chlorine atoms) is carried out by using the internal
standard technique. A typical chromatogram is shown for 56 PCB
congeners in Fig. 4. The use of an effective data management system is
paramount for resolving the peaks.
3. Critical Analysis of Technique
This method is tried and tested and has been shown to be very effective. The
problem is that there are many steps that require, in some cases, the use of
specialized equipment. Dealing with trace levels of determinants means that
cleanup techniques and concentration techniques have to be scrutinized
carefully.
It is likely that the Soxhlet stage will determine the effectiveness of
extraction; laboratories that are intending to complete a great deal of this
type of analysis are required to calibrate the performance. This method also
Analysis of Organic Pollutants 533
TM
Copyright n 2004 by Marcel Dekker, Inc. All Rights Reserved.
requires rotary evaporation for solvent reduction though some laboratories
use Kuderna-Danish apparatus for concentrating materials dissolved in
volatile solvents. This apparatus comes in various sizes and consists of a
flask, a Snyder column containing glass, pear-drop shaped balls, and a
graduated receiving vessel. It is difficult to estimate the effect of this
alternative, and often the more common rotary evaporation apparatus is
easier to use and maintain.
The biggest variations in the methodology are found in the actual
chromatography (Schulz et al., 1989). Some users prefer the use of
on-column injection, but this is often difficult to justify, as column damage
is more likely when the sample is injected on-column. To resolve this
problem, some users fit a short precolumn to guide the injection effectively
into the column and to reduce the problems associated with overload. In a
quality control environment, this is a commendable approach to trace
analysis, but in some laboratories it is not feasible. An alternative is the use
of a split injector, which will reduce the sensitivity of the system but will
prolong the life of both the column and the detector. The main objective in
the methodology is to attempt to differentiate as many congeners as possible
using a strict protocol for preparation and analysis. For some analyses
(most notably the USEPA Method 8081), the objective is to simplify the
chromatogram and to use a few specific indicator peaks to estimate the
Figure 4 Chromatogram showing 56 resolved PCB congeners.
534 Dawson et al.
TM
Copyright n 2004 by Marcel Dekker, Inc. All Rights Reserved.
PCB load. For environmental policy purposes this approach may be
adequate, but for studies of degradation this level of detail may not suffice.
Although there is an increasing number of studies using GC-MS analysis for
PCBs (Font et al., 1996), most users still feel that peak resolution and
identification is best achieved using ECD-GC.
D. Determination of Volatile Organic Contaminants (VOCs)
Using Purge and Trap Injection (PTI) and FID-GC
Water-soluble volatile organic contaminants are difficult to extract from
their aqueous phase. The partitioning of the pollutant is such that seven or
eight hexane extraction procedures may be required to remove a sizable
fraction from the water phase. The analysis of these compounds is best
performed using a technique that avoids a chemical extraction. A ‘‘purge
and trap’’ is ideal for the analysis of monoaromatics, chlorinated
monoaromatics, and other light hydrocarbon fractions. As the compounds
are volatile a great amount of care must be taken in sampling, to avoid
losses.
1. Purge and Trap Methodology
The PTI technique is used in conjunction with a GC equipped with an FID
(Fig. 5). A water sample is purged with helium and then trapped in a liquid
nitrogen cooling system where the condenser separates the water from the
target determinants. The water is discarded. After purging is complete, the
sample is forced into the heating rod, where a very rapid rise in temperature
makes possible an on-column injection of the VOCs, and standard
chromatographic analysis. For soil analysis, instead of using a water
extract, a soil sample can be placed in a glass liner and purged directly on
the instrument.
The PTI-FID-GC system requires H
2
(fuel gas), air (combustion/
oxidizing gas), N
2
(makeup/preflush/backflush gas) and He (purging/carrier
gas). The PTI has a number of parameters that need to be set and optimized
before a sample can be injected. These are
The length of one cycle
The temperature of the injector rod, which is the heated interface
between the PTI and the column
The backflush rate through the condenser
The temperature of the cold trap during precooling and desorption
The time in which the system cools down the cold trap to the set
temperature
The temperature of the desorption oven during preflush
Analysis of Organic Pollutants 535
TM
Copyright n 2004 by Marcel Dekker, Inc. All Rights Reserved.
The time for the preflush mode that removes the water from the system
The use (or not) of split flow during purging
The temperature in the desorption oven during the purge mode
The time for the desorption mode
The temperature of the cold trap during injection
The temperature and time for the backflush mode
It is possible to set the flow rates for the different modes described
above without having to carry out a run. On most instruments, the flow of
each mode needs to be measured with a flow meter via the outlets on the
main instrument block. The gas flows for the carrier and FID are measured
at the outlet to the FID, usually when the detector is cool. Once the
parameters have been optimized, the next stage is to reduce the temperature
of the cryobath down to À10
C and also activate the flow of liquid N
2
from
the cylinder. The standard protocols used for the detection of BTEX and
MtBE by PTI FID-GC are shown in Table 3.
Figure 5 The PTI FID-GC instrument system.
536 Dawson et al.
TM
Copyright n 2004 by Marcel Dekker, Inc. All Rights Reserved.
The GC column used is a DB-MtBE, (30 m, 0.45 mm i.d.) from J&W
Scientific (Folsom, CA, USA). The GC oven program is as follows:
isothermal operation at 45
C for 12 min, then increasing to 190
Cat
20
Cmin
À1
, and finally holding at 190
C for 5 min.
2. Critical Analysis of Technique
The purge and trap procedure is used much more widely in the US than it is
in Europe, where there is a general preference for headspace analysis (Seto,
1994). In headspace sampling, the sample is placed in a closed vial with an
overlying headspace. After allowing time for volatile determinants to
equilibrate between sample and overlying air, a portion of the vapor phase is
sampled by syringe and directly injected into a GC (Harvey, 2000).
There are significant differences in the results obtained by the two
methods, and each offers strengths and weaknesses in applications. Mineral
soils are adequately measured using headspace analysis at 95
C, but those
with high organic matter content give poor reproducibility. One of the
greatest criticisms levelled at PTI is that it is prone to the introduction of
errors. The reasons for this are that
The instrumental system is complex and has many valves that may be
inadequately sealed. Minimizing instrumental errors is essential in
trace analysis.
Because of the requirement for active purging, any gaseous impurities
will have a substantial effect on the sample analysis. The nature
of the determinants and Henry’s law constant determines the
purging rate.
Table 3 PTI Settings for the Determination of Volatile
Organic Contaminants
Operation Settings
Temp (
C) Time (min) Flow rate
(mL min
À1
)
Trap precooling À100 2
Preflushing 200 1 10
Purging 250 11 15
Injection 250 1
Backflushing 275 10 10
Total cycle time 25
#carrier is He at 10 mL min
À1
; heating rod temperature setting at 290
C.
Analysis of Organic Pollutants 537
TM
Copyright n 2004 by Marcel Dekker, Inc. All Rights Reserved.
Desorption of the trapped sample is dependent upon the flow rate and
the temperature. The objective of an instantaneous release (hence
minimum chromatographic band broadening) can only be realized if
the setup procedure is fully optimized.
Highly concentrated determinants are prone to carryover, affecting
subsequent samples; so the user must be able to estimate the level of
dilution required.
Miermans et al. (2000) favored the complementary use of PTI
FID-GC and PTI GC-MS, as the MS makes it possible to detect unknowns.
They noted that there is a limited range of materials readily detectable
by PTI.
Purge and trap is acknowledged as a mature and widely characterized
technique, but the instruments are undergoing major modifications due to
user applications and competitive marketing. It is one of the few solventless
extraction techniques, making it applicable in sensitive working environ-
ments and also, in terms of analysis, reflects realistic environmental
matrices.
IV. CONCLUSIONS
Over the last few years, chemical analysis for organic contaminants in
environmental samples has become significantly more accessible to a wider
range of users. The cost of chromatography has dropped, and instead of
requiring highly specialized chromatographers, the introduction of auto-
mation and effective software has made this ‘‘black art’’ more accessible.
Just as the number of papers on determination of heavy metals boomed in
the 1980s, we are now seeing this repeated for organic contaminants.
Techniques are best developed and modified from existing protocols to
suit the apparatus and instruments of each laboratory and to answer the
specific question posed. When a technique is adopted, the user must be able
to evaluate critically the shortcomings of the method and the steps needed to
resolve them. Above all, the level of sophistication required in these analyses
must never be compromised by poor field sampling. Ideally the laboratory
scientist and the field scientist should actively communicate prior to
sampling to avoid problems arising.
Chemical analysis of these organic pollutants is restricted less by the
access to instrumentation than by the time constraints of producing clean
preconcentrated samples. There is no doubt that over the next few years the
cost of GC-MS and LC-MS will drop as the robustness of the apparatus
to environmental samples and extracts increases. As regulators and
538 Dawson et al.
TM
Copyright n 2004 by Marcel Dekker, Inc. All Rights Reserved.
practitioners enforce and respond to guidelines regarding organic contami-
nants, there is an ever-growing need to develop these technologies for
use by the wider scientific community.
ACKNOWLEDGMENTS
The authors wish to thank Rebekka Artz for use of the diesel extract
chromatogram in Fig. 2 and Tinnakorn Tiensing for reproduction of Fig. 3.
REFERENCES
Abalos, M., J.M. Bayona, R. Compano, M. Granados, C. Leal, and M.D. Prat.
1997. Analytical procedures for the determination of organotin compounds in
sediment and biota: a critical review. J. Chromatogr. A 788:1–49.
Abdallah, A.M.A. 1994. Isolation of petroleum and chlorinated hydrocarbons from
the same extract. Toxicol. Environ. Chem. 44:129–135.
Agilent. 2001. Agilent Technologies. .
Alonso, M.C., D. Puig, I. Silgoner, M. Graserbauer, and D. Barcelo. 1998.
Determination of priority phenolic compounds in soil samples by various
extraction methods followed by liquid chromatography atmospheric pressure
chemical ionization mass spectrometry. J. Chromatogr. A 823:231–239.
Bruno, T.J. 2000. A review of capillary and packed column gas chromatographs.
Separ. Purif. Meth. 29:27–61.
Camel, V. 2001. Recent extraction techniques for solid matrices—supercritical fluid
extraction, pressurized fluid extraction and microwave-assisted extraction:
their potential and pitfalls. Analyst 126:1182–1193.
Cho, B.H., H. Chino, H. Tsuji, T. Kunito, H. Makishima, H. Uchida, S.
Matsumoto, and Oyaizu, H. 1997. Analysis of oil components and
hydrocarbon-utilizing microorganisms during laboratory-scale bioremediation
of oil-contaminated soil of Kuwait. Chemosphere 35:1613–1621.
Choudhary, G., A. Apffel, H.F. Yin, and W. Hancock. 2000. Use of on-line mass
spectrometric detection in capillary eletrochromatography. J. Chromatogr. A
887:85–101.
Dass, C. 1999. Recent developments and applications of high-performance
chromatography electrospray ionization mass spectrometry. Curr. Org.
Chem. 3(2):193–209.
Dean, J.R., and G.H. Xiong. 2000. Extraction of organic pollutants from
environmental matrices: selection of extraction technique. Trac-Trend Anal.
Chem. 19:553–564.
De la Guardia, M., and S. Garrigues. 1998. Strategies for the rapid characterization
of metals and organic pollutants in solid wastes and contaminated soils by
using mass spectrometry. Trac-Trend Anal. Chem. 17:263–272.
Analysis of Organic Pollutants 539
TM
Copyright n 2004 by Marcel Dekker, Inc. All Rights Reserved.